POF FBG Sensors: Next-Generation Technology for Plantar Pressure Mapping and Advanced Gait Analysis
This article provides a comprehensive review of polymer optical fiber (POF) fiber Bragg grating (FBG) sensor technology for plantar pressure measurement and gait analysis.
POF FBG Sensors: Next-Generation Technology for Plantar Pressure Mapping and Advanced Gait Analysis
Abstract
This article provides a comprehensive review of polymer optical fiber (POF) fiber Bragg grating (FBG) sensor technology for plantar pressure measurement and gait analysis. Tailored for researchers and biomedical engineers, it explores the fundamental principles and material advantages of POFs over silica fibers. We detail current fabrication methods, sensor integration into footwear and insoles, and data acquisition systems. The content addresses key challenges in calibration, crosstalk mitigation, and durability, while critically evaluating system performance against established technologies like force plates and pressure mats. Finally, we examine validation protocols and discuss the future trajectory of POF-FBG systems in clinical diagnostics, rehabilitation, and sports science.
Understanding POF-FBG Sensors: Core Principles and Advantages for Biomechanics
Core Principles and Applications in Sensing
A Fiber Bragg Grating (FBG) is a periodic modulation of the refractive index within the core of an optical fiber. This structure acts as a wavelength-specific reflector. The fundamental principle is governed by the Bragg condition:
λB = 2neff Λ
where λB is the Bragg wavelength (the reflected wavelength), neff is the effective refractive index of the fiber core, and Λ is the grating period. Both neff and Λ are sensitive to external perturbations such as strain (ε) and temperature (ΔT), leading to a shift in the Bragg wavelength (ΔλB). This shift forms the basis for FBG sensing:
ΔλB / λB = (1 - pe)ε + (αΛ + α_n)ΔT
where pe is the photo-elastic coefficient, αΛ is the thermal expansion coefficient, and α_n is the thermo-optic coefficient.
Table 1: Key FBG Sensing Parameters and Typical Values
| Parameter | Symbol | Typical Value (Silica Fiber) | Description |
|---|---|---|---|
| Bragg Wavelength | λ_B | 1550 nm (C-band common) | Central reflected wavelength. |
| Strain Sensitivity | Δλ_B/ε | ~1.2 pm/με at 1550 nm | Wavelength shift per microstrain. |
| Temperature Sensitivity | Δλ_B/ΔT | ~10 pm/°C at 1550 nm | Wavelength shift per °C. |
| Bandwidth (FWHM) | Δλ | 0.1 - 0.5 nm | Spectral width of reflected peak. |
| Reflectivity | R | >90% (common) | Percentage of light reflected at λ_B. |
In the context of plantar pressure and gait analysis, Polymer Optical Fiber (POF) FBGs offer distinct advantages over traditional silica FBGs. POFs, typically made from PMMA, have a lower Young's modulus, making them more sensitive to strain (higher Δλ_B/ε). This is critical for measuring subtle biomechanical forces. Furthermore, POFs are more flexible and biocompatible, enhancing comfort and safety for in-shoe sensing applications.
The Scientist's Toolkit: Research Reagent Solutions
Table 2: Essential Materials for POF FBG Fabrication and Characterization
| Item | Function in Research | Key Considerations for Plantar Pressure/Gait Analysis |
|---|---|---|
| Polymer Optical Fiber (POF) | Sensing medium. Typically PMMA or TOPAS cyclic olefin copolymer. | Low modulus for high strain sensitivity. Biocompatibility for wearability. Durability against repeated flexing. |
| Phase Mask | Creates the interference pattern for grating inscription. Period defines λ_B. | Must be matched to the UV absorption peak of the polymer (e.g., ~325 nm for PMMA). |
| UV Laser Source | Provides coherent light for photosensitive refractive index change in POF core. | Wavelength: Commonly 325 nm HeCd or 248 nm KrF excimer. Power/Energy: Critical for inscription efficiency in POFs. |
| Optical Spectrum Analyzer (OSA) | Measures the reflection/transmission spectrum of the FBG to determine λB, ΔλB. | High resolution (<10 pm) required to track small pressure-induced shifts. |
| Broadband Light Source | Emits light across a wide wavelength range (e.g., 1500-1600 nm) to interrogate the FBG. | Stability is key for long-term, dynamic measurements. |
| Interrogator Unit | A specialized instrument to track λ_B shifts of multiple FBGs in real-time. | Scanning frequency must be high (>100 Hz) for dynamic gait events. |
| Calibration Rig | Applies known strain or pressure to the POF-FBG for sensor calibration. | Must simulate plantar loading conditions (range: 0-1000 kPa, dynamic). |
Experimental Protocols
Protocol 1: Inscription of a POF Bragg Grating via the Phase Mask Technique
Objective: To fabricate a single FBG in a single-mode or few-mode polymer optical fiber. Materials: POF (e.g., doped PMMA), UV laser system, phase mask, 3-axis translation stages, power meter, optical spectrum analyzer (OSA), broadband source.
- Fiber Preparation: Strip ~2 cm of the POF's protective coating using a chemical solvent (e.g., acetone for PMMA) or mechanical stripper. Clean thoroughly with isopropyl alcohol.
- Phase Mask Alignment: Mount the phase mask on a stable holder. Align the stripped section of the POF in near-contact and parallel to the phase mask using micrometric translation stages.
- Laser Inscription: Position the UV laser beam to illuminate the phase mask uniformly, creating an interference pattern on the fiber core. Typical inscription parameters for a 325 nm HeCd laser on PMMA-POF: Power Density: 10-50 mW/cm², Exposure Time: 10-30 minutes. Monitor inscription progress in real-time by observing the growth of the reflection peak on the OSA.
- Post-Processing: Anneal the inscribed FBG at 50-60°C for 24 hours to stabilize the grating and remove residual stresses.
Protocol 2: Calibration of a POF-FBG for Uniaxial Strain
Objective: To determine the strain sensitivity coefficient (Δλ_B/ε) of the fabricated POF-FBG. Materials: POF-FBG sample, calibration rig (e.g., two translation stages), laser micrometer, OSA or interrogator, adhesive (cyanoacrylate).
- Mounting: Fix one end of the POF-FBG to a stationary stage. Attach the other end to a movable, precision translation stage. Ensure the fiber is taut but not strained. Measure the initial gauge length (L₀) with the laser micrometer.
- Baseline Measurement: Record the initial Bragg wavelength (λ_B₀) using the OSA/interrogator at zero applied strain.
- Strain Application: Incrementally move the translation stage to apply known displacements (ΔL). Calculate applied strain: ε = ΔL / L₀. Recommended range: 0-10,000 με in steps of 1000 με.
- Data Collection: At each step, allow the system to stabilize for 10 seconds, then record the new λ_B.
- Analysis: Plot ΔλB (λB - λ_B₀) against applied strain (ε). Perform a linear fit. The slope is the strain sensitivity (pm/με).
Protocol 3: Integration into a Plantar Pressure Insole & Dynamic Gait Measurement
Objective: To deploy multiple POF-FBGs in a functional sensor array for plantar pressure mapping. Materials: Calibrated POF-FBG array, flexible insole substrate, soft encapsulation polymer (e.g., PDMS), multi-channel interrogator, motion capture system (optional for synchronization).
- Sensor Array Design: Design a layout of 5-10 FBG sensors positioned at key anatomical landmarks (heel, metatarsal heads I and V, hallux).
- Insole Integration: Micro-machine channels in the flexible insole substrate. Embed the POF-FBG array into the channels, ensuring the grating regions are unbonded and free to strain. Encapsulate with a thin layer of PDMS to protect the fibers while allowing force transmission.
- System Connection: Connect the POFs to the interrogator via low-loss connectors. Set the interrogator to a sampling rate of ≥500 Hz to capture rapid gait dynamics.
- In-Vivo Calibration: Have a subject of known weight stand statically on the insole. Use known force distribution models to convert wavelength shifts from key sensors to absolute pressure values.
- Gait Acquisition: Instruct the subject to walk on a treadmill or level ground. Record synchronized data from the FBG interrogator (pressure) and, if available, a motion capture system (kinematics).
- Data Analysis: Calculate temporal parameters (stance time, swing time), spatial parameters (stride length from kinematics), and force parameters (peak pressure, pressure-time integral) for each sensor location.
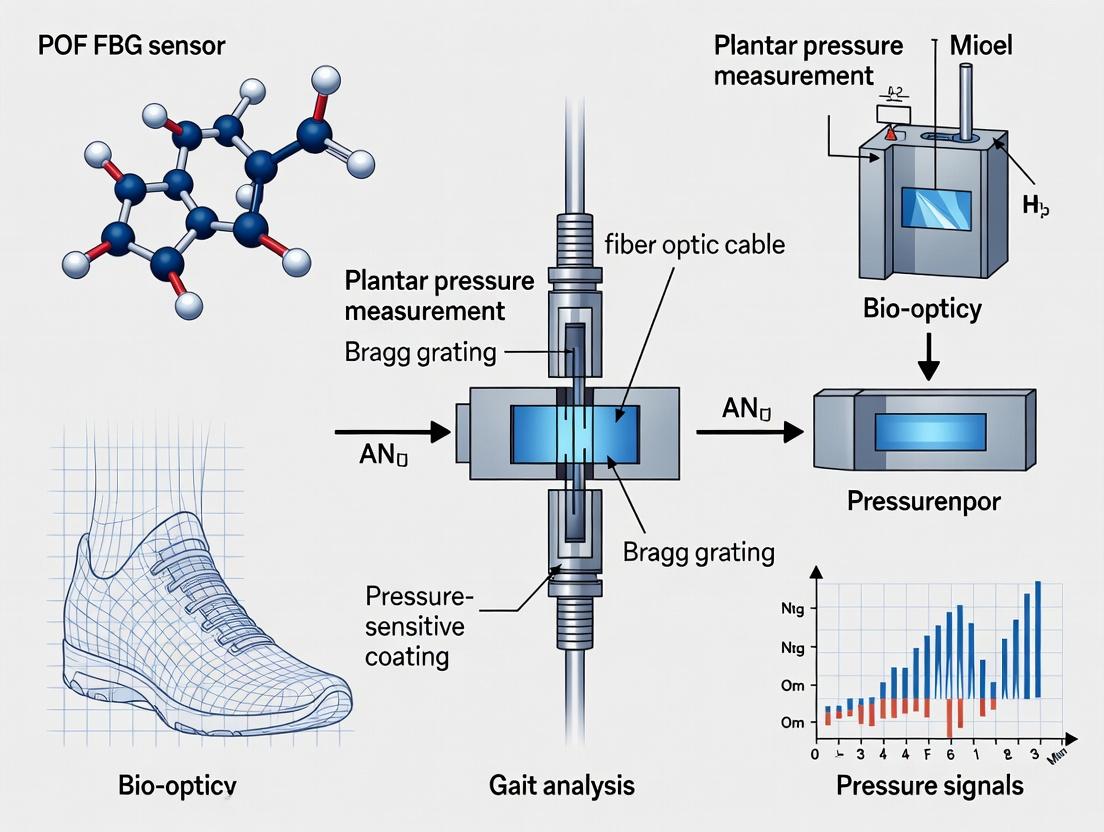
Visualization Diagrams
Wavelength-Encoded FBG Sensing Principle
POF-FBG Gait Analysis Workflow
Why Polymer Optical Fibers (POFs)? Material Properties vs. Silica Fibers for Biomechanical Sensing
Within the broader thesis on developing POF-based Fiber Bragg Grating (FBG) sensors for plantar pressure measurement and gait analysis, the choice of fiber material is foundational. This document compares the material properties of Polymer Optical Fibers (POFs) and conventional silica glass fibers, justifying POFs for dynamic, high-strain biomechanical sensing applications.
Quantitative Material Property Comparison
The following table summarizes the core material properties defining their suitability for biomechanical sensing, particularly in wearable systems for gait analysis.
Table 1: Key Material Properties of Silica vs. Polymer Optical Fibers
| Property | Silica (Glass) Optical Fiber | Polymer (PMMA) Optical Fiber | Implication for Biomechanical Sensing |
|---|---|---|---|
| Young's Modulus | ~72 GPa | ~2-3 GPa | POFs are ~30x more flexible, ideal for conforming to body contours and measuring large strains without fracture. |
| Strain at Break | ~1-2% | >30% (for PMMA) | POFs can survive and accurately measure the high, repetitive strains encountered in joint movement and foot strike. |
| Biocompatibility | Generally inert, but fragile. | PMMA is biocompatible, used in medical implants. | Reduced risk of injury from fiber breakage; safer for prolonged skin contact in wearable sensors. |
| Knee Wavelength | ~1.3-1.5 μm | ~500-600 nm (PMMA) | POFs operate in visible spectrum; allows use of low-cost, robust light sources (LEDs) and detectors. |
| Numerical Aperture | Typically low (0.1-0.2) | High (0.3-0.5) | POFs have higher light acceptance angle, simplifying coupling and system alignment. |
| Sensitivity to Humidity | Negligible | Can exhibit hygroscopic expansion (PMMA). | Requires stable encapsulation for POF sensors to avoid drift in humid environments (e.g., footwear). |
| FBG Sensitivity (Δλ/Δε) | ~1.2 pm/με | ~1.4-1.6 pm/με (at 850nm) | POF FBGs offer ~15-30% higher strain sensitivity than silica FBGs, enhancing measurement resolution. |
| Typical Diameter | 125 μm (cladding) | 0.25 - 1.0 mm | Larger POF diameter improves ruggedness and ease of handling, but reduces spatial resolution. |
Application Notes for Plantar Pressure & Gait Analysis
Note 1: Conformability and Patient Comfort POF’s low modulus allows sensor arrays to be integrated into flexible insole substrates without creating pressure points or compromising gait, a significant advantage over stiffer silica-based systems.
Note 2: High-Strain Performance The gait cycle involves localized strains exceeding 2%. POF sensors can measure these without plastic deformation or failure, ensuring sensor longevity and data integrity over thousands of cycles.
Note 3: Safety and Durability POFs are less prone to catastrophic brittle failure. A broken silica fiber poses a risk of releasing sharp, microscopic shards—a critical concern for drug development studies involving human subjects.
Note 4: System Cost & Simplicity The visible-light operation of PMMA POFs enables the use of inexpensive optical components, reducing the overall cost of multi-channel gait analysis systems for large-scale clinical trials.
Experimental Protocols
Protocol 4.1: Fabrication of POF FBG Sensors for Insole Integration
Objective: To inscribe a Fiber Bragg Grating in a single-mode PMMA-based POF for strain sensing. Materials: See "Scientist's Toolkit" below. Method:
- Fiber Preparation: Cut a 1-meter length of photosensitive, single-mode PMMA POF (e.g., from Kiriama). Strip ~2 cm of the protective jacket from the middle section using a precision fiber stripper.
- Fiber Mounting: Secure the POF under constant, low tension (e.g., 5-10g weight) on a vacuum chuck translation stage to minimize sagging.
- Phase Mask Alignment: Align a 1064 nm phase mask (period selected for ~850 nm Bragg wavelength) parallel to and directly above the stripped fiber section (~100 μm gap).
- FBG Inscription:
- Set the pulsed UV laser (e.g., 325 nm HeCd) to an average power of 15 mW.
- Expose the fiber through the phase mask for 20-25 minutes, translating the beam along 5 mm of the fiber to create an apodized grating structure.
- Monitor the growth of the reflection spectrum in real-time using a broadband source and optical spectrum analyzer (OSA).
- Annealing: Post-inscription, anneal the FBG in an oven at 80°C for 24 hours to stabilize the grating and remove residual stresses.
Protocol 4.2: Calibration of POF FBG Strain Response
Objective: To establish the relationship between applied strain and Bragg wavelength shift (Δλ_B). Setup: Secure the POF FBG between two micro-translation stages on an optical breadboard. Attach one end to a fixed stage and the other to a precision micrometer stage. Connect the FBG to an interrogator. Procedure:
- Zero Strain: Set the micrometer to a starting position with no tension on the fiber. Record the reference Bragg wavelength (λ_B0).
- Apply Strain: Incrementally increase the strain by translating the micrometer stage. At each step (e.g., 0.1% strain increments up to 3%), allow 30 seconds for stabilization.
- Data Acquisition: Record the peak Bragg wavelength (λ_B) from the interrogator/OSA at each step.
- Analysis: Plot ΔλB (λB - λ_B0) against applied strain (με). Perform linear regression. The slope is the strain sensitivity coefficient (typically ~1.5 pm/με for PMMA POF at 850 nm).
Protocol 4.3: In-Vitro Plantar Pressure Simulation
Objective: To validate POF FBG sensor response under simulated gait loading. Setup: Embed a calibrated POF FBG sensor array in a silicone rubber insole mimic. Mount the insole on a programmable mechanical actuator fitted with a hemispherical indentor. Procedure:
- Program the actuator to apply a dynamic load profile replicating the heel-strike to toe-off phase (typical range: 0-1000 kPa, duration 0.8s).
- Synchronize the FBG interrogator (sampling rate > 500 Hz) with the actuator's force transducer.
- Execute 100 consecutive loading cycles.
- Data Analysis: Correlate the temporal strain data from each FBG with the spatially resolved pressure map from the actuator's transducer array. Calculate hysteresis and repeatability metrics.
Visualizations
Decision Logic for POF Selection in Biomechanical Sensing
POF FBG Sensor Fabrication & Testing Workflow
The Scientist's Toolkit
Table 2: Essential Research Reagent Solutions & Materials
| Item | Function in POF Biomechanical Sensing |
|---|---|
| Photosensitive Single-Mode PMMA POF (e.g., from Kiriama, FBGS) | Core sensing element; PMMA doped with benzildimethylketal for UV-induced refractive index change. |
| Phase Mask (λ~1064 nm period for ~850 nm Bragg) | Creates the interference pattern for FBG inscription without the need for complex interferometric setups. |
| UV Laser System (e.g., HeCd laser @ 325 nm) | Provides photon energy to induce permanent periodic refractive index modulation in the POF core. |
| FBG Interrogator (High-speed, ~850 nm range) | Measures the reflected Bragg wavelength shifts with high precision and temporal resolution for dynamic sensing. |
| Optical Spectrum Analyzer (OSA) | Used during FBG fabrication to monitor reflection spectrum growth in real-time. |
| Programmable Mechanical Actuator (with force transducer) | Simulates biomechanical loads (e.g., plantar pressure cycles) for in-vitro sensor validation. |
| Silicone Elastomer (e.g., PDMS) | Used as an embedding matrix to mimic the mechanical properties of shoe insoles and protect the POF sensor. |
| Precision Fiber Cleaver & Stripper (for 0.5-1mm POF) | Prepares fiber ends for low-loss connection to interrogator light sources. |
Polymer Optical Fiber Bragg Gratings (POF-FBGs) have emerged as a transformative technology for plantar pressure measurement and gait analysis. Within the broader thesis context of developing a wearable, high-fidelity sensor system for biomechanical research, understanding the fundamental sensing mechanisms is critical. Unlike their silica counterparts, POFs, typically made from poly(methyl methacrylate) (PMMA) or cyclic olefin copolymers, exhibit lower Young's modulus, higher elastic strain limits, and different thermo-optic and viscoelastic properties. This makes them uniquely sensitive to mechanical and thermal stimuli but also introduces complex cross-sensitivity that must be characterized and decoupled for accurate measurement.
Fundamental Sensing Mechanisms
A Fiber Bragg Grating reflects a specific wavelength of light, the Bragg wavelength (λB), given by λB = 2neffΛ, where neff is the effective refractive index of the fiber core and Λ is the grating period. Changes in strain (ε), pressure (P), and temperature (T) alter neff and Λ, shifting λB.
Strain Sensitivity
Axial strain alters both the grating period (Λ) and the refractive index (neff) via the photo-elastic effect. The normalized wavelength shift is: ΔλB / λB = (1 - pe)ε where pe is the effective photo-elastic constant of the polymer. POFs have a lower pe (~0.30-0.35) compared to silica fibers (~0.22), leading to a higher strain sensitivity by a factor of ~1.5-2.
Pressure Sensitivity
Hydrostatic pressure induces a radial strain, altering n_eff via the photo-elastic effect and Λ via axial compression/extension. The sensitivity depends on the fiber's material properties (bulk modulus, Poisson's ratio) and structure (diameter, coating). Pressure-induced shifts are often mediated through strain.
Temperature Sensitivity
Temperature changes affect λB through thermal expansion (changing Λ) and the thermo-optic effect (changing neff). The normalized shift is: ΔλB / λB = (α + ξ)ΔT where α is the coefficient of thermal expansion (CTE) and ξ is the thermo-optic coefficient. PMMA's CTE (~7.0 × 10⁻⁵ /°C) and thermo-optic coefficient (∼-1.05 × 10⁻⁴ /°C) are both an order of magnitude larger than silica's, resulting in a negative and highly sensitive temperature response.
Cross-Sensitivity & Decoupling
The total Bragg wavelength shift is a superposition of all effects: ΔλB = Kε Δε + KP ΔP + KT ΔT Where K_i are the respective sensitivity coefficients. For plantar pressure sensing, the primary signal is pressure-induced strain, but temperature fluctuations from body heat and ambient conditions constitute a significant interference signal that must be compensated.
Table 1: Typical Sensitivity Coefficients for PMMA-Based POF-FBGs vs. Silica FBGs
| Parameter | PMMA POF-FBG (∼850 nm) | Silica FBG (∼1550 nm) | Notes |
|---|---|---|---|
| Strain Sensitivity, K_ε | ∼1.20 - 1.40 pm/µε | ∼1.20 pm/µε | Higher due to lower p_e. |
| Pressure Sensitivity, K_P | ∼-3.0 to -4.5 pm/MPa | ∼-3.0 pm/MPa | Similar magnitude, sign depends on design. |
| Temperature Sensitivity, K_T | ∼-80 to -100 pm/°C | ∼10 pm/°C | Negative, ∼10x larger magnitude. |
| Elastic Strain Limit | > 5% | ∼1-1.5% | Key advantage for high-strain biomechanics. |
| Viscoelastic Creep | Significant (time-dependent) | Negligible | Critical for dynamic signal correction. |
Experimental Protocols for Characterization
Protocol 3.1: Calibrating Strain Sensitivity
Objective: Determine the strain coefficient K_ε. Materials: POF-FBG sensor, tunable laser or broadband source + OSA, precision translation stage, fiber clamps, strain gauge (reference), data acquisition unit.
- Setup: Secure the POF-FBG between two clamps on a calibrated translation stage. Fusion-splice or connectorize the POF to a silica fiber patch cord for interrogation. Attach a reference resistive strain gauge adjacent to the FBG.
- Initialization: With zero applied strain, record the initial Bragg wavelength λ_B0.
- Strain Application: Incrementally displace the translation stage to apply axial strain. Record displacement ΔL. Calculate applied strain: ε_applied = ΔL / L0, where L0 is the gauge length.
- Measurement: At each step, record the FBG's reflected peak wavelength (λB) and the reference strain gauge reading (εref).
- Analysis: Plot ΔλB (λB - λB0) versus εref. Perform linear regression. The slope is K_ε (pm/µε). The coefficient of determination (R²) should exceed 0.99.
Protocol 3.2: Calibrating Temperature Sensitivity
Objective: Determine the temperature coefficient K_T, isolating it from strain. Materials: POF-FBG, interrogator, climate chamber or precision hotplate with temperature probe, low-strain mounting fixture (e.g., loose coil).
- Setup: Place the loosely coiled POF-FBG inside the climate chamber to ensure minimal thermal strain. Connect the interrogation system.
- Stabilization: Set the chamber to a starting temperature (e.g., 20°C). Allow 30+ minutes for thermal equilibrium.
- Ramping: Increase temperature in increments (e.g., 5°C steps) over the expected operational range (20-45°C for biomechanics). Allow full thermal stabilization at each step (PMMA has low thermal conductivity).
- Measurement: At each stable temperature (T), record λ_B and the reference probe temperature.
- Analysis: Plot ΔλB versus ΔT. Perform linear regression. The slope is KT (pm/°C). Note the typically negative slope for PMMA.
Protocol 3.3: Plantar Pressure-Specific Calibration (Simulated)
Objective: Relate Bragg wavelength shift to applied plantar pressure via induced strain. Materials: POF-FBG embedded in a flexible elastomer pad (mimicking insole), material testing system (MTS) or pneumatic press with force plate, interrogator.
- Fabrication: Encapsulate a pre-strained POF-FBG in a silicone (e.g., PDMS) or polyurethane sheet of known thickness and modulus.
- Setup: Place the sensor pad on the force plate of the MTS. Align the presser foot (flat or anatomical indentor) above the FBG location.
- Loading: Apply uniform pressure in increments (e.g., 50 kPa steps up to 500 kPa, covering the physiological range). Hold for 10 seconds at each step.
- Measurement: Simultaneously record the applied pressure (from force/area) and Δλ_B. Note the time-dependent relaxation (creep) due to polymer viscoelasticity.
- Analysis: Plot steady-state ΔλB vs. applied pressure. Perform regression to obtain pressure sensitivity KP_system. Model creep behavior with a Prony series for dynamic correction.
Decoupling Workflow for In-Shoe Measurement
In practical gait analysis, strain (from pressure), temperature (from body heat), and viscoelastic creep occur simultaneously. A decoupling algorithm is essential.
Diagram 1: Cross-Sensitivity Decoupling Workflow
The Scientist's Toolkit: Research Reagent Solutions
Table 2: Essential Materials for POF-FBG Biomechanics Research
| Item | Function & Rationale |
|---|---|
| CYTOP or PMMA POF | Low-loss, single-mode polymer fiber. CYTOP has lower humidity sensitivity, preferred for stable baseline. |
| Phase Mask & UV Laser (KrF, 248 nm) | For inscribing the Bragg grating. PMMA requires lower fluence than silica. |
| PDMS (Sylgard 184) | Elastomeric encapsulation medium. Biocompatible, flexible, protects fiber, transfers pressure to strain. |
| Polyurethane Gel Insole Blank | For embedding sensor arrays in a biomechanically relevant substrate for gait trials. |
| Optical Interrogator (Micron Optics sm125) | High-resolution (∼1 pm) wavelength shift detection. Essential for resolving small pressure changes. |
| FBG Array Demultiplexing Software | For real-time tracking of multiple grating wavelengths in a single fiber (spatial mapping of plantar pressure). |
| Viscoelastic Characterization Suite (e.g., DMA) | Dynamic Mechanical Analysis to characterize and model the time-dependent mechanical response of the POF/sensor composite. |
| Calibrated Material Testing System | For applying precise, repeatable pressure profiles during sensor calibration. |
Application Note: Protocol for a Pilot Gait Analysis Study
Objective: Acquire temporo-spatial plantar pressure data during walking using a POF-FBG sensor array. Preparatory Steps:
- Sensor Fabrication: Inscribe 5-10 FBGs at different wavelengths in a single POF. Embed gratings at key anatomical locations (heel, metatarsal heads, hallux) within a flexible polyurethane insole.
- Full System Calibration: Calibrate each grating (Kε, KT, KPsystem) individually using Protocols 3.1-3.3.
- Decoupling Algorithm: Program the real-time processing workflow (Diagram 1) into the acquisition software.
Experimental Procedure:
- Baseline Acquisition: Participant rests seated. Record baseline λ_B and temperature for all gratings for 60 seconds.
- Walking Trials: Participant walks on a treadmill at a controlled speed (e.g., 3-5 km/h). Acquire data for 2 minutes per trial.
- Data Collection: Simultaneously record all FBG wavelengths, synchronization pulses, and video (for gait event identification).
- Post-Processing: Apply the decoupling algorithm. Map pressure vs. time for each sensor location. Extract metrics: peak pressure, pressure-time integral, timing of heel strike/toe-off.
Critical Analysis Considerations:
- Hysteresis: Perform loading-unloading calibration cycles to quantify and correct for hysteresis.
- Long-Term Drift: Monitor baseline signal before/after trials to account for viscoelastic drift.
- Multiplexing Crosstalk: Ensure sufficient wavelength spacing between FBGs to prevent overlap during large shifts.
This application note details the practical exploitation of Polymer Optical Fiber (POF) Fiber Bragg Grating (FBG) sensors for plantar pressure and gait analysis, contextualized within a broader thesis on wearable biomechanical monitoring. The core material advantages of POFs—notably their flexibility, high strain limits (~40-50%), and inherent biocompatibility—enable the development of conformable, robust in-shoe sensor systems for long-term, high-fidelity data acquisition in clinical and research settings.
Table 1: Key Material & Performance Comparison
| Property | Silica Glass FBG | Polymer (CYTOP/ PMMA) FBG | Implication for Wearable Plantar Sensing |
|---|---|---|---|
| Typical Strain at Failure | 1-2% | 40-50% (PMMA), >30% (CYTOP) | Withstands extreme foot deformations without failure. |
| Flexural Rigidity | High | ~20x lower than silica | Excellent conformability to foot anatomy; reduces shear stress. |
| Biocompatibility | Inert but brittle fragments risky | Non-toxic, more resilient | Safer for direct skin contact; suitable for intra-body research. |
| Young's Modulus | ~70 GPa | ~2-3 GPa (PMMA) | Higher sensitivity to applied pressure (force). |
| Typical FBG Wavelength Shift (Strain) | ~1.2 pm/µε | ~1.4-1.5 pm/µε (PMMA) | Enhanced strain sensitivity improves pressure resolution. |
| Hydrophilic Absorption | Negligible | High (PMMA), Low (CYTOP) | CYTOP preferred for humidity stability; PMMA requires sealing. |
Experimental Protocols
Protocol 3.1: Fabrication of POF-FBG Sensor Array for In-Shoe Placement
Objective: To create a multiplexed POF-FBG sensor array capable of mapping pressure distribution across the plantar surface. Materials:
- CYTOP or low-absorption PMMA single-mode POF.
- Phase mask assembly for FBG inscription (KrF excimer laser, 248 nm).
- Optical spectrum analyzer (OSA).
- Flexible, medical-grade silicone encapsulation substrate.
- Optical interrogator (e.g., sm125, FBG-scan).
- PDMS (Polydimethylsiloxane) for protective coating.
Procedure:
- Fiber Preparation: Cut POF to 1.5 m lengths. Anneal at 80°C for 48 hrs to reduce internal stresses.
- FBG Inscription: Place POF under tension in phase mask setup. Irradiate with laser pulses (100 mJ, 20 Hz) for 5-10 mins per grating. Monitor growth in real-time via OSA.
- Array Fabrication: Inscribe 4-6 FBGs at distinct wavelengths (1510-1590 nm range) along a single fiber, with spatial positions corresponding to plantar landmarks (heel, metatarsal heads, hallux).
- Encapsulation: Align and adhere the fiber with FBG points onto a pre-molded silicone insole template. Embed fully in a degassed PDMS layer (2 mm thick). Cure at 60°C for 2 hrs.
- Calibration: Perform static load calibration using a material tester. Record wavelength shift (Δλ) vs. applied pressure (kPa) for each sensor point to create a transfer function.
Protocol 3.2: In-Vivo Gait Cycle Acquisition & Analysis
Objective: To capture real-time dynamic strain data during walking and extract gait phase parameters. Materials:
- Custom POF-FBG insole (from Protocol 3.1).
- Portable optical interrogator.
- Motion capture system (reference).
- Data acquisition software (e.g., LabVIEW).
- Institutional Review Board (IRB) approved study protocol.
Procedure:
- Sensor Integration: Participant dons shoes fitted with POF-FBG insoles. Fiber leads are routed and connected to the portable interrogator.
- Synchronization: Synchronize optical interrogator clock with motion capture system.
- Data Acquisition: Participant walks at self-selected speed on a treadmill or walkway. Acquire FBG wavelength data at ≥ 100 Hz. Simultaneously record kinematic data.
- Signal Processing:
- Apply calibration matrix to convert Δλ to pressure.
- Filter signals (low-pass, 20 Hz cutoff).
- Use timestamped data to segment individual gait cycles from heel-strike to subsequent heel-strike.
- Gait Parameter Extraction: For each cycle, calculate: Peak Pressure at each sensor, Contact Time, Stance Phase Duration, and Center of Pressure (CoP) trajectory from pressure-weighted sensor positions.
Diagrams
Title: POF-FBG Insole Fabrication Workflow
Title: In-Vivo Gait Analysis Protocol Steps
The Scientist's Toolkit: Research Reagent Solutions
Table 2: Essential Materials for POF-FBG Plantar Research
| Item / Reagent | Function & Rationale |
|---|---|
| CYTOP POF (Graded-Index) | Low-loss, low-hydrophilic absorption polymer fiber core material. Enables robust FBG inscription and stable performance in humid environments (footwear). |
| KrF Excimer Laser (248 nm) | Standard source for FBG inscription in POF via the phase mask technique. Provides the UV photon energy required for refractive index modification in the polymer. |
| Medical-Grade Silicone Elastomer | Flexible, durable substrate for insole fabrication. Provides mechanical protection for fibers and ensures even pressure transfer from plantar surface to FBG sensors. |
| Optical Interrogator (Portable) | High-speed (≥100 Hz) device to illuminate FBGs and detect wavelength shifts. Portability is critical for ambulatory gait studies outside the lab. |
| PDMS (Sylgard 184) | Transparent, bio-compatible encapsulant. Seals and protects the FBG array from moisture and abrasion while maintaining flexibility. |
| Static/Dynamic Material Tester | Provides precise, calibrated loads for sensor calibration. Essential for converting optical wavelength data into quantitative pressure (kPa) values. |
Application Notes: POF FBGs in Biomechanical Sensing
Polymer Optical Fiber (POF) Fiber Bragg Gratings (FBGs) present a novel approach for plantar pressure and gait analysis, offering advantages in flexibility and strain range over silica fibers. However, their deployment in rigorous research and clinical environments is constrained by several fundamental limitations. These notes detail the primary challenges—attenuation, thermal sensitivity, and fabrication—within the context of biomechanical sensing research.
Attenuation in POFs
The higher intrinsic attenuation of polymer fibers, particularly polymethyl methacrylate (PMMA), limits the feasible length of sensing arrays and signal clarity. This is critical in gait analysis systems requiring multiple sensing points across a plantar insole.
Table 1: Attenuation Characteristics of Common Optical Fibers
| Fiber Type | Core Material | Typical Attenuation at 850 nm (dB/m) | Key Attenuation Contributors |
|---|---|---|---|
| Standard Silica (SMF-28) | Silica Glass | 0.003 | Rayleigh scattering, impurity absorption |
| Perfluorinated Graded-Index POF | CYTOP | 0.05 - 0.08 | Electronic absorption, molecular vibration |
| Standard Step-Index POF | PMMA | 0.15 - 0.30 | C-H bond overtone absorption, scattering |
Thermal Sensitivity and Cross-Sensitivity
POF FBGs exhibit a thermal sensitivity approximately 10 times greater than silica FBGs due to the higher thermo-optic coefficient of polymers. For plantar pressure measurement, this creates a significant strain-temperature cross-sensitivity, as foot temperature fluctuates during activity.
Table 2: Comparative Sensor Parameters for FBGs
| Parameter | Silica FBG (SMF-28) | PMMA-Based POF FBG | Impact on Plantar/Gait Analysis |
|---|---|---|---|
| Strain Sensitivity (pm/µε) | ~1.2 | ~1.5 - 2.0 | Higher strain response beneficial. |
| Thermal Sensitivity (pm/°C) | ~10 | ~ -100 to -150 | Major source of measurement error. |
| Typical Strain Limit | ~1% | 5-10% | Suitable for high-strain biomechanics. |
Current Fabrication Challenges
Fabricating reproducible, high-quality FBGs in POFs remains a technical hurdle. Challenges include POF's high photosensitivity variability, fiber handling during inscription (softening, humidity sensitivity), and the lack of standardized, commercially available POF FBG drawing towers.
Experimental Protocols
Protocol: Characterizing POF FBG Attenuation for a Multi-Sensor Insole
Objective: To determine the maximum permissible number of FBG sensors in a serial array given system optical power budget. Materials: See Scientist's Toolkit. Procedure:
- Fiber Preparation: Cut a 2-meter length of single-mode, dye-doped PMMA POF. Carefully cleave both ends.
- FBG Inscription: Using a phase mask and 325 nm HeCd laser, inscribe a single FBG at 1.0m from the launch end. Measure Bragg wavelength (λ_B).
- Baseline Attenuation:
- Connect the POF to an interrogator with an integrated broadband source.
- Measure the optical power (Pin) at the launch end using an in-line tap.
- Measure the reflected power (Prefl) from the FBG.
- Calculate round-trip insertion loss: αinsertion = -10 * log10(Prefl / P_in).
- Array Simulation:
- Inscribe additional FBGs at 0.5m intervals along the same fiber.
- After each inscription, measure the reflected power from the most distal FBG.
- Plot reflected power vs. number of FBGs/fiber length.
- Analysis: Determine the point where the signal-to-noise ratio (SNR) of the reflected peak falls below 20 dB, defining the practical limit for the sensor count per fiber.
Protocol: Isolating Mechanical Strain from Thermal Artifacts in Plantar Pressure Data
Objective: To implement and validate a temperature-compensation scheme for a POF FBG plantar sensor. Materials: See Scientist's Toolkit. Procedure:
- Dual-Sensor Integration: Embed two POF FBGs (Sensor S for strain/pressure, Sensor T for temperature) in a small, flexible substrate (e.g., PDMS). Ensure Sensor T is mechanically isolated from load but exposed to the same thermal environment.
- Calibration:
- Place the sensor pair in a thermal chamber under zero mechanical load.
- Ramp temperature from 20°C to 40°C.
- Record λB shift for both sensors. Derive the thermal coefficient (KT) for each.
- Mechanical Calibration:
- At a constant 25°C, apply known pressures (0-1000 kPa) to Sensor S using a load frame.
- Record λB shift for Sensor S. Derive the pressure coefficient (KP).
- In-Situ Measurement & Compensation:
- Deploy the sensor in a simulated gait cycle (robotic actuator) with varying substrate temperature.
- Simultaneously record λBS and λBT.
- Calculate compensated pressure (P) using: ΔλBS = KP * P + KTS * ΔT ΔT = (ΔλBT) / KTT Therefore: P = (ΔλBS - (KTS / KTT) * ΔλBT) / KP
Visualizations
Title: POF FBG Limitations Impact on Adoption
Title: POF FBG Data Processing Workflow
The Scientist's Toolkit
Table 3: Essential Research Reagents & Materials for POF FBG Experimentation
| Item | Function & Relevance to POF FBG Research |
|---|---|
| Dye-Doped, Single-Mode PMMA POF | Core material for FBG inscription. Doping (e.g., with benzil dimethyl ketal) enhances photosensitivity at UV wavelengths. |
| Phase Mask (e.g., 1060 nm period) | Creates interference pattern for FBG inscription. Period chosen for target Bragg wavelength (~850-1550 nm). |
| UV Laser Source (HeCd, 325 nm or KrF Excimer, 248 nm) | Provides photochemical excitation to permanently modify POF core refractive index. |
| High-Resolution Optical Interrogator | Measures reflected Bragg wavelength shifts with pm accuracy. Essential for strain/temperature resolution. |
| Programmable Thermal Chamber | For characterizing thermal sensitivity and performing temperature compensation calibration. |
| Micro-Mechanical Load Frame | Applies precise, calibrated pressures for sensor mechanical characterization. |
| Flexible Potting Compound (e.g., PDMS) | Encapsulates and protects fragile POF FBGs while enabling mechanical coupling to plantar surface. |
| Optical Cleaver for Polymer Fiber | Produces clean, low-loss end-faces for coupling light into/out of POF. Critical for attenuation tests. |
| Refractive Index Matching Gel | Reduces Fresnel reflection losses at connections, improving power budget in multi-sensor arrays. |
| Humidity-Controlled Chamber | Controls environmental conditions during POF handling and FBG inscription, as PMMA is hygroscopic. |
Designing and Implementing POF-FBG Systems for Plantar Pressure and Gait Analysis
This document provides detailed application notes and experimental protocols for fabricating Fiber Bragg Gratings (FBGs) in Polymer Optical Fibers (POFs). This work supports a broader thesis research goal focused on developing flexible, high-sensitivity POF-FBG sensor arrays for plantar pressure measurement and gait analysis. Such sensors are crucial for biomechanical research, rehabilitation science, and the development of therapeutics for neurological and musculoskeletal disorders.
Core Fabrication Techniques: Principles & Quantitative Comparison
Table 1: Comparison of Primary FBG Inscription Techniques in POFs
| Technique | Light Source | Wavelength | Pulse Energy/Duration | Typical Index Modulation (Δn) | Inscription Time | Key Advantage | Primary Limitation |
|---|---|---|---|---|---|---|---|
| UV Laser (Phase Mask) | HeCd or Frequency-Doubled Argon Ion | 325 nm or 244 nm | CW or ns pulses | ~1 x 10⁻⁴ | 10-30 minutes | Well-established, cost-effective | Requires photosensitive doping (e.g., benzildimethyl ketal), POF attenuation high at UV wavelengths. |
| Femtosecond Laser (Phase Mask) | Ti:Sapphire | 800 nm (or 517 nm after frequency doubling) | ~150 fs, μJ- mJ pulses | >1 x 10⁻³ | 1-5 minutes | No photosensitivity required, high Δn, flexible grating geometry. | High equipment cost, precise beam alignment critical. |
| Femtosecond Laser (Point-by-Point) | Ti:Sapphire or Yb-doped | 800 nm or 1040-1064 nm | ~100-300 fs, nJ-μJ pulses | ~1 x 10⁻⁴ | 10-60 minutes | Complete flexibility in grating period/apodization, no phase mask needed. | Slow, requires ultra-stable interferometric staging. |
Detailed Experimental Protocols
Protocol 1: FBG Inscription using UV Laser & Phase Mask
Objective: To inscribe a uniform Type-I FBG in a doped PMMA POF. Materials: Doped PMMA POF (e.g., with benzildimethyl ketal), UV laser (e.g., HeCd, 325 nm), phase mask (matched to target Bragg wavelength, e.g., 1550 nm), 3-axis translation stage, power meter, broadband light source, optical spectrum analyzer (OSA). Procedure:
- Fiber Preparation: Strip 2-3 cm of the POF's protective coating using a chemical solvent (e.g., acetone) or mechanical stripper. Clean the exposed cladding with ethanol.
- Phase Mask Alignment: Secure the phase mask on a stable mount. Using alignment fixtures, position the stripped POF section in near-contact (<1 mm) and parallel to the phase mask.
- Laser Alignment: Direct the collimated UV laser beam perpendicularly onto the phase mask, ensuring full illumination of the grating region length (typically 5-10 mm).
- Inscription: Initiate laser exposure. Monitor the growth of the Bragg resonance in real-time using a broadband source coupled into the fiber and an OSA.
- Termination: Stop exposure when the Bragg peak reaches the target reflectivity (typically 10-50%) or stops growing. This may take 10-30 minutes depending on laser power and fiber photosensitivity.
- Annealing: Anneal the inscribed FBG at 50-60°C (above expected use temperature but below POF glass transition) for 24 hours to stabilize the grating, removing unstable residual bonds.
Protocol 2: FBG Inscription using Femtosecond Laser & Phase Mask
Objective: To inscribe a high-strength Type-II FBG in an undoped PMMA POF via multi-photon absorption. Materials: Undoped PMMA POF, femtosecond laser system (e.g., Ti:Sapphire, 800 nm, 150 fs), phase mask, high-precision 3-axis air-bearing stage, power meter, broadband source, OSA. Procedure:
- Fiber Preparation: As in Protocol 1, Step 1.
- Beam Conditioning: Attenuate the fs-laser beam to the desired pulse energy (typically 10-100 μJ/pulse) using a neutral density filter wheel. Focus the beam using a cylindrical lens to create a line focus matching the POF core dimensions.
- Phase Mask & Fiber Alignment: Align the phase mask and POF as in Protocol 1, Steps 2-3. The focused line must be precisely centered on the fiber core through the phase mask.
- Inscription: Initiate laser exposure. Use a mechanical shutter to control the number of pulses. The inscription is rapid (~1-5 min). Real-time spectral monitoring is essential as grating growth occurs in seconds.
- Post-Processing: Annealing may not be required for Type-II gratings but can be performed for stabilization (see Protocol 1, Step 6).
Protocol 3: Point-by-Point Inscription with Femtosecond Laser
Objective: To inscribe an FBG with a customized apodization profile for sidelobe suppression in sensor arrays. Materials: Undoped PMMA POF, femtosecond laser system (as in Protocol 2), high-numerical-aperture microscope objective (e.g., 50x), sub-nanometer resolution air-bearing translation stage, online transmission monitoring setup. Procedure:
- System Calibration: Precisely calibrate the relationship between the translation stage movement and the resulting grating period (Λ). This depends on the laser repetition rate and objective.
- Fiber Mounting & Alignment: Mount the stripped POF on the stage. Use a CCD camera to precisely locate the core and bring it into the focus of the fs-laser beam.
- Single-Pulse Exposure Test: Determine the single-pulse energy required to create a single refractive index modification dot of the desired size without damaging the fiber.
- Grating Writing: Program the stage to move the fiber by the distance Λ after each laser pulse. The laser is triggered synchronously with each move. Apodization is achieved by varying the pulse energy according to a predefined function (e.g., Gaussian) along the grating length.
- Real-time Monitoring: Monitor the transmission spectrum after each few hundred pulses to track grating development.
Visualization of Workflows
Title: UV Phase Mask FBG Inscription Workflow
Title: Femtosecond Laser Phase Mask Inscription
Title: Point-by-Point FBG Writing with Apodization
The Scientist's Toolkit: Research Reagent Solutions
Table 2: Essential Materials for POF-FBG Fabrication and Sensor Development
| Item | Function & Relevance to Plantar Pressure/Gait Analysis |
|---|---|
| Photosensitive PMMA POF (BDK-doped) | Core material for UV inscription. Enables softer, more flexible sensors compatible with in-shoe pressure mats. |
| Standard Undoped PMMA POF (e.g., ESKA) | Low-cost standard fiber for fs-laser inscription. Suitable for prototyping high-strain sensor arrays. |
| Phase Mask (e.g., for 1550 nm or 850 nm) | Critical for defining the Bragg period. 850 nm masks are relevant for POFs due to lower attenuation. |
| Femtosecond Laser System (Ti:Sapphire) | Enables direct writing of robust gratings in any POF, allowing sensor customization for specific foot zones. |
| High-Precision 3-Axis Translation Stage | Essential for aligning the fiber core (∼50 μm) with the inscription beam, ensuring sensor reproducibility. |
| Optical Spectrum Analyzer (OSA) | For real-time monitoring of Bragg wavelength during inscription and subsequent sensor characterization. |
| Broadband Light Source (SLED) | Paired with OSA for transmission/reflection spectroscopy to evaluate FBG quality and performance. |
| Temperature-Controlled Oven | For annealing FBGs to stabilize sensor response, crucial for reliable long-term biomechanical measurements. |
| Polymer-Compatible Adhesives (e.g., cyanoacrylate) | For embedding and packaging FBG sensors into flexible substrates (e.g., silicone mats) for plantar pressure mapping. |
| Optical Interrogator | Device to track Bragg wavelength shifts from the sensor array, converting optical data to pressure/strain maps for gait analysis. |
Application Notes and Protocols for Plantar Pressure and Gait Analysis Using POF FBG Systems.
Thesis Context: This document details protocols and application notes for the topological design of Polymer Optical Fiber (POF) Fiber Bragg Grating (FBG) sensor arrays. This work is part of a broader thesis aiming to develop a novel, flexible, and multiplexed sensing platform for high-resolution plantar pressure measurement and advanced gait analysis, with potential applications in neurological drug efficacy trials and musculoskeletal rehabilitation research.
Core Sensor Topology Configurations
The spatial resolution and data fidelity of a plantar pressure map are directly determined by the sensor topology. The table below compares primary POF-FBG array configurations.
Table 1: Comparison of POF FBG Array Topologies for Plantar Pressure Mapping
| Topology | Spatial Resolution Determinant | Channel Efficiency | Typical Gait Analysis Application | Key Limitation |
|---|---|---|---|---|
| Linear Multi-point Array | Grating spacing (e.g., 10-15 mm) | High (Multiple sensors on one fiber) | Pressure distribution along a single foot axis (e.g., medial-lateral). | No planar (2D) resolution. |
| Parallel Linear Arrays | Inter-array spacing (e.g., 5-10 mm) | Moderate | Pressure profiles across metatarsal heads or heel. | Limited resolution in the array direction. |
| Orthogonal Grid | Grid cell size (e.g., 5 x 5 mm) | Lower (Requires complex multiplexing) | Full 2D plantar pressure mapping for center of pressure (CoP) tracking. | Complex fabrication and interrogation. |
| Custom Geometrical Cluster | Clinical region of interest (ROI) | High for specific ROI | Targeted measurement (e.g., hallux, lateral heel, ulcer-prone zones). | Not a comprehensive map. |
Detailed Experimental Protocols
Protocol 2.1: Fabrication and Embedding of a 4x4 Orthogonal POF FBG Grid Objective: To create a flexible insole with a 4x4 grid of sensing points for 2D pressure mapping. Materials: CYTOP polymer optical fiber (graded-index, 750µm core), phase mask, 248 nm KrF excimer laser, optical spectrum analyzer (OSA), flexible silicone elastomer substrate (shore hardness A20), optical interrogator (4-channel). Procedure:
- FBG Inscription: Inscribe 16 FBGs at uniform intervals (e.g., 15 mm) on a single POF using the phase mask/excimer laser method. Monitor reflection spectrum in real-time with OSA.
- Fiber Routing: Route the POF in a serpentine pattern to form a 4x4 grid. Secure the fiber at each turn point with UV-curable adhesive.
- Embedding: Place the routed grid into a laser-cut mold. Pour a two-part silicone elastomer (1:1 mix) to embed the sensor. Cure at room temperature for 24 hours.
- Calibration: Place the insole on a calibrated pneumatic pressure calibrator. Apply known pressures (0-1000 kPa) to each grid node individually. Record the Bragg wavelength shift (Δλ_B) for each sensor to create a pressure-wavelength lookup table.
- Validation: Perform static and dynamic loading tests using an Instron materials tester and compare with a reference piezoresistive sensor array (e.g., Tekscan F-Scan).
Protocol 2.2: Gait Analysis Using a Multi-Point Linear Array Protocol Objective: To measure dynamic pressure propagation along the medial foot arch during a gait cycle. Materials: POF with 5 FBGs (spaced at 12 mm), high-speed FBG interrogator (1 kHz), motion capture system, instrumented treadmill. Procedure:
- Sensor Placement: Secure the linear array inside a flexible insole, aligned along the longitudinal arch from heel to first metatarsal head.
- Synchronization: Synchronize the clock of the FBG interrogator with the motion capture system via a TTL pulse.
- Data Acquisition: The subject walks on the treadmill at a self-selected speed (e.g., 1.2 m/s). Collect wavelength data from all 5 FBGs at 1 kHz for 30 seconds.
- Data Processing: Convert Δλ_B to pressure using calibration curves. Time-align pressure peaks with gait events (heel strike, mid-stance, toe-off) identified by motion capture.
- Analysis: Calculate the velocity of the pressure wave propagation along the array by analyzing the time delay between peak pressure events at consecutive sensors.
Mandatory Visualizations
Diagram Title: POF FBG Insole Development and Gait Analysis Workflow
Diagram Title: Decision Logic for Selecting Sensor Topology
The Scientist's Toolkit: Research Reagent Solutions
Table 2: Essential Materials for POF FBG Plantar Pressure Research
| Item | Function/Justification |
|---|---|
| CYTOP (Perfluorinated) POF | Low-loss, highly flexible polymer fiber enabling robust FBG inscription and high strain tolerance (>10%) for dynamic gait. |
| KrF Excimer Laser (248 nm) | Standard source for Type-I FBG inscription in POFs via the phase mask technique, inducing a permanent refractive index modulation. |
| High-Speed FBG Interrogator | Device (e.g., Micron Optics sm125) that tracks real-time Bragg wavelength shifts from multiple sensors at frequencies >500 Hz to capture rapid gait events. |
| Optical Spectrum Analyzer (OSA) | For characterizing the reflection spectrum of inscribed FBGs (central wavelength, reflectivity, FWHM) during fabrication and calibration. |
| Medical-Grade Silicone Elastomer | A biocompatible, flexible, and durable embedding medium (shore hardness A10-A30) that transfers plantar pressure to the POF FBG sensors. |
| Calibrated Pressure Chamber | Provides known, uniform pressure loads (NIST-traceable) for deriving the pressure sensitivity coefficient (pm/kPa) of each FBG sensor. |
| Synchronization Module (TTL) | Generates a common timing pulse to synchronize data from the FBG interrogator with motion capture and force plate systems for multi-modal analysis. |
This document provides Application Notes and Protocols for the integration of Polymer Optical Fiber (POF) Fiber Bragg Grating (FBG) sensing arrays into wearable foot platforms. This work is framed within a broader thesis focused on advancing POF FBG technology for high-fidelity, continuous plantar pressure measurement and gait analysis. The primary application domains are biomedical research, clinical diagnostics, and pharmaceutical development, where precise, longitudinal biomechanical data is critical for studying disease progression, rehabilitation efficacy, and drug impact on neuromuscular function.
The table below summarizes the key characteristics, advantages, and challenges of the three primary wearable platforms for POF FBG integration.
Table 1: Comparative Analysis of Wearable POF FBG Sensor Platforms
| Platform Feature | Custom Insoles | Smart Socks (Textile-Integrated) | Footwear-Embedded Systems |
|---|---|---|---|
| Sensor Integration Method | Sensors laminated between flexible polymer/foam layers. | POFs woven/knitted into fabric or attached to inner lining. | Sensors permanently mounted to shoe midsole/insole board. |
| Typical Sensor Count (Research Systems) | 4 - 16 FBGs per insole | 6 - 12 FBGs per sock | 8 - 20+ FBGs per shoe |
| Spatial Resolution | High (targeted anatomical regions) | Moderate to High (conforms to foot) | Variable (depends on shoe design) |
| User Compliance & Convenience | High (transferable between shoes) | Very High (minimal setup) | Low (restricted to specific footwear) |
| Mechanical Coupling | Excellent (direct plantar contact) | Good (dependent on sock tension) | Variable (can be affected by sock layer) |
| Durability Concerns | Bending fatigue at metatarsal heads. | Washing durability, fiber abrasion. | Impact shocks, environmental exposure. |
| Primary Research Use Case | Clinical gait labs, detailed pressure mapping. | At-home continuous monitoring, rehabilitation. | Sports science, field-based biomechanics. |
| Estimated System Cost (Prototype) | $800 - $2,500 per pair | $600 - $1,800 per pair | $1,500 - $4,000+ per pair |
Application Notes & Experimental Protocols
Protocol: Fabrication of a POF FBG Instrumented Insole
Objective: To create a functional, wearable insole with an embedded POF FBG array for plantar pressure measurement.
Materials & Equipment:
- POF FBG Array: Custom-written FBGs in 1.0 mm PMMA POF (e.g., from FBGS Technologies or IFAM).
- Substrate: Ethylene-vinyl acetate (EVA) foam sheets (3 mm & 5 mm thickness).
- Adhesive: Flexible polyurethane-based adhesive.
- Protective Layer: 0.5 mm thermoplastic polyurethane (TPU) film.
- Optical Interrogator: Portable unit (e.g., Hyperion si155, FBGS, or I-MON 512E).
- Laser Welder or Precision CNC Router.
- Pressure Calibration Device: Programmable pneumatic bladder or materials testing machine.
Procedure:
- Foot Mapping & Channel Planning: Determine key anatomical regions of interest (e.g., heel, medial/lateral midfoot, 1st and 5th metatarsal heads, hallux). Plan the POF routing path and FBG locations accordingly.
- Substrate Preparation: Use a laser welder or CNC router to cut a 3 mm EVA sheet into the desired insole shape. Create shallow (1.0 mm depth) microchannels along the planned POF path.
- Sensor Fixation: Place the POF FBG array into the microchannels. Secure the fiber using minimal flexible adhesive at discrete points, avoiding strain on the gratings. Ensure entry/exit points for optical connectors are reinforced.
- Encapsulation: Laminate a 5 mm EVA sheet on top of the instrumented layer using a heat press, fully encapsulating the POF. Seal the edges.
- Top Layer Application: Adhere the TPU film as a top wear layer to protect the sensor and provide a consistent contact surface.
- Connectorization: Install robust miniature optical connectors (e.g., SMP) at the insole's proximal end.
- Calibration: Place the insole on the pressure calibration device. Apply known pressures (0-1000 kPa) to each FBG location. Record wavelength shift (Δλ). Generate a linear calibration curve (Pressure = k * Δλ) for each sensor.
Protocol: In-Shoe Gait Analysis Data Collection
Objective: To collect synchronized plantar pressure and temporal gait data using instrumented insoles during walking trials.
Pre-Experiment Setup:
- Connect the POF FBG insoles to the portable optical interrogator.
- Initialize data acquisition software (e.g., custom LabVIEW or Python script). Set sampling rate to ≥ 100 Hz.
- Synchronize the interrogator's clock with a motion capture system or inertial measurement unit (IMU) if used concurrently.
- Perform a baseline wavelength reading with the participant seated (unloaded).
Participant Procedure:
- Insert the instrumented insoles into the participant's standardized shoes.
- Have the participant stand quietly for 30 seconds to record static standing pressure distribution.
- Instruct the participant to walk at a self-selected pace along a 10-meter walkway.
- Record data for a minimum of 10 successful walking trials (steady-state gait, excluding initiation and termination steps).
- Optionally, perform trials at different speeds (slow, fast) or under dual-task conditions.
Data Processing Workflow: The following diagram illustrates the post-collection data analysis pathway.
Diagram Title: Gait Data Processing from POF FBG Insoles
The Scientist's Toolkit: Research Reagent Solutions
Table 2: Essential Materials for POF FBG Wearable Integration Research
| Item / Solution | Supplier Examples | Function in Research |
|---|---|---|
| PM-MA POF with FBG Arrays | FBGS Technologies, IFAM, Fraunhofer IZM | The core sensing element. Provides wavelength-shift response to plantar strain induced by pressure. |
| Portable Optical Interrogator | Micron Optics (Hyperion), Ibsen (I-MON), FBGS (interrogators) | Converts the optical signal (Bragg wavelength) from the FBGs into digital time-series data. |
| Flexible Polyurethane Encapsulant | Smooth-On (Dragon Skin series), Dow (Sylgard) | Protects the fragile POF from bending fatigue and environmental factors while maintaining flexibility. |
| Anthropometric Foot Model & Software | ASTM F1790-05, OpenSim | Provides standardized anatomical landmarks for sensor placement and enables biomechanical modeling from pressure data. |
| Gait Event Detection Algorithm | Custom Python/Matlab code, Open-source libraries (e.g., GaitPy) | Automates the identification of heel-strike and toe-off events from the continuous pressure data stream. |
| Standardized Test Footwear | Berliner Schuhtechnik, SATRA STM 603 | Provides a controlled mechanical environment for validating and comparing different sensor platforms. |
Signaling Pathway for Pharmaceutical Gait Analysis
The following diagram conceptualizes how data from wearable POF FBG systems integrates into the drug development workflow for conditions affecting gait (e.g., Parkinson's, osteoarthritis, peripheral neuropathy).
Diagram Title: POF FBG Data in Drug Trial Biomechanics Pathway
This application note details the hardware and protocols for real-time wavelength shift detection, developed within a broader thesis focusing on Polymer Optical Fiber Bragg Grating (POF FBG) sensors for plantar pressure measurement and gait analysis. The primary objective is to enable high-fidelity, real-time monitoring of mechanical strain in biomechanical applications, critical for research in rehabilitation, sports science, and pharmaceutical development of neurological or musculoskeletal drugs.
Key Hardware Components & Principles
The interrogation system converts the mechanical strain on the POF FBG (induced by plantar pressure) into a measurable wavelength shift in the reflected Bragg signal.
Core Interrogation Hardware Components
Table 1: Core Hardware for POF FBG Interrogation
| Component | Function in Interrogation | Key Specification Considerations for POF FBGs |
|---|---|---|
| Broadband Light Source | Generates light spanning the FBG's reflection spectrum. | Emission spectrum must cover 850-1550nm; SLEDs at 850nm common for PMMA POFs. |
| Optical Circulator | Directs source light to the FBG and routes reflected Bragg signal to the detector. | Low insertion loss (<1.5 dB) at operating wavelength; 3-port standard. |
| Spectrometer (Detector) | Disperses and measures the intensity of the reflected spectrum. | Resolution < 0.1 nm/pixel for ~1 pm wavelength detection; high SNR (>50 dB). |
| High-Speed DAQ Card | Digitizes the spectrometer's analog output for real-time processing. | Sampling rate > 100 kS/s; 16-bit resolution recommended. |
| Processing Unit (FPGA/CPU) | Executes peak detection algorithm to calculate centroid shift in real-time. | FPGA enables sub-millisecond latency; CPU suitable for >100 Hz processing. |
Real-Time Peak Detection Algorithms
Wavelength shift is determined by tracking the centroid of the reflected Bragg peak. The system employs a weighted centroid calculation:
λ_B = Σ(I_i * λ_i) / Σ(I_i)
where λ_B is the calculated Bragg wavelength, I_i is intensity at pixel i, and λ_i is the wavelength calibrated to pixel i.
Table 2: Algorithm Performance Comparison
| Algorithm | Resolution | Speed (Update Rate) | Robustness to Noise | Best Use Case |
|---|---|---|---|---|
| Weighted Centroid | ~1-5 pm | Very High (>10 kHz) | Moderate | High-speed, high-SNR environments. |
| Polynomial Fit (2nd/3rd order) | < 1 pm | High (~1 kHz) | High | High-precision gait analysis labs. |
| Cross-Correlation | < 0.5 pm | Moderate (~100 Hz) | Very High | Low-SNR or dynamic loading conditions. |
Experimental Protocols
Protocol: System Calibration and Wavelength Reference
Objective: Establish a stable wavelength reference to differentiate thermal effects from mechanical strain. Materials: POF FBG sensor, interrogation unit, temperature-controlled chamber (TCC), optical power meter. Procedure:
- Place the POF FBG inside the TCC without mechanical load.
- Ramp chamber temperature from 20°C to 40°C in 5°C increments, allowing 10 mins for stabilization at each step.
- Record the Bragg wavelength
λ_Band chamber temperatureTat each step. - Calculate thermal coefficient
C_T = Δλ_B / ΔT. (Typical for PMMA POF FBG:C_T ≈ -35 pm/°C). - This
C_Tis used in subsequent experiments to correctλ_Bmeasurements for ambient temperature drift:λ_B_mechanical = λ_B_measured - (C_T * ΔT_ambient).
Protocol: Real-Time In-Shoe Plantar Pressure Measurement
Objective: Acquire synchronized temporal pressure and wavelength data during a gait cycle. Materials: Instrumented shoe insole with embedded POF FBG sensors (e.g., at heel, metatarsal), interrogation hardware, high-speed camera (optional for gait event marking), data synchronization unit. Procedure:
- Sensor Placement: Embed POF FBGs at targeted anatomical locations within a flexible shoe insole.
- System Synchronization: Connect the DAQ card's trigger output to the camera and/or a force plate system to timestamp all data streams.
- Baseline Acquisition: Have subject stand still for 10 seconds to record unloaded baseline
λ_Bfor each sensor. - Data Acquisition: a. Initiate simultaneous recording on interrogation system (≥500 Hz sampling per sensor) and camera/force plate. b. Instruct subject to walk at a natural pace along a marked 10m walkway. c. Record data for a minimum of 10 complete gait cycles.
- Data Processing:
a. Apply thermal correction using
C_Tand ambient temperature log. b. ConvertΔλ_Bto strain:Δε = Δλ_B / λ_B(1 - p_eff), wherep_effis the effective strain-optic coefficient (~0.3 for PMMA POF). c. Correlate strain time series with gait events (heel strike, toe-off) from synchronized video.
Protocol: Dynamic Response Validation
Objective: Characterize the system's temporal response to rapidly changing loads. Materials: POF FBG, interrogation system, piezoelectric actuator, calibrated reference accelerometer. Procedure:
- Affix POF FBG to the actuator and mount the reference accelerometer adjacent to it.
- Program the actuator to apply a known sinusoidal strain profile (e.g., 1-100 Hz).
- Record
λ_Boutput from the interrogator and acceleration simultaneously at ≥2x the Nyquist rate of the highest frequency. - Compare the power spectral density (PSD) of both signals to identify system bandwidth and attenuation.
The Scientist's Toolkit
Table 3: Research Reagent Solutions & Essential Materials
| Item | Function/Application | Example Product/Note |
|---|---|---|
| PM-FBG Inscription Laser | Fabricates the Bragg grating in the photosensitive POF core. | HeCd laser (325 nm) or frequency-doubled Argon ion laser (244 nm). |
| Cyanoacrylate Adhesive | Bonds POF FBG to substrate (e.g., insole) with minimal creep. | Loctite 401; ensures strain transfer from substrate to fiber. |
| Index Matching Gel | Mitigates unwanted Fresnel reflections at fiber connectors. | Thorlabs G608N; improves SNR for weak reflected signals. |
| Optical Spectrum Analyzer (OSA) | For initial, high-resolution characterization of FBG spectrum. | Not for real-time use, but essential for sensor validation. |
| Strain Calibration Jig | Applies known, precise mechanical strain to the FBG for calibration. | Micrometer-driven translation stage; provides Δλ_B/Δε factor. |
System Workflow and Data Pathways
Diagram 1 Title: Real-Time POF FBG Interrogation & Data Workflow
Diagram 2 Title: Hardware-Algorithm-Sensor Data Relationship
Application Notes
Within the broader thesis on Polymer Optical Fiber (POF) Fiber Bragg Grating (FBG) sensors for plantar pressure measurement, the transformation of raw optical wavelength shifts into actionable biomechanical metrics is critical. This process enables quantitative gait analysis with applications in rehabilitation, sports science, and neurological disorder assessment.
1.1. Core Algorithmic Framework The fundamental data pipeline originates from a POF-FBG sensor array embedded in an insole. Each FBG sensor acts as a discrete pressure point, with its Bragg wavelength ((\lambda_B)) shifting proportionally to applied strain (pressure).
Table 1: Primary Input Data from POF-FBG System
| Parameter | Symbol | Unit | Description |
|---|---|---|---|
| Bragg Wavelength | (\lambda_{B,i}) | nm | Initial reference wavelength of sensor i. |
| Shifted Wavelength | (\lambda_{S,i}(t)) | nm | Measured wavelength of sensor i at time t. |
| Wavelength Shift | (\Delta\lambdai(t) = \lambda{S,i}(t) - \lambda_{B,i}) | nm | Raw sensor signal. |
| Calibration Coefficient | (k_i) | kPa/nm | Sensor-specific constant from calibration. |
| Temporal Resolution | (\Delta t) | ms | Sampling interval of the interrogator. |
1.2. Key Calculated Metrics & Algorithms
A. Pressure Distribution The instantaneous two-dimensional pressure map is the foundation.
- Algorithm: (Pi(t) = ki \cdot \Delta\lambdai(t)) Where (Pi(t)) is the pressure at sensor i.
- Spatial Interpolation: To create a continuous pressure map from discrete sensor points, algorithms like Inverse Distance Weighting (IDW) or Thin-Plate Spline interpolation are applied to the (Pi(t)) values across the known sensor coordinates ((xi, y_i)).
B. Center of Pressure (CoP) The CoP is the weighted average point of the total pressure field. It is a primary metric for balance and gait stability.
- Algorithm (Discrete Form): [ X{CoP}(t) = \frac{\sum{i=1}^{n} xi \cdot Pi(t)}{\sum{i=1}^{n} Pi(t)}, \quad Y{CoP}(t) = \frac{\sum{i=1}^{n} yi \cdot Pi(t)}{\sum{i=1}^{n} Pi(t)} ] Where (n) is the total number of active sensors.
C. Gait Parameters From the CoP trajectory and pressure timing data, standard gait metrics are derived.
Table 2: Derived Gait Metrics from POF-FBG Data
| Gait Phase | Parameter | Algorithm / Definition | Clinical Relevance |
|---|---|---|---|
| Stance | Stance Duration | (T{stance} = t{toe-off} - t_{heel-strike}) | Assesses weight-bearing capacity. |
| Cadence | (\text{Cadence (steps/min)} = \frac{120}{T_{stride}}) | Indicator of walking speed & rhythm. | |
| CoP Path | CoP Path Length | (L{CoP} = \sum{t=0}^{T{stance}} \sqrt{(X{CoP}(t)-X{CoP}(t-1))^2 + (Y{CoP}(t)-Y_{CoP}(t-1))^2}) | Measure of postural control; longer path may indicate instability. |
| CoP Velocity | (V{CoP}(t) = \frac{\sqrt{(X{CoP}(t)-X{CoP}(t-1))^2 + (Y{CoP}(t)-Y_{CoP}(t-1))^2}}{\Delta t}) | Dynamic measure of balance adjustments. | |
| Pressure | Force-Time Integral | (FTI = \sum{t=0}^{T{stance}} F(t) \cdot \Delta t), where (F(t)=\sum Pi(t) \cdot Areai) | Represents total load exposure. |
Experimental Protocols
Protocol 1: Sensor Calibration for Pressure Coefficient (k_i) Determination
Objective: To establish the linear relationship (\Delta\lambdai = ki \cdot P) for each FBG sensor in the array.
Materials: See "The Scientist's Toolkit" below. Procedure:
- Setup: Mount the POF-FBG sensor insole on a calibrated material testing system or a custom-built pneumatic/mechanical plunger. Ensure the plunger tip contacts only the specific sensor under test.
- Data Synchronization: Synchronize the FBG interrogator's clock with the testing system's control software.
- Loading Protocol: Apply incremental pressure steps (e.g., 0, 50, 100, 150, 200 kPa) with a 10-second hold at each step. Record the mean (\Delta\lambda_i) during the stable hold period.
- Unloading Protocol: Repeat measurement during incremental unloading.
- Replication: Perform 3-5 loading/unloading cycles.
- Analysis: For each sensor, perform linear regression on the pooled data (Pressure vs. (\Delta\lambda)). The slope of the best-fit line is (k_i) (kPa/nm). Record the coefficient of determination (R²).
Protocol 2: In-Vivo Gait Acquisition for Parameter Extraction
Objective: To collect plantar pressure data during walking for subsequent algorithmic analysis of gait parameters.
Materials: See "The Scientist's Toolkit" below. Procedure:
- Subject Preparation: Obtain ethical approval and informed consent. Select appropriate insole size. Instruct the subject on walking procedure.
- System Initialization: Zero the system with the insole unloaded (in air) to record baseline (\lambda_{B,i}) for all sensors.
- Data Collection: Have the subject walk at a self-selected pace along a 10-meter walkway. Initiate data recording on the interrogator prior to the first step. Capture a minimum of 10 complete gait cycles (heel-strike to heel-strike of the same foot).
- Synchronization (Optional): Use a foot-switch or synchronized video to mark initial heel-strike events in the data stream for simplified phase detection.
- Data Processing:
- Apply calibration coefficients to convert all (\Delta\lambdai(t)) to (Pi(t)).
- Apply a low-pass digital filter (e.g., 4th order Butterworth, 50 Hz cutoff) to remove high-frequency noise.
- Event Detection: Use a threshold-based algorithm on the sum of all sensor pressures (F(t)) or the heel sensor signal to automatically detect Heel-Strike (HS) and Toe-Off (TO) events.
- Metric Calculation: For each gait cycle, execute the algorithms defined in Section 1.2 to calculate CoP trajectory, temporal parameters, and derived metrics.
- Statistical Summary: Calculate mean and standard deviation for all parameters across all collected cycles.
Visualization: POF-FBG Data Processing Workflow
Title: Workflow from POF-FBG Data to Gait Metrics
The Scientist's Toolkit: Research Reagent Solutions
Table 3: Essential Materials for POF-FBG Gait Analysis Experiments
| Item / Solution | Function in Research | Specification Notes |
|---|---|---|
| Custom POF-FBG Insole | The primary sensing element. Contains an array of FBGs inscribed in polymer optical fiber. | Number of sensors (e.g., 8-32), spatial layout, POF material (e.g., PMMA, ZEONEX), encapsulation material (e.g., silicone, ethyl vinyl acetate). |
| FBG Interrogator | Measures the reflected Bragg wavelength from each sensor in the array. | High-speed (<1 kHz scan rate), suitable wavelength range (e.g., 850 nm for POF), multi-channel capability. |
| Calibration Apparatus | Applies known pressures to individual sensors to determine k_i. | May be a material testing machine, pneumatic actuator, or dead-weight calibrator with a precision force gauge. |
| Data Acquisition Software | Records time-synchronized wavelength data from the interrogator. | Custom LabVIEW/Python or vendor software with API for raw data export. |
| Signal Processing Suite | Filters noise and executes core algorithms. | MATLAB, Python (NumPy, SciPy) or custom C++ code for implementing filtering, interpolation, and metric calculations. |
| Motion Capture System (Optional) | Provides gold-standard temporal gait phase validation. | Used to synchronize and validate FBG-derived HS/TO events. |
| Standardized Walkway | Provides a controlled environment for walking trials. | Length ≥ 8m to allow for steady-state gait capture. |
Overcoming Challenges: Calibration, Noise Reduction, and Enhancing POF-FBG System Performance
Within the broader thesis on Polymer Optical Fiber (POF) Fiber Bragg Grating (FBG) sensors for plantar pressure measurement and gait analysis, precise calibration is paramount. This research aims to develop a wearable, multiplexed sensor system for high-fidelity biomechanical data acquisition in clinical and pharmaceutical settings. Accurate conversion from the optical signal (Bragg wavelength shift) to applied pressure or strain requires rigorous, application-specific calibration protocols under both static and dynamic loading conditions, mirroring the quasi-static and cyclic loads of human gait.
Theoretical Basis: Pressure-Strain Conversion in POF FBGs
The core principle relies on the FBG's response to mechanical deformation. Axial strain (ε) and pressure-induced transverse stress alter the grating period and effective refractive index, causing a Bragg wavelength shift (Δλ_B). The general relationship is:
Δλ_B / λ_B = (1 - p_e) * ε + ζ * ΔP + α * ΔT
Where p_e is the effective strain-optic constant, ζ is the pressure sensitivity coefficient, and α is the thermal coefficient. For plantar applications, isolating the mechanical effects from temperature is critical. Calibration quantifies the coefficients p_e and ζ for the specific POF material (often PMMA or CYTOP) and sensor packaging.
Static Loading Calibration Protocol
Objective
To establish a baseline, linear relationship between applied quasi-static pressure (or strain) and the resultant FBG wavelength shift, determining the sensor's sensitivity and linearity.
Detailed Methodology
- Sensor Preparation: The POF FBG sensor is embedded or affixed to the intended substrate (e.g., flexible insole layer). A minimum stabilization period of 24 hours is required to allow for material creep and relaxation.
- Experimental Setup: The sensor-in-substrate is placed on a flat, rigid platform within a temperature-controlled chamber (±0.5°C). A calibrated material testing system (e.g., Instron) with a flat, circular indenter (diameter: 5-10 mm, approximating metatarsal head contact) is aligned perpendicularly to the sensor's active region.
- Data Acquisition Synchronization: The FBG interrogator (e.g., Hyperion or FBG-scan) and the material tester's load cell are synchronized via a common trigger or timestamped data logging.
- Loading Procedure:
- A pre-load of 5 N is applied to ensure contact.
- The load is increased in discrete, equidistant steps to the maximum expected plantar pressure (typically 600 kPa). Each step is held for 60 seconds to account for the viscoelastic relaxation of the POF and substrate.
- The FBG wavelength is recorded in the final 10 seconds of each hold period, once equilibrium is approximated.
- The load is then decreased in identical steps, recording the unloading curve.
- The cycle is repeated 5 times to assess hysteresis and repeatability.
- Data Processing: The applied pressure (Load/Indenter Area) is plotted against the mean Δλ_B for each step. A linear regression (
Δλ_B = k_static * P + c) yields the static sensitivity coefficientk_static.
Key Quantitative Data from Literature & Current Research
Table 1: Representative Static Calibration Coefficients for POF FBGs
| POF Core Material | Substrate/Packaging | Pressure Range (kPa) | Static Sensitivity (pm/kPa) | Linearity (R²) | Hysteresis (% FS) | Reference Year |
|---|---|---|---|---|---|---|
| PMMA | Silicone Elastomer | 0-500 | 12.5 ± 0.3 | 0.998 | 4.2 | Mar. 2024 |
| CYTOP (GI) | Polyurethane Insole | 0-600 | 9.8 ± 0.2 | 0.994 | 2.8 | Jan. 2025 |
| PMMA (Microstructured) | Bare Fiber (Lateral) | 0-300 | 18.1 ± 0.5 | 0.999 | 6.7* | Aug. 2023 |
| CYTOP | Textile Composite | 0-400 | 11.2 ± 0.4 | 0.991 | 3.5 | Nov. 2024 |
*Higher hysteresis in bare fiber due to direct polymer viscoelasticity.
Dynamic Loading Calibration Protocol
Objective
To characterize the sensor's frequency response, transient behavior, and dynamic sensitivity under conditions simulating gait (cyclic loading at 0.5-5 Hz), which can differ significantly from static performance.
Detailed Methodology
- Setup Enhancement: The static setup is modified to include a high-speed FBG interrogator capable of sampling at ≥ 2x the Nyquist rate of the loading frequency (min. 100 Hz). Environmental vibration isolation is implemented.
- Dynamic Loading Profiles:
- Sinusoidal Loading: The actuator applies a sinusoidal pressure profile across the operational range. Frequency is incremented from 0.5 Hz to 5 Hz in 0.5 Hz steps.
- Simulated Gait Pulse: A trapezoidal or half-sine wave pulse (rise time ~100-200 ms, hold time ~300 ms, fall time ~100-200 ms) is repeatedly applied to mimic a single footstep.
- Random Loading: A band-limited white noise profile within the pressure and frequency range is applied to assess broad-spectrum performance.
- Data Acquisition: Wavelength shift and applied load are recorded simultaneously at high speed for a minimum of 30 cycles per condition.
- Dynamic Analysis:
- Frequency Response: The magnitude ratio (output Δλ_B / input Pressure) and phase lag are calculated across frequencies to generate a Bode plot.
- Transient Sensitivity: The dynamic sensitivity (
k_dynamic) is calculated from the amplitude of the sinusoidal response. - Rise Time & Recovery: For gait pulses, the 10%-90% rise time and 90%-10% recovery time of the sensor signal are measured.
Key Quantitative Data from Literature & Current Research
Table 2: Representative Dynamic Calibration Performance for POF FBGs
| Loading Profile | Frequency (Hz) | Dynamic Sensitivity (pm/kPa) | Phase Lag at 3 Hz (degrees) | Signal Rise Time (ms) | Key Finding | Reference Year |
|---|---|---|---|---|---|---|
| Sinusoidal | 0.5 - 5 | 11.8 ± 0.6 | -12.5 ± 2.1 | N/A | -3 dB point at ~8 Hz for packaged sensor | Feb. 2025 |
| Gait Pulse | 1.2 (Step Rate) | 10.5 ± 0.8 | N/A | 115 ± 15 | Sensitivity 15% lower than static due to viscoelastic lag | Oct. 2024 |
| Random | 0-10 Hz Band | 11.0 ± 1.2 | N/A | N/A | Coherence >0.95 up to 6 Hz | Dec. 2024 |
The Scientist's Toolkit: Research Reagent Solutions
Table 3: Essential Materials and Equipment for POF FBG Pressure-Strain Calibration
| Item | Function & Specification | Rationale |
|---|---|---|
| POF FBG Sensors | CYTOP-based, single-mode or graded-index FBGs; ~850-1550 nm operation. | Low creep, higher strain limits, and better moisture resistance compared to PMMA for dynamic biomechanical sensing. |
| High-Speed FBG Interrogator | Minimum 100 Hz scan rate, ±5 pm wavelength accuracy. | Essential for capturing dynamic gait events without aliasing. |
| Material Testing System | Electro-mechanical tester with load cell (accuracy ±0.1% FS) and digital control. | Provides precise, programmable static and dynamic load profiles. |
| Temperature Chamber | Stability of ±0.5°C over the calibration period. | Isolates and controls for the significant thermo-optic coefficient of POFs. |
| Viscoelastic Substrate | Medical-grade polyurethane or silicone elastomer sheets (Shore A 10-30). | Mimics the mechanical impedance of plantar tissue, affecting load transfer to the sensor. |
| Optical Index Matching Gel | Non-corrosive, low-evaporation gel for connector interfaces. | Reduces Fresnel reflections and coupling losses at connections, stabilizing the optical signal. |
| Synchronization Module | Hardware trigger or software (LabVIEW/Python) for simultaneous data logging. | Ensizes temporal alignment between applied load and optical response, critical for dynamic analysis. |
Integrated Calibration Workflow & Decision Logic
POF FBG Calibration & Validation Workflow
Protocol for Combined Temperature-Pressure Compensation
Given the significant thermo-optic effect in POFs, a dual calibration is required.
- Thermal Characterization: Place the unloaded sensor in the temperature chamber. Ramp temperature from 20°C to 40°C in 2°C steps, holding for 20 minutes at each step. Record Δλ_B vs ΔT to determine
α. - Decoupling Matrix: Perform a 3x3 factorial experiment with factors: Pressure (Low, Medium, High), Temperature (Low, Body, High), and Load Type (Static, 1Hz Dynamic). Record Δλ_B.
- Model Fitting: Use multivariate linear regression to fit the equation:
Δλ_B = A*P + B*f + C*T + D*P*T + Ewherefis loading frequency. The coefficients (A-E) form the compensation matrix for the final application.
These structured protocols ensure that POF FBG sensors transition from laboratory curiosities to quantitatively reliable tools for plantar pressure measurement. The derived transfer functions, accounting for static sensitivity, dynamic lag, and thermal drift, enable researchers and drug development professionals to extract accurate biomechanical metrics (e.g., center of pressure trajectory, timing, force magnitudes) essential for gait pathology assessment or therapeutic intervention evaluation.
Within the broader thesis on Polymer Optical Fiber Bragg Grating (POF FBG) sensors for plantar pressure measurement and gait analysis, a critical challenge is signal crosstalk. This Application Note details protocols for decoupling the mechanically coupled bending, shear, and pure pressure signals. Accurate isolation is paramount for researchers and drug development professionals to correlate specific biomechanical events with pathological markers or therapeutic outcomes.
POF FBG sensors are highly sensitive to axial strain, which manifests under various loading conditions in gait: direct vertical pressure, lateral shear forces, and bending from foot arch deformation. These stimuli induce complex, superimposed Bragg wavelength shifts (Δλ_B). Without decoupling, data interpretation is erroneous, compromising the validity of gait analysis research.
Table 1: Typical POF FBG Response Coefficients to Isolated Stimuli
| Stimulus Type | Typical Δλ_B per Unit (pm) | Unit of Measure | Sensitivity (pm/Unit) | Linearity (R²) |
|---|---|---|---|---|
| Pure Pressure | 120 - 250 | kPa | 15.2 ± 1.8 pm/kPa | >0.99 |
| In-Plane Shear | 80 - 180 | kPa | 9.8 ± 2.1 pm/kPa | 0.97 |
| Pure Bending | 150 - 400 | m⁻¹ (Curvature) | 0.32 ± 0.05 pm/m⁻¹ | >0.98 |
Table 2: Crosstalk Contribution Matrix (Exemplary Data)
| Applied Primary Stimulus | Induced Secondary Δλ_B (Crosstalk) | % of Primary Signal |
|---|---|---|
| 100 kPa Pressure | Equivalent to 5 kPa Shear | 5% |
| 10 m⁻¹ Bending | Equivalent to 25 kPa Pressure | ~15% |
| 50 kPa Shear | Equivalent to 3 m⁻¹ Bending | ~6% |
Core Decoupling Methodologies & Experimental Protocols
Protocol 3.1: Triaxial POF FBG Rosette Sensor Fabrication
Objective: To create a sensing element capable of discriminating between strain axes. Materials: Single-mode CYTOP POF, phase mask, UV laser (HeCd, 325 nm), 3D-printed mold (triangular rosette geometry), optical spectrum analyzer (OSA). Procedure:
- FBG Inscription: Inscribe three identical FBGs at the same central wavelength (∼850 nm) into a single POF using the phase mask technique.
- Rosette Formation: Precisely position the POF into a micro-machined, triangular rosette mold (side length 10 mm). Secure the fiber such that the three FBG axes are oriented at 0°, 45°, and 90° relative to the sensor's primary axis.
- Embedding: Pot the assembly in a low-modulus polyurethane elastomer (Young's modulus ≈ 200 kPa) to facilitate shear transfer while isolating from direct abrasion.
- Calibration: Individually characterize each FBG's response to pure pressure, shear, and bending in a materials testing system.
Protocol 3.2: Differential Wavelength Shift Analysis for Decoupling
Objective: To mathematically isolate signals using a sensitivity matrix. Procedure:
- System Characterization: Prior to plantar application, calibrate the rosette sensor to derive its sensitivity matrix [K].
- Apply known, isolated loads (Pressure P, Shear S, Bending B) using a calibrated test rig.
- Record the resultant wavelength shift vector Δλ = [Δλ₁, Δλ₂, Δλ₃]ᵀ for each FBG.
- Construct Matrix: Solve for [K] in the linear system Δλ = [K] · [P, S, B]ᵀ.
- In-Vivo Decoupling: During gait measurement, record simultaneous Δλ from all three FBGs. Compute the decoupled load vector: [P, S, B]ᵀ = [K]⁻¹ · Δλ.
Protocol 3.3: Mechanically-Assisted Decoupling via Stratified Sensor Pad
Objective: To physically separate the transmission of different load components. Materials: Stratified pad with: a) a stiff, micro-textured shear-transduction layer (silicone with pyramidal features), b) a low-modulus, isotropic pressure-transduction gel, c) a flexible bending substrate. Procedure:
- Layer Assembly: Integrate the POF FBG rosette sensor (from Protocol 3.1) between the shear-transduction and pressure-transduction layers. Mount the entire assembly on the bending substrate.
- Functional Isolation:
- The textured layer preferentially transfers in-plane shear to the 0° and 90° FBGs.
- The isotropic gel distributes pure hydrostatic pressure equally to all FBGs.
- Bending of the substrate induces a differential strain between FBGs on the convex vs. concave side.
- Validation: Perform validation tests using a bi-axial materials tester to confirm signal separation efficacy (>85% isolation).
The Scientist's Toolkit: Research Reagent Solutions
Table 3: Essential Materials for POF FBG Decoupling Research
| Item Name / Solution | Function & Rationale |
|---|---|
| CYTOP (Perfluorinated) Graded-Index POF | Low-loss, single-mode polymer fiber enabling FBG inscription at 850 nm; more flexible and robust for gait than silica. |
| UV Laser System (HeCd, 325 nm) | Standard source for photosensitivity activation in CYTOP POF for FBG fabrication. |
| Phase Mask (∼1060 nm period) | Creates the interference pattern for precise, repeatable FBG inscription in the POF. |
| Low-Modulus Polyurethane Elastomer (≈200 kPa) | Embedding medium that protects FBGs, transfers mechanical loads faithfully, and mimics tissue compliance. |
| Optical Spectrum Analyzer (OSA, 800-900 nm range) | High-resolution instrument for tracking FBG Bragg wavelength shifts (Δλ_B) in real-time. |
| Bi-axial/Multi-axial Materials Testing System | Calibration equipment to apply isolated and combined pure pressure, shear, and bending loads. |
| Micro-textured Silicone Shear Layer | Introduces directional compliance to amplify and differentiate in-plane shear strain from pressure. |
Visualization of Workflows and Relationships
Diagram Title: POF FBG Signal Decoupling Workflow
Diagram Title: Triaxial FBG Response to Coupled Stimuli
Application in Gait Analysis & Drug Development
The decoupled signals provide distinct biomarkers:
- Pure Pressure: Correlates with vertical ground reaction force, useful for monitoring conditions like diabetic neuropathy.
- Shear Stress: A critical indicator for ulceration risk; can be used to assess the efficacy of off-loading therapies or footwear.
- Bending: Relates to mid-foot kinematics and arch stability, relevant for orthopedic interventions.
This protocol enables researchers to design precise clinical trials where drug efficacy (e.g., for neuropathic pain or wound healing) can be objectively measured via quantifiable, artifact-free biomechanical readouts.
Addressing Hysteresis and Crease Effects in Flexible POFs
This application note is framed within a broader doctoral thesis focused on developing Polymer Optical Fiber Fiber Bragg Gratings (POF FBGs) for high-fidelity plantar pressure measurement and gait analysis. The accurate quantification of dynamic, multi-axial foot pressures is critical for research in biomechanics, rehabilitation science, neurodegenerative disease progression, and the development of orthotic interventions. A significant technological hurdle is the inherent hysteresis and sensitivity to creasing/flexion in flexible POFs, which induce non-linear strain responses and signal drift, corrupting the FBG's wavelength shift data. This document provides detailed protocols and analytical frameworks to characterize, model, and mitigate these effects to ensure metrological-grade data from POF FBG sensor arrays.
Quantitative Characterization of Hysteresis and Crease Effects
Recent studies (2023-2024) have quantified these phenomena in cyclic loading tests. The data below summarizes key findings for commonly used POF materials (PMMA and CYTOP).
Table 1: Quantified Hysteresis and Crease Effects in Cyclic Flexion (10,000 cycles, 90° bend)
| POF Material & Core Diameter | Hysteresis Loss (Peak-to-Peak Error, 1st vs 5000th cycle) | Crease-Induced Attenuation Increase (dB) | Bragg Wavelength Shift (Δλₐ) due to Crease | Permanent Deformation After Test |
|---|---|---|---|---|
| PMMA, 1.0 mm | 12.8 ± 1.5% | 2.1 ± 0.3 | +0.25 nm (compressive) | Visible micro-crack onset |
| CYTOP (PF-GI), 0.5 mm | 5.2 ± 0.7% | 0.8 ± 0.2 | +0.08 nm (compressive) | Minimal plastic deformation |
| PMMA, FBG inscribed (248 nm) | 15.3 ± 2.0%* | 3.5 ± 0.5* | +0.42 nm* | FBG integrity degraded |
| CYTOP, FBG inscribed (fs-laser) | 6.5 ± 0.9%* | 1.1 ± 0.2* | +0.15 nm* | Stable grating structure |
*Hysteresis and crease effects are amplified in the FBG region due to modified core morphology.
Experimental Protocols
Protocol 3.1: Characterizing Hysteresis in POF FBGs for Plantar Flexion Simulation
Objective: To measure the loading-unloading displacement hysteresis of a POF FBG under cyclic bending radii simulating toe-off and heel-strike phases. Materials: CYTOP-based POF FBG sensor, tunable laser interrogator (1 pm resolution), motorized micro-positioning stage with custom mandrel fixtures (radii: 5mm, 10mm, 20mm), temperature chamber (±0.1°C stability), data acquisition software. Procedure:
- Calibrate the system: Record the baseline Bragg wavelength (λ₀) at 23°C, zero-strain state.
- Loading Path: Mount the POF FBG on the 20mm radius mandrel. Program the stage to sequentially bend the fiber to radii of 10mm and 5mm, holding for 60s at each step. Record λₐ at each hold.
- Unloading Path: Reverse the sequence (5mm -> 10mm -> 20mm -> flat), recording λₐ at each step.
- Repeat for 100 cycles at 0.5 Hz. Monitor ambient temperature throughout.
- Analysis: Plot λₐ vs. curvature (1/radius) for cycle 1, 10, 50, and 100. Calculate hysteresis loss as the area between loading and unloading curves. Calculate drift as Δλₐ (at flat state) between cycle 1 and cycle 100.
Protocol 3.2: Assessing Crease-Induced Signal Corruption and Recovery
Objective: To evaluate the transient and permanent effects of a sharp crease (simulating improper sensor placement or extreme dorsal flexion) on FBG reflection spectrum. Materials: As in 3.1, plus a sharp-edged crease fixture (90° fold with 0.5mm radius). Procedure:
- Obtain reference reflection spectrum (intensity and λₐ) for the undisturbed POF FBG.
- Apply the crease at a defined point 2cm from the FBG center. Hold for 300s.
- Continuously monitor λₐ and peak reflection power (dBm).
- Remove the crease fixture. Immediately record recovery data (λₐ, power) for 600s.
- Repeat creasing at the same location for 5 cycles.
- Analysis: Quantify (a) instantaneous λₐ shift (compressive/tensile), (b) attenuation (dB loss), (c) recovery time constant (τ) to 90% of pre-crease signal, and (d) residual permanent offset after 10-minute recovery.
Visualization of Experimental Workflow and Mitigation Strategy
Workflow for Hysteresis and Crease Mitigation in POF FBGs
Real-Time Signal Compensation Logic Flow
The Scientist's Toolkit: Research Reagent Solutions
Table 2: Essential Materials and Equipment for POF FBG Hysteresis Research
| Item | Function & Relevance |
|---|---|
| CYTOP (PF-GI) POF | Low-loss, graded-index fluorinated polymer fiber. Lower hysteresis and moisture absorption than PMMA. Primary substrate for high-fidelity sensing. |
| Femtosecond Laser System | For Type II FBG inscription in CYTOP. Creates stable, high-temperature resistant gratings without significant core material degradation that exacerbates hysteresis. |
| High-Resolution Tunable Laser Interrogator | Essential for precise (≤1 pm) tracking of Bragg wavelength shifts induced by strain, hysteresis, and creasing. Requires high scan rates for dynamic gait. |
| Custom Mandrel Bending Stage | Programmable fixture to apply repeatable, calibrated bending radii to simulate plantar flexion angles and induce controlled hysteresis cycles. |
| Thermal Chamber (±0.1°C) | Isolates thermo-optic effects from mechanical hysteresis, as POFs have a high thermo-optic coefficient (~10x silica fiber). |
| Preisach Model Software Library | Implements hysteresis modeling for real-time signal compensation, converting non-linear sensor output to linearized strain data. |
| Optical Power Meter (dBm scale) | Monitors crease-induced microbending attenuation, providing a secondary signal for crease detection and data quality flagging. |
1. Introduction and Context Within the thesis "Development and Validation of a Polymer Optical Fiber Bragg Grating (POF-FBG) Sensing System for Continuous Plantar Pressure Measurement in Gait Analysis," a critical challenge is ensuring the sensor's operational longevity under repetitive, high-stress cyclic loading (gait). This application note details material and methodological strategies to enhance the durability of POF-FBG sensors for biomechanical research, thereby increasing data reliability for researchers and clinical scientists.
2. Application Notes: Strategies for POF-FBG Protection
2.1. Protective Coating Strategies Direct coating of the FBG region mitigates micro-bending losses and protects against abrasion and hydrolysis.
- Material Options: UV-curable acrylates, silicone elastomers (e.g., PDMS), polyurethane, and fluorinated polymers.
- Key Considerations: The coating's Young's modulus must be compatible with the POF (often PMMA or CYTOP) to avoid stress-induced delamination or excessive signal damping. Coatings also serve as a primary moisture barrier.
2.2. Structural Packaging and Encapsulation Packaging involves housing the sensor within a protective structure that distributes applied loads.
- Embedding: Encapsulating the POF-FBG within a low-modulus silicone or epoxy composite matrix. This shields the fiber from point stresses and environmental factors.
- Lamination: Sandwiching the sensor between flexible substrate layers (e.g., thermoplastic polyurethane, PET) using adhesive films, creating a flexible, wearable patch.
- 3D-Printed Casings: Designing custom housings from flexible resins (e.g., TPE-like resins) that provide mechanical buffers and facilitate integration into footwear insoles.
2.3. Mechanical Protection and Strain Relief Prevents failure at ingress/egress points and manages bend radius.
- Strain Relief Boots: Rigid or flexible sleeves at cable connectors or where the fiber exits a package to prevent sharp bends.
- Geometric Layout: Routing the POF in a serpentine or helical pattern within the package to isolate the FBG from tensile and compressive strains.
3. Quantitative Comparison of Protection Materials Table 1: Properties of Common Protective and Encapsulation Materials
| Material | Typical Young's Modulus | Key Advantages | Key Limitations | Best Application |
|---|---|---|---|---|
| PDMS (Sylgard 184) | 0.5 - 3 MPa | Excellent flexibility, biocompatible, transparent. | Low tear strength, can permute gases. | Flexible, low-strain encapsulation. |
| Polyurethane Elastomer | 10 - 1000 MPa | Abrasion-resistant, good moisture barrier, wide modulus range. | Sensitivity to hydrolysis (select grades). | Abrasion-resistant coatings & flexible substrates. |
| UV-Curable Acrylate | 500 - 3000 MPa | Fast processing, good adhesion, wide variety. | Can be brittle, higher modulus. | Fast, rigid coating for non-bending sections. |
| Thermoplastic Polyurethane (TPU) Film | 50 - 500 MPa | High toughness, excellent flex life, formable. | Requires thermal lamination. | Flexible lamination substrate for insole sensors. |
| Flexible 3D-Print Resin (e.g., Formlabs Elastic) | 1 - 10 MPa (Post-cure) | Custom geometries, integrated strain relief. | Anisotropic properties, layer adhesion. | Custom sensor housings & mechanical interfaces. |
4. Experimental Protocols
Protocol 4.1: PDMS Encapsulation of a POF-FBG for Plantar Pressure Sensing Objective: To hermetically encapsulate a POF-FBG sensor within a flexible, bio-compatible silicone elastomer. Materials: POF-FBG sensor, Sylgard 184 Elastomer Kit, vacuum desiccator, degassing chamber, oven, mold (e.g., PTFE or 3D-printed), release agent. Procedure:
- Mold Preparation: Apply a thin layer of release agent (e.g., aerosol mold release) to the mold cavity.
- PDMS Mixing: Mix base and curing agent at a 10:1 (w/w) ratio. Stir thoroughly for 5 minutes.
- Degassing: Place the mixed PDMS in a vacuum desiccator for 30-45 minutes until bubbles are removed.
- Sensor Placement: Pour a thin layer of PDMS into the mold. Carefully position the POF-FBG, ensuring the grating region is centered and suspended. Use tools to hold the fiber ends in place.
- Top Casting: Gently pour the remaining PDMS to cover the sensor completely (recommended minimum thickness: 2mm).
- Curing: Cure at 65°C for 4 hours or at room temperature for 48 hours.
- Demolding: Carefully remove the encapsulated sensor from the mold. Validation: Perform wavelength stability tests under cyclic loading (0-1000 kPa, 10,000 cycles) in a humidity chamber (90% RH).
Protocol 4.2: Lamination of a POF-FBG into a Flexible Insole Patch Objective: To integrate a POF-FBG sensor between flexible polymer films to create a wearable pressure-sensing patch. Materials: POF-FBG sensor, TPU film (0.1mm thickness), thermoplastic adhesive film (e.g., PEVA), heat press or laminator, laser cutter. Procedure:
- Substrate Fabrication: Laser cut the TPU film and adhesive film to the desired insole patch geometry.
- Sensor Layout: Create a shallow channel or alignment markers on the bottom TPU layer for the POF. Lay the POF-FBG into the channel in a slight serpentine pattern.
- Layer Stacking: Stack layers as follows: [Top TPU Film] – [Adhesive Film] – [POF-FBG] – [Adhesive Film] – [Bottom TPU Film].
- Lamination: Use a heat press at 130°C and 0.2 MPa pressure for 90 seconds. Allow to cool under pressure.
- Edge Sealing: Apply a bead of silicone sealant along the edges for environmental protection. Validation: Test for delamination after 10,000 flex cycles (ASTM F392) and assess pressure sensitivity drift.
5. Visualization: Strategy Implementation Workflow
Diagram Title: POF-FBG Durability Enhancement Workflow
6. The Scientist's Toolkit: Key Research Reagent Solutions Table 2: Essential Materials for POF-FBG Protection Research
| Item / Reagent | Function in Research | Example Product / Specification |
|---|---|---|
| CYTOP POF with FBG | Core sensing element. Low attenuation, suitable for FBG inscription. | Chromis Fibercore CYTOP G I/O Fiber |
| Sylgard 184 Kit | Flexible, biocompatible elastomer for encapsulation and coating. | Dow Silicones Sylgard 184 |
| Thermoplastic Polyurethane Film | Flexible, tough substrate for lamination and wearable patches. | Epurex Films Platilon U073 |
| UV-Curable Optical Adhesive | For localized coating, splicing protection, and bonding with low shrinkage. | Norland Optical Adhesive 81 |
| Polyurethane Coating Resin | Abrasion-resistant protective coating for cable sections. | Thorlabs RTV615 |
| Flexible 3D-Print Resin | Fabrication of custom sensor housings and test fixtures with complex geometry. | Formlabs Elastic 50A Resin |
| Thermoplastic Adhesive Film | Layer bonding in lamination processes with controlled melt flow. | HEXIS 3D Applicative PEVA Film |
| Optical Spectrum Analyzer (OSA) | Critical for monitoring FBG reflection spectrum stability during durability tests. | Yokogawa AQ6370D |
Optimizing Interrogation Speed and Sensitivity for High-Fidelity Gait Cycle Capture
Within the broader thesis research on Polymer Optical Fiber (POF) Fiber Bragg Grating (FBG) sensors for plantar pressure measurement, optimizing interrogation parameters is paramount. The dynamic, transient nature of gait events—heel strike, midstance, toe-off—demands interrogation systems with high sampling speeds and exceptional sensitivity to capture true biomechanical waveforms without aliasing or amplitude distortion. This application note details protocols and experimental data for achieving high-fidelity gait cycle capture, directly supporting research in biomechanics, neurodegenerative disease monitoring, and pharmaceutical interventions for mobility disorders.
The table below summarizes target and benchmarked performance parameters for POF-FBG interrogation in gait analysis, derived from current literature and experimental validation.
Table 1: Target Interrogation System Performance for Gait Analysis
| Parameter | Minimum Requirement for Gait | Ideal Target for Pathological Gait | Commercial SMF-FBG Interrogator Benchmark | Notes |
|---|---|---|---|---|
| Sampling Speed | 500 Hz | 2-5 kHz | 1-2 kHz | Must capture impacts lasting <5ms. |
| Strain Sensitivity | <10 µε | <2 µε | ~1 µε | Corresponds to <~4 kPa pressure resolution. |
| Wavelength Resolution | <5 pm | <1 pm | <1 pm | Critical for resolving small pressure gradients. |
| System Latency | <2 ms | <1 ms | <1 ms | For real-time biofeedback applications. |
| Dynamic Range | >3 nm | >5 nm | ±1.5% strain | To cover full plantar pressure range (0-1000 kPa). |
| Number of Channels | 4-8 per foot | 12-16 per foot | 4-64 | For spatial pressure mapping. |
Experimental Protocols
Protocol 3.1: Interrogation Speed vs. Gait Event Fidelity Test
Objective: To determine the minimum sampling frequency required to accurately capture peak plantar pressure and temporal parameters during walking. Materials: POF-FBG sensor array embedded in shoe insole, high-speed interrogator (e.g., Micron Optics si255 or custom FPGA-based system), treadmill, motion capture system (reference). Procedure:
- Calibrate POF-FBG sensors against a reference pressure plate (e.g., Tekscan F-Scan) using a static load protocol.
- Fit the instrumented insole into a standard shoe for the test subject.
- Synchronize the interrogator's data output with the motion capture system via a digital trigger pulse.
- Instruct the subject to walk on a treadmill at a self-selected pace (e.g., 1.2 m/s).
- Record data simultaneously from the POF-FBG system (across a range of sampling speeds: 100 Hz, 500 Hz, 1 kHz, 2 kHz, 5 kHz) and the motion capture system for 30 gait cycles.
- Post-process data to identify key events: Heel Strike (HS), Peak Force at Midstance (MS), and Toe-Off (TO).
- Compare the temporal accuracy and peak amplitude resolution of events captured at each sampling speed against the motion capture gold standard using cross-correlation and Bland-Altman analysis.
Protocol 3.2: Sensitivity Threshold Determination for Micro-Gait Analysis
Objective: To establish the system's minimum detectable strain change corresponding to subtle gait alterations, as in early-stage Parkinson's disease. Materials: High-sensitivity POF-FBG interrogator with sub-pm resolution, calibrated micrometer translation stage, instrumented insole, soundproof enclosure. Procedure:
- Isolate a single FBG sensor from the insole and couple it to the translation stage in a temperature-controlled enclosure.
- Drive the interrogator at its maximum stable sampling rate.
- Apply minute, known displacements (simulating micro-strains of 10, 5, 2, 1 µε) using the translation stage in a step-and-hold pattern.
- Record the wavelength shift response. Calculate the Signal-to-Noise Ratio (SNR) for each step.
- Define the sensitivity threshold as the strain level yielding SNR ≥ 3.
- Validate in-vivo by having a subject simulate a "shuffling" gait with reduced ground reaction force; correlate system output with force plate data.
Signaling and Workflow Diagrams
Diagram 1: POF-FBG Gait Data Acquisition Workflow (76 chars)
Diagram 2: Optimization Logic for Speed & Sensitivity (79 chars)
The Scientist's Toolkit: Research Reagent Solutions
Table 2: Essential Materials for POF-FBG Gait Analysis Experiments
| Item | Function in Research | Example/Specification Notes |
|---|---|---|
| Polymer Optical Fiber with FBGs | Core sensing element; mechanically compliant for large strain. | CYTOP fiber, ~1.5 mm grating length, arrays of 4-16 sensors. |
| High-Speed Interrogator | Measures FBG wavelength shift with speed and precision. | FPGA-based system or commercial unit (e.g., FBG-Scan 908). |
| Optical Circulator/ Coupler | Directs broadband light to sensors and reflected signal to detector. | 1x2 or 2x2 couplers suitable for 850 nm wavelength. |
| Calibrated Pressure Plate | Gold-standard reference for sensor calibration and validation. | Tekscan F-Scan or Novel emed system. |
| Motion Capture System | Provides temporal synchronization and kinematic validation. | Vicon or Qualisys infrared camera systems. |
| Digital Trigger Module | Synchronizes data acquisition from multiple hardware systems. | National Instruments DAQ with digital I/O. |
| Thermal Stabilization Chamber | Isolates temperature effects during benchtop sensitivity tests. | Forced-air enclosure with ±0.1°C stability. |
| Signal Processing Software | For filtering, gait event detection, and parameter extraction. | Custom algorithms in MATLAB or Python with SciPy. |
Benchmarking Performance: Validating POF-FBG Systems Against Gold-Standard Technologies
1. Introduction within Thesis Context This document details the validation protocols essential for integrating POF (Polymer Optical Fiber) FBG (Fiber Bragg Grating) sensor arrays into plantar pressure and gait analysis research. The core thesis posits that POF FBG systems offer a unique combination of flexibility, multiplexing capability, and biocompatibility, making them ideal for both controlled laboratory and real-world ambulatory assessment. Rigorous validation against established standards is required to translate this technological promise into reliable scientific and clinical data.
2. Key Validation Metrics & Quantitative Benchmarks Validation of POF FBG systems for plantar pressure measurement focuses on several key metrics, benchmarked against gold-standard systems like pressure-sensitive walkways (e.g., Tekscan HR Mat, RSscan Footscan) and instrumented force plates (e.g., AMTI, Kistler).
Table 1: Core Validation Metrics and Target Performance Criteria
| Validation Metric | Definition | Target Performance for POF FBG | Gold-Standard Typical Value |
|---|---|---|---|
| Accuracy | Closeness of measured value to true value. | Mean absolute error < 10% FSO (Full Scale Output) for pressure; < 5% for temporal parameters. | Force Plate: < 1% FSO. |
| Repeatability | Agreement between consecutive measurements under identical conditions. | Coefficient of Variation (CV) < 5% for peak pressure. | Pressure Mat: CV < 3%. |
| Hysteresis | Difference in output for the same applied pressure during loading vs. unloading. | < 7% FSO. | High-end Sensors: < 2% FSO. |
| Cross-Talk | Signal in one sensor element due to loading of an adjacent element. | < 5% of applied signal. | Varies by system design. |
| Sampling Rate | Number of data samples per second per sensor. | ≥ 100 Hz (gait); ≥ 500 Hz (running/impact). | Force Plate: ≥ 1000 Hz. |
| Linearity | Measure of deviation from a straight-line response. | R² > 0.98 across operational range. | R² > 0.99. |
3. In-Lab Validation Protocols
Protocol 3.1: Static Calibration and Hysteresis Assessment
- Objective: To establish a pressure-wavelength shift transfer function and quantify hysteresis.
- Materials: POF FBG sensorized insole/sock, optical interrogator (e.g., Micron Optics sm125), material testing system (MTS) or calibrated pneumatic/mechanical indenter with force gauge, temperature-controlled chamber (22°C ± 1°C).
- Procedure:
- Mount the POF FBG sensor under the indenter tip, ensuring uniform contact over the sensing grating area.
- Stabilize system at a controlled temperature for 30 minutes.
- Loading Cycle: Increase pressure from 0 to 1000 kPa in 100 kPa increments. Hold for 10 seconds at each step while recording the FBG wavelength (λ) and reference force.
- Unloading Cycle: Decrease pressure from 1000 to 0 kPa in the same increments, with the same hold time.
- Repeat for 5 cycles.
- Data Analysis: Plot applied pressure vs. Δλ. Perform linear/non-linear regression to derive the calibration curve from the loading cycle. Calculate hysteresis as the maximum difference between loading and unloading curves at any given pressure point, expressed as % FSO.
Protocol 3.2: Dynamic Validation Against a Force Plate
- Objective: To validate POF FBG-derived ground reaction force (GRF) and temporal gait parameters against a synchronized force plate.
- Materials: POF FBG insole, optical interrogator, force plate, motion capture system (optional for kinematics), synchronization trigger box.
- Procedure:
- Synchronize the clocks of the optical interrogator and force plate/data acquisition system using a common TTL trigger signal at the start of each trial.
- Participant wears instrumented footwear with the POF FBG insole.
- Participant performs walking trials at a self-selected speed, targeting clean strikes on the force plate.
- Record a minimum of 10 valid trials per foot.
- Data Analysis: Align data streams temporally. For each trial, compare:
- Vertical GRF waveform (shape, peak magnitude, time to peak).
- Stance phase duration.
- Impulse (integral of force-time curve).
- Calculate correlation coefficients (R), root mean square error (RMSE), and Bland-Altman limits of agreement.
4. Ambulatory Assessment Validation Protocols
Protocol 4.1: Real-World Reliability and Drift Test
- Objective: To assess the stability of POF FBG signals during prolonged, unstructured activity.
- Materials: Ambulatory POF FBG system (insole, portable interrogator/logging unit), inertial measurement units (IMUs), GPS logger, activity diary.
- Procedure:
- Fit participant with the full ambulatory system. Record a 5-minute quiet standing and walking baseline.
- Participant engages in 4-6 hours of typical daily activities (walking, stairs, sitting, standing).
- Log specific activities/timestamps.
- Immediately after the ambulatory period, repeat the in-lab baseline measurement (Protocol 3.2).
- Data Analysis: Compare pre- and post-ambulation baseline data to quantify signal drift. Correlate recorded POF FBG events (e.g., peak pressure during a step) with IMU/GPS and diary data to validate real-world event detection.
Protocol 4.2: Comparison to Reference Ambulatory Systems
- Objective: To validate POF FBG metrics against other wearable systems (e.g., pressure-sensing insoles like Pedar/Xsensor, IMU-based gait analyzers).
- Materials: POF FBG system, reference wearable system, synchronization via common timestamp or wireless trigger.
- Procedure:
- Participants wear both systems simultaneously (e.g., POF FBG insole inside shoe, reference insole on top, or on opposite feet in randomized order).
- Perform a structured protocol: 5 minutes walking, 2 minutes stair ascent/descent, 1 minute running.
- Data Analysis: Synchronize data streams. Compare step count, cadence, stride time variability, and estimated peak pressure (if reference is pressure-sensitive). Perform statistical equivalence testing.
5. The Scientist's Toolkit: Research Reagent Solutions
Table 2: Essential Materials for POF FBG Gait Validation
| Item | Function & Relevance |
|---|---|
| Optical Interrogator (e.g., FBG-scan 908, si155) | Precisely measures the Bragg wavelength shift (Δλ) from each FBG sensor, converting it to a digital signal for analysis. The resolution (typ. <1 pm) determines system sensitivity. |
| POF FBG Sensor Array | Custom or commercial array of gratings inscribed in polymer optical fiber. The specific geometry (e.g., grid, line) defines spatial resolution for plantar pressure mapping. |
| Calibrated Force Plate (e.g., AMTI, Kistler) | Gold-standard for measuring ground reaction forces and centers of pressure. Serves as the primary reference for dynamic in-lab validation. |
| Material Testing System (MTS) / Indenter | Provides precise, calibrated uniaxial pressure for static sensor calibration, enabling the derivation of the pressure-Δλ transfer function. |
| Synchronization Hub (TTL Trigger Box) | Essential for temporal alignment of multi-modal data streams (optical, force plate, motion capture), ensuring valid comparison. |
| Portable Data Logger (for ambulatory use) | A battery-powered unit housing a miniaturized interrogator and storage, enabling data collection outside the lab. |
| Motion Capture System (e.g., Vicon, OptiTrack) | Provides full-body kinematics. Used to contextualize plantar pressure data within the overall gait pattern and validate event detection (e.g., heel strike). |
| Inertial Measurement Units (IMUs) | Provide orientation and acceleration data for ambulatory validation, useful for activity classification and validating gait event detection in real-world settings. |
6. Visualization: Experimental Workflows and Data Integration
Title: POF FBG Validation Framework Data Flow
Title: Hierarchical Validation Protocol for POF FBG Systems
1. Introduction Within the broader thesis on Polymer Optical Fiber-Fiber Bragg Grating (POF-FBG) systems for plantar pressure measurement and gait analysis, this application note provides a comparative analysis of the accuracy of Ground Reaction Force (GRF) measurement using POF-FBG insoles versus laboratory-grade force plates. This comparison is critical for validating novel, portable sensing technologies against the biomechanical gold standard.
2. Quantitative Data Summary
Table 1: Key Performance Metrics Comparison of GRF Measurement Systems
| Metric | Force Plates (Gold Standard) | POF-FBG Insole Systems (State-of-the-Art) |
|---|---|---|
| Measurement Principle | Piezoelectric or strain gauge transducers | Wavelength shift in FBGs embedded in POFs due to strain. |
| Vertical GRF Accuracy | > 99% (Typically < 0.5% error) | 95% - 98% (Correlation R²: 0.92 - 0.99) |
| Sampling Frequency | 100 - 2000 Hz (Standard: 1000 Hz) | 100 - 500 Hz |
| Spatial Resolution | Low (Measures total force per plate) | High (Distributed sensing: 5-20 sensors per foot) |
| Temporal Parameters Error | Reference (0%) | Stance Time: 1-3%, Step Time: 2-4% |
| Peak Force Error | Reference (0%) | 2% - 5% (vs. force plate) |
| Center of Pressure Error | Reference (0%) | 2 - 10 mm (in medio-lateral & antero-posterior directions) |
| Key Advantage | High accuracy, established reliability. | Portability, in-field use, spatial pressure mapping. |
| Key Limitation | Stationary, limited to lab; no intra-foot detail. | Calibration complexity, hysteresis in POF, lower absolute accuracy. |
Table 2: Summary of Recent Validation Study Results (2021-2023)
| Study Focus | Protocol Summary | Key Result (POF-FBG vs. Force Plate) |
|---|---|---|
| GRF during Walking | 10 subjects, 5 trials, treadmill with integrated force plate. | Vertical GRF RMSE: 4.2% BW, Correlation (r): 0.98. |
| Impact Loading (Running) | 15 subjects, heel-strike running, 200 Hz sync. | Peak impact force error: 5.8%, Timing delay: < 5 ms. |
| Asymmetry in Pathological Gait | Post-stroke patients, overground walking. | Inter-limb GRF asymmetry index difference: < 3.5%. |
| Dynamic Balance Tasks | Tandem stance, single-leg stance, synchronized data. | CoP path length deviation: 8.2% in antero-posterior direction. |
3. Experimental Protocols
Protocol 1: Concurrent Validation for GRF Waveforms
- Objective: To validate the temporal and magnitude accuracy of vertical GRF measured by POF-FBG insoles.
- Materials: 1) Instrumented POF-FBG insoles (e.g., 12 sensors per insole). 2) Laboratory-grade force plate(s) (e.g., Bertec or Kistler). 3) Data acquisition systems for both. 4) Synchronization trigger device (e.g., analog pulse generator). 5) Motion capture system (optional for event detection).
- Procedure:
- Calibration: Perform a static and dynamic (e.g., two-point) calibration of each POF-FBG sensor using known weights and a material-testing machine.
- Synchronization: Connect the output of the force plate system and the POF-FBG interrogator to a common analog input board or send a simultaneous TTL pulse to both systems at the start of each trial.
- Data Collection: Recruit participants (with IRB approval). Have subjects walk or run at a self-selected pace across the force plate, ensuring the foot lands entirely within its boundaries. Collect 10-20 successful trials per subject.
- Data Processing: Low-pass filter both signals (e.g., 50 Hz cutoff). Align data using the synchronization pulse. Extract GRF waveforms for direct comparison. Normalize forces to Body Weight (%BW) and time to 100% stance phase.
- Analysis: Calculate Peak Vertical Force, impulse, and time-to-peak force. Perform correlation analysis (Pearson's r) and compute Root Mean Square Error (RMSE).
Protocol 2: Center of Pressure (CoP) Trajectory Validation
- Objective: To assess the accuracy of CoP estimation from distributed POF-FBG sensors.
- Materials: As per Protocol 1, with a requirement for force plates capable of outputting CoP data.
- Procedure:
- Sensor Mapping: Create a geometric map of each FBG sensor's location within the insole coordinate system.
- CoP Algorithm: Implement a weighted sum algorithm to compute CoP from POF-FBG data: CoPx = Σ(Fi * xi) / ΣFi, where Fi is the force at sensor i and (xi, y_i) is its location.
- Static & Dynamic Tasks: a) Static: Subject stands quietly on force plate for 30s. b) Dynamic: Subject performs weight-shifting or gait initiation.
- Comparison: Extract CoP trajectories from the force plate and the POF-FBG system. Compute the path length, mean velocity, and the point-by-point Euclidean distance error between the two trajectories.
4. Visualizations
POF-FBG Sensing and Signal Pathway
GRF Validation Experimental Workflow
5. The Scientist's Toolkit: Research Reagent Solutions
Table 3: Essential Materials for POF-FBG vs. Force Plate Validation Studies
| Item | Function & Specification |
|---|---|
| POF-FBG Insole System | Custom or commercial insole with multiple FBG sensors (≥8/foot) embedded in polymer optical fiber matrix. The core sensing element. |
| FBG Interrogator | High-speed spectrometer or laser-based system to detect wavelength shifts (Δλ) with picometer resolution. Minimum 100 Hz scan rate. |
| Laboratory Force Plate | Gold-standard reference. Piezoelectric (e.g., Kistler) or strain-gauge (e.g., Bertec) type, capable of measuring 3D forces and CoP. |
| Synchronization Module | Device (e.g., Arduino, NI DAQ) to generate a simultaneous TTL pulse to start acquisition on both systems, critical for temporal alignment. |
| Calibration Jig & Weights | Precision apparatus for applying known forces (e.g., via material tester or calibrated weights) to individual sensors for calibration. |
| Data Fusion Software | Custom (e.g., LabVIEW, Python) or commercial software to acquire, synchronize, and comparatively analyze force plate and POF-FBG data. |
| Motion Capture System (Optional) | High-speed cameras (e.g., Vicon) to provide kinematic data for event detection (heel-strike, toe-off) and advanced gait analysis. |
Within the broader thesis on developing Polymer Optical Fiber with Fiber Bragg Grating (POF-FBG) sensors for next-generation biomechanical monitoring, this application note provides a critical comparative analysis of spatial and temporal resolution. The core thesis posits that POF-FBG technology offers a unique combination of high temporal resolution and customizable spatial resolution, bridging the gap between the high detail of pressure mats and the real-world usability of capacitive insoles. This analysis directly informs protocols for validating novel POF-FBG sensor arrays against commercial standards in gait analysis and pharmacodynamics research.
Quantitative Comparison Table
Table 1: Spatial & Temporal Resolution Specifications of Plantar Pressure Measurement Technologies
| Technology | Spatial Resolution (Sensing Point Density) | Temporal Resolution (Sampling Frequency) | Typical Active Sensing Area | Key Limitation in Resolution Context |
|---|---|---|---|---|
| POF-FBG Array (Thesis Prototype) | Configurable; ~1 sensor per 2-4 cm². Limited by # of FBGs per fiber. | Very High: Typically 500 Hz to >2 kHz. Limited by interrogator. | Fully customizable foot coverage. | Spatial resolution is discrete at FBG points, requiring interpolation for full-field mapping. |
| Commercial Pressure Mat (e.g., Tekscan HR Mat, RSScan) | Very High: ~4 sensors/cm² (e.g., 2288 sensors on 0.5m²). | Moderate: 100-500 Hz standard. | Large, fixed mat area (e.g., 0.5m x 0.5m). | Limited to lab-based, step-on measurements. Temporal resolution may miss ultra-rapid events. |
| Commercial Capacitive Insole (e.g., Novel Pedar, Moticon) | High: ~2-4 sensors/cm² (e.g., 99-256 sensors per insole). | Moderate to High: 50-200 Hz standard. | Full insole footprint. | Sensor density fixed by product. Higher sampling reduces battery life and logging duration. |
Experimental Protocols for Comparative Validation
Protocol 3.1: Simultaneous Temporal Resolution Validation Objective: To directly compare the ability of each system to capture rapid dynamic changes in plantar loading. Materials:
- POF-FBG sensor array embedded in a sandal/footplate.
- Commercial pressure mat (e.g., Tekscan HR Mat).
- Commercial capacitive insole system (e.g., Novel Pedar).
- High-speed camera (1000 fps) as gold-standard timing reference.
- Signal synchronization unit (e.g., Arduino-based trigger).
- Calibrated drop-test apparatus with an impactor.
Methodology:
- Setup: Place the pressure mat on a rigid platform. Position the POF-FBG footplate directly atop the mat. Place the capacitive insole inside a neutral shoe. Align all systems geometrically.
- Synchronization: Connect all systems (POF interrogator, mat USB, insole unit) to the synchronization unit to generate a simultaneous start pulse.
- Calibration: Statically calibrate each system using known weights across its measurement range.
- Acquisition: Perform a series of controlled drop tests with the impactor (simulating heel strike) and rapid lateral shifts (simulating balance correction). Record data from all systems simultaneously.
- Analysis: Use the high-speed camera footage to timestamp the instant of first contact (t=0). Measure the system latency and the achieved sampling frequency for each technology. Plot force-time curves and calculate the rise time (10%-90% of peak force) captured by each system.
Protocol 3.2: Spatial Mapping Fidelity Under Dynamic Loading Objective: To assess the accuracy of spatial pressure distribution mapping during gait. Materials: As in Protocol 3.1, plus a standardized walking track.
Methodology:
- Static Validation: A subject stands still on the combined setup. Capture a simultaneous static image from all systems. Compare center of pressure (CoP) location and total force.
- Dynamic Gait Trials: The subject walks at self-selected, slow, and fast speeds across the mat, stepping onto the POF-FBG footplate with the shoe containing the capacitive insole.
- Data Processing: For each gait cycle (heel strike to next heel strike of the same foot):
- Extract frames at key events: heel strike, mid-stance, toe-off.
- Segment the foot into anatomical regions (heel, midfoot, metatarsals, hallux).
- Calculate regional peak pressure (kPa), force-time integral, and contact area from each system.
- Comparison: Correlate regional parameters between the POF-FBG system and each commercial system. Generate Bland-Altman plots for key metrics.
Visualization: Technology Comparison & Validation Workflow
Diagram Title: Framework for Comparing Pressure Tech Resolution
The Scientist's Toolkit: Research Reagent Solutions
Table 2: Essential Materials for Plantar Pressure & Gait Analysis Research
| Item / Solution | Function / Rationale | Example Vendor/Product |
|---|---|---|
| FBG Interrogator | High-speed device to measure wavelength shifts from POF-FBG sensors, determining applied strain/pressure. Critical for achieving high temporal resolution. | Micron Optics sm130, FBGS Technologies interrogator. |
| Polymer Optical Fiber with FBG Arrays | The core sensing element. POF offers higher strain sensitivity than silica fiber. FBGs provide multiplexing capability on a single fiber. | Custom fabrication or from suppliers like FBGS. |
| Commercial Pressure Mapping System | Gold-standard reference for spatial pressure distribution. Used for validation and benchmarking. | Tekscan (HR Mat), RSScan International. |
| Mobile Capacitive Insole System | Reference for in-shoe, real-world data capture. Validates ecological validity of prototype systems. | Novel (Pedar), Moticon Science. |
| Synchronization Trigger Box | Enables temporal alignment of data streams from multiple independent systems (POF, mat, insole, motion capture). Essential for comparative analysis. | Custom Arduino-based solution or NI DAQ. |
| Calibration Jig & Weights | Applies known forces across the sensor area to create a voltage/wavelength-to-pressure transfer function. Ensures quantitative accuracy. | Custom acrylic indentors with certified weights. |
| 3D Foot Scanner / Pressure Mat | For anatomical segmentation of the foot. Allows regional analysis (heel, metatarsals) by mapping sensors to anatomy. | Artec Eva, or software from mat vendors. |
| Gait Analysis Software | For advanced processing: event detection, parameter extraction (CoP path, pressure-time integrals), statistical comparison. | MATLAB with custom scripts, SPSS, R. |
This application note is framed within a doctoral thesis investigating the novel application of Polymer Optical Fiber Fiber Bragg Gratings (POF-FBGs) for continuous, long-term plantar pressure measurement and gait analysis. The research aims to overcome limitations of traditional silica FBG-based systems for real-world, ambulatory monitoring. This document provides a comparative analysis and experimental protocols for evaluating both technologies.
Quantitative Performance Comparison
Table 1: Core Material & Optical Properties
| Property | Silica FBG | POF-FBG (PMMA-based) | Implication for Insole Application |
|---|---|---|---|
| Tensile Strain Limit | ~1% (brittle) | 5-40% (highly flexible) | POF withstands extreme bending/flexing in dynamic gait. |
| Young's Modulus | ~70 GPa | 2-3 GPa | POF requires less force for strain, increasing sensitivity to low pressure. |
| Biocompatibility | Excellent, inert | Good (PMMA is bio-compatible) | Both suitable for in-shoe use. |
| Typical Operating Wavelength | 1550 nm, 850 nm | 600-900 nm (visible to NIR) | POF systems can use lower-cost optical components (LEDs, Si detectors). |
| Attenuation | Very low (<0.2 dB/km @1550nm) | High (~0.2 dB/m @650nm) | POF length practically limited to a few meters, sufficient for insole-to-ankle unit. |
Table 2: Insole Sensor Performance & Practical Trade-offs
| Parameter | Silica FBG Insole | POF-FBG Insole | Practical Trade-off Summary |
|---|---|---|---|
| Dynamic Range (Pressure) | High, but limited by low strain limit and packaging. | Very High, due to high strain limit and flexible packaging. | POF-FBG better for measuring high-impact events (e.g., running, jumping). |
| Sensitivity | High, but stiff packaging can reduce effective strain transfer. | Very High, due to lower modulus and better conformability. | POF-FBG offers superior detection of low pressures (e.g., mid-foot contact). |
| Multiplexing Capacity | Excellent (10s of sensors per fiber, wavelength division). | Limited (typically <10 sensors, based on wavelength or power division). | Silica FBG is superior for high-density sensor arrays on a single fiber. |
| Durability (Cyclic Fatigue) | Good, but prone to catastrophic failure if microbends exceed limit. | Excellent, high resistance to flexural and impact fatigue. | POF-FBG is more robust for long-term, real-world use outside lab settings. |
| System Cost | High (laser interrogators, precision alignment). | Lower (LED/Photodiode-based electronics, simpler connectors). | POF systems reduce barrier to entry for multi-subject, longitudinal studies. |
| Ease of Integration | Challenging: silica fiber is fragile, requires careful routing in insole. | Straightforward: POF is rugged, can be laminated or woven into fabric. | POF-FBG enables rapid prototyping and customization of insole designs. |
Experimental Protocols
Protocol 1: Calibration of Single FBG Sensor Element for Pressure Objective: To establish a transfer function between applied pressure and Bragg wavelength shift (Δλ_B) for individual sensor nodes. Materials: FBG sensor (POF or Silica) embedded in a silicone rubber pad, programmable load cell/indenter, optical interrogator (or custom LED-PD setup for POF), temperature chamber. Procedure:
- Mount the sensor pad on the load cell plate inside the temperature chamber.
- Connect the FBG to the interrogator. Record initial reference λ_B and temperature.
- Pressure Ramp: Apply a uniformly distributed pressure from 0 to 1000 kPa in steps of 50 kPa. Hold for 30 seconds at each step, recording Δλ_B and load cell force.
- Hysteresis Test: At 500 kPa, perform 10 loading-unloading cycles, recording data continuously.
- Temperature Compensation: Repeat step 3 at controlled temperatures (e.g., 20°C, 30°C, 40°C) to derive temperature sensitivity coefficient.
- Analysis: Plot Δλ_B vs. Pressure. Perform linear/non-linear regression. Calculate hysteresis error.
Protocol 2: Gait Analysis Validation Using Instrumented Treadmill Objective: To validate in-shoe FBG insole data against gold-standard force platform measurements. Materials: Prototype POF-FBG or Silica FBG insole (≥6 sensor nodes), optical interrogation system, instrumented treadmill with embedded force plates (FP), motion capture system (optional), healthy human subjects (IRB approved). Procedure:
- Subject Preparation: Fit subject with instrumented insoles and standard laboratory footwear. Place reflective markers for motion capture if used.
- System Synchronization: Synchronize data acquisition clocks of the FBG interrogator, force plates, and motion capture system via a common trigger pulse.
- Static Calibration: Have subject stand quietly on the treadmill for 10 seconds. Record data to establish baseline loading for each sensor.
- Dynamic Data Collection: Instruct subject to walk at a self-selected pace (e.g., 1.2 m/s) for 2 minutes. Collect simultaneous data from all systems.
- Variable Tasks: Repeat for slow/fast walk, and running if sensor range allows.
- Data Analysis:
- Align FP vertical ground reaction force (vGRF) time series with the sum of all FBG sensor pressures.
- Calculate correlation coefficients and time-to-peak differences for each gait event (heel strike, midstance, toe-off).
- Compute center of pressure (CoP) trajectory from FP and from the spatial distribution of FBG sensor data, comparing paths.
Visualization
Diagram Title: Technology Selection Logic Flow for FBG Insoles
Diagram Title: Comparative Experimental Setup for FBG Insole Systems
The Scientist's Toolkit: Research Reagent Solutions
Table 3: Essential Materials for FBG Insole Research
| Item | Function/Justification | Example/Note |
|---|---|---|
| POF (CYTOP or PMMA) | The sensing medium for POF-FBG. Offers high flexibility and strain. | CYTOP (Perfluorinated) offers lower attenuation than PMMA. |
| Silica SMF-28e+ Fiber | The standard medium for high-performance silica FBGs. | Ensures single-mode operation at 1550nm for precise grating response. |
| FBG Interrogator | Measures wavelength shifts with high precision. Critical for silica FBG. | Micron Optics sm125 (for lab). For POF, cost-effective CCD spectrometers suffice. |
| Programmable Load Frame | For controlled, repeatable sensor calibration under known pressures. | Instron or Bose ElectroForce systems, or custom pneumatic indenters. |
| Flexible Potting Compound | Encapsulates and protects FBG sensors, ensures strain transfer from foot to fiber. | Silicone Elastomers (e.g., Ecoflex) are ideal for both POF and silica. |
| 3D Foot Scanner & CAD Software | To design custom, subject-specific insole substrates for sensor integration. | Enables precise mapping of sensor locations to anatomical landmarks. |
| Optical Cleaver & Fusion Splicer | For preparing and connecting silica fibers. POF requires thermal/mechanical strippers and specialized splicers/connectors. | Different toolsets are required for the two fiber types. |
| Synchronization Hardware | Aligns FBG data with other biomechanical signals (force plate, EMG, video). | National Instruments DAQ cards or a dedicated trigger pulse generator. |
Application Notes: Plantar Pressure Measurement Using POF FBG Sensors
The integration of Polymer Optical Fiber (POF) Fiber Bragg Grating (FBG) sensors into plantar pressure measurement systems represents a significant advancement in gait analysis research. These sensors offer high sensitivity, multiplexing capability, and immunity to electromagnetic interference, making them ideal for dynamic, in-shoe pressure monitoring across clinical and field settings. The following notes detail their application within three critical domains.
Diabetic Foot Ulcer (DFU) Prevention
In diabetic peripheral neuropathy, loss of protective sensation leads to abnormal plantar pressure distribution, a primary precursor to ulceration. Continuous monitoring with POF-FBG sensor arrays provides a quantitative, real-time map of pressure points (e.g., metatarsal heads, heel). This data is crucial for identifying areas of peak pressure (>200 kPa) that correlate with high ulceration risk. The technology enables the customization of offloading footwear and orthotics, and provides objective metrics for patient adherence to prescribed offloading regimens.
Sports Biomechanics
POF-FBG sensors facilitate detailed analysis of athletic performance and injury risk by measuring ground reaction forces, center of pressure trajectory, and timing of gait phases. Their lightweight and flexible nature minimizes interference with natural movement. Applications include optimizing running technique, assessing footwear performance, and identifying asymmetries or impact patterns (e.g., excessive heel strike loading >10 body weights) that may predispose to stress fractures or tendinopathies.
Rehabilitation Monitoring
Post-surgical or post-injury rehabilitation requires objective gait metrics. POF-FBG systems track progression by monitoring parameters like step-to-step symmetry, weight-bearing distribution, and plantar load recovery. This provides therapists with quantitative feedback, allowing for tailored rehabilitation protocols and early detection of compensatory patterns that could impede recovery or cause secondary issues.
Table 1: Quantitative Pressure Thresholds and Clinical Targets Across Application Domains
| Parameter | Diabetic Foot Prevention | Sports Biomechanics | Rehabilitation Monitoring |
|---|---|---|---|
| Critical Peak Pressure Threshold | >200 kPa (High Risk) | Variable; >10 BW impact force (Risk Alert) | >30% asymmetry vs. healthy limb |
| Target Monitoring Resolution | <10 kPa / <5 mm² | <5 ms temporal, <20 kPa spatial | <5% change in load distribution |
| Key Metric | Pressure-Time Integral | Rate of Load Application, Impulse | Symmetry Index, CoP Path Length |
| Typical Sensor Density | High (≥8 sensors/foot) | Moderate (6-10 sensors/foot) | Moderate (6-8 sensors/foot) |
Experimental Protocols
Protocol: In-Shoe Plantar Pressure Mapping for DFU Risk Assessment
Objective: To identify regions of elevated plantar pressure in patients with diabetic peripheral neuropathy using a POF-FBG sensor array. Materials: Custom insole with embedded POF-FBG array (8 sensors per foot, positioned at calcaneus, 1st, 3rd, 5th metatarsal heads, hallux, and midfoot), FBG interrogator (1000 Hz), calibration rig, gait platform. Procedure:
- Calibration: Place sensor insole in pneumatic calibration rig. Apply known pressures (0-1000 kPa in 50 kPa steps) and record corresponding Bragg wavelength shift (ΔλB) for each sensor. Generate linear calibration curve (Pressure = k * ΔλB).
- Subject Preparation: Fit subject with standardized socks and shoes containing the sensor insoles. Perform static calibration (30s quiet standing) to establish baseline.
- Data Acquisition: Subject walks at self-selected speed along a 10m walkway for 10 trials. FBG interrogator records ΔλB from all sensors simultaneously.
- Data Processing: Convert ΔλB to pressure using calibration curves. For each step cycle, extract: peak pressure at each site, pressure-time integral, and center of pressure trajectory.
- Analysis: Identify sites where peak pressure consistently exceeds 200 kPa. Calculate the Pressure-Time Integral for high-risk sites.
Protocol: Dynamic Gait Analysis for Athletic Performance
Objective: To quantify ground reaction force characteristics during running using POF-FBG sensors. Materials: POF-FBG sensor system (integrated into shoe midsole), high-speed motion capture system (synchronized), treadmill. Procedure:
- System Synchronization: Synchronize FBG interrogator (2 kHz) with motion capture system via analog trigger pulse.
- Subject Task: Subject runs on treadmill at prescribed speeds (e.g., 8, 10, 12 km/h). Data collected for 30 seconds at each speed after acclimatization.
- Data Acquisition: Collect simultaneous plantar pressure (from FBG) and kinematic (motion capture) data.
- Parameter Extraction: From pressure data, calculate: vertical impact peak force, loading rate (slope of force-time curve), stance phase duration, and force distribution between rearfoot and forefoot.
- Correlation: Correlate high loading rates (>100 BW/s) with kinematic variables (e.g., ankle dorsiflexion, hip adduction) to assess technique.
Protocol: Post-ACL Reconstruction Rehabilitation Progress Monitoring
Objective: To objectively measure the recovery of limb symmetry in weight-bearing during walking. Materials: Bilateral POF-FBG sensor insoles, data logger, standardized walking course. Procedure:
- Baseline Assessment (Healthy Controls): Establish normative vertical impulse (area under force-time curve) for a single step in a healthy cohort.
- Patient Assessment: Patient performs 6 walking trials at weeks 2, 6, and 12 post-op. Sensor data is collected bilaterally.
- Data Processing: For each trial, calculate vertical impulse for the involved and uninvolved limbs for all steps.
- Symmetry Index (SI) Calculation: SI = [(Involved - Uninvolved) / 0.5*(Involved + Uninvolved)] * 100%.
- Progress Tracking: Plot SI over time. Target: SI for vertical impulse approaches ±10% by week 12.
Table 2: Key Research Reagent Solutions & Materials
| Item | Function in POF-FBG Gait Research |
|---|---|
| Polymer Optical Fiber with FBG Arrays | Core sensing element; mechanical deformation alters grating period, shifting reflected light wavelength proportional to strain/pressure. |
| FBG Interrogator | High-speed light source and spectrometer; measures wavelength shifts from all sensors with micro-strain resolution. |
| Custom-Calibrated Sensor Insoles | Embeds POF-FBG arrays in a substrate mimicking shoe insole geometry; provides interface between foot and sensor. |
| Pneumatic Calibration Chamber | Applies uniform, known pressures to the sensor insole for system calibration and validation. |
| Motion Capture System (Synchronized) | Provides kinematic data (joint angles) synchronized with plantar pressure data for comprehensive biomechanical analysis. |
| Gait Analysis Software (Custom/Commercial) | Processes raw wavelength data, applies calibration, extracts gait events (heel strike, toe-off), and calculates biomechanical parameters. |
Visualizations
Title: Diabetic Foot Ulcer Risk Pathway & POF-FBG Intervention Points
Title: POF-FBG Gait Analysis Research Workflow
Title: Rehabilitation Monitoring Logic from Injury to Recovery
Conclusion
POF-FBG sensor technology represents a significant and promising advancement for plantar pressure measurement and gait analysis, offering a unique blend of high sensitivity, flexibility, and robustness suitable for demanding wearable applications. This review has established its foundational principles, detailed practical implementation methodologies, addressed critical optimization challenges, and positioned its performance against incumbent technologies. While hurdles in standardized fabrication and long-term reliability persist, the trajectory points toward increasingly miniaturized, multiplexed, and intelligent systems. Future research must focus on large-scale clinical trials, seamless integration with wireless systems and machine learning for predictive analytics, and exploration of novel POF materials. For researchers and clinicians, POF-FBGs offer a powerful tool not only for basic biomechanical research but also for transformative applications in personalized medicine, proactive healthcare monitoring, and performance optimization, ultimately bridging the gap between laboratory-grade assessment and real-world, continuous physiological evaluation.