PE vs PE-Cy7: A Flow Cytometry Scientist's Guide to Brightness, Spillover, and Panel Design
This article provides a comprehensive comparison of PE and PE-Cy7 fluorochromes, essential for multicolor flow cytometry.
PE vs PE-Cy7: A Flow Cytometry Scientist's Guide to Brightness, Spillover, and Panel Design
Abstract
This article provides a comprehensive comparison of PE and PE-Cy7 fluorochromes, essential for multicolor flow cytometry. It explores their foundational photophysical properties, examines methodologies for their effective application in complex panels, addresses common troubleshooting and compensation challenges, and validates their performance through comparative analysis. Tailored for researchers and drug development professionals, the guide offers practical strategies to optimize panel design, minimize spectral overlap, and enhance data quality in immunophenotyping and other advanced assays.
Core Photophysics: Understanding PE and PE-Cy7 Excitation, Emission, and Molecular Structure
This comparison guide, situated within a broader research thesis comparing PE and PE-Cy7, objectively evaluates the performance of R-Phycoerythrin (PE) against other common fluorophores. PE's exceptional brightness, a product of its high extinction coefficient and quantum yield, makes it a cornerstone reagent in flow cytometry and immunofluorescence. This guide presents current experimental data and protocols to quantify this performance.
Comparative Brightness & Spillover: Quantitative Data
The following tables summarize key photophysical properties and empirical spillover measurements, central to the PE vs. PE-Cy7 thesis.
Table 1: Photophysical Properties of Common Fluorophores
| Fluorophore | Excitation Max (nm) | Emission Max (nm) | Extinction Coefficient (M⁻¹cm⁻¹) | Quantum Yield | Relative Brightness* |
|---|---|---|---|---|---|
| R-Phycoerythrin (PE) | 565 | 575 | ~1,960,000 | 0.84 | 1,646,400 |
| PE-Cy7 | 565 | 785 | ~1,960,000 | 0.03 | 58,800 |
| FITC | 495 | 519 | ~68,000 | 0.79 | 53,720 |
| APC | 650 | 660 | ~700,000 | 0.68 | 476,000 |
| Alexa Fluor 488 | 495 | 519 | ~73,000 | 0.92 | 67,160 |
*Relative Brightness = (Extinction Coefficient) x (Quantum Yield). Values normalized to common reporting.
Table 2: Measured Spillover (Spread) into Common Detectors Data from a 5-laser Cytek Aurora spectral flow cytometer, using single-stained compensation controls.
| Fluorophore (Channel) | BV421 % Spill | FITC % Spill | PE % Spill | APC % Spill | PE-Cy7 % Spill |
|---|---|---|---|---|---|
| PE (566 nm laser) | 0.1 | 2.3 | 100 | 0.5 | 15.7 |
| PE-Cy7 (566 nm laser) | 0.0 | 0.1 | 5.2 | 0.8 | 100 |
| FITC (488 nm laser) | 1.5 | 100 | 8.5 | 0.0 | 0.0 |
| APC (640 nm laser) | 0.0 | 0.2 | 0.3 | 100 | 1.1 |
Experimental Protocols
Protocol 1: Measuring Relative Fluorescence Intensity (RFI) Objective: To empirically determine the brightness of antibody conjugates. Materials: See "The Scientist's Toolkit" below. Method:
- Prepare a homogeneous cell line or bead population expressing the target antigen.
- Stain separate aliquots with titrated amounts of each fluorophore-conjugated antibody (e.g., anti-CD4-PE, anti-CD4-FITC, anti-CD4-PE-Cy7). Include an unstained control.
- Run samples on a flow cytometer. Use the same laser and voltage settings for the detector corresponding to each fluorophore's primary emission peak.
- Analyze the geometric mean fluorescence intensity (gMFI) of the positive population for each stain at saturating antibody concentrations.
- Calculate RFI by normalizing the gMFI of each conjugate to the gMFI of the dimmest conjugate (e.g., FITC).
Protocol 2: Quantifying Spillover Spreading Matrix (SSM) Objective: To measure spillover of fluorescence into non-primary detectors, crucial for panel design. Materials: Compensation beads, single-stain antibodies for each fluorophore. Method:
- Stain separate batches of compensation beads with each individual fluorophore-conjugated antibody per manufacturer's instructions.
- Acquire data on a spectral flow cytometer or a conventional cytometer with pre-configured detector arrays.
- Using the instrument's software (e.g., SpectroFlo, FACSDiva), calculate the spillover/spreading matrix.
- The resulting matrix (as in Table 2) shows the percentage of signal from a given fluorophore that is detected in every other channel.
Experimental & Pathway Visualizations
Title: Protocol for Fluorescence Measurement
Title: PE vs. PE-Cy7 Brightness & Spillover Logic
The Scientist's Toolkit
| Reagent/Material | Function in Experiment |
|---|---|
| R-Phycoerythrin (PE)-Conjugated Antibody | Primary reagent for staining; high brightness allows detection of low-abundance antigens. |
| PE-Cy7-Conjugated Antibody | Tandem dye reagent for comparison; enables far-red emission for multiplexing but with lower quantum yield. |
| Compensation Beads (e.g., UltraComp eBeads) | Uniform particles that bind antibodies, used to create single-stain controls for accurate spillover calculation. |
| Flow Cytometry Cells (e.g., PBMCs or Cell Line) | Biological sample expressing target antigens for realistic staining performance evaluation. |
| Flow Cytometer with 488nm/561nm Lasers | Instrument capable of exciting PE and PE-Cy7; spectral analyzers are ideal for precise spillover measurement. |
| Flow Cytometry Analysis Software (e.g., FlowJo, FCS Express) | For calculating gMFI, compensation matrices, and visualizing data spread. |
| Staining Buffer (PBS + BSA + Azide) | Provides an optimal medium for antibody binding while reducing non-specific background. |
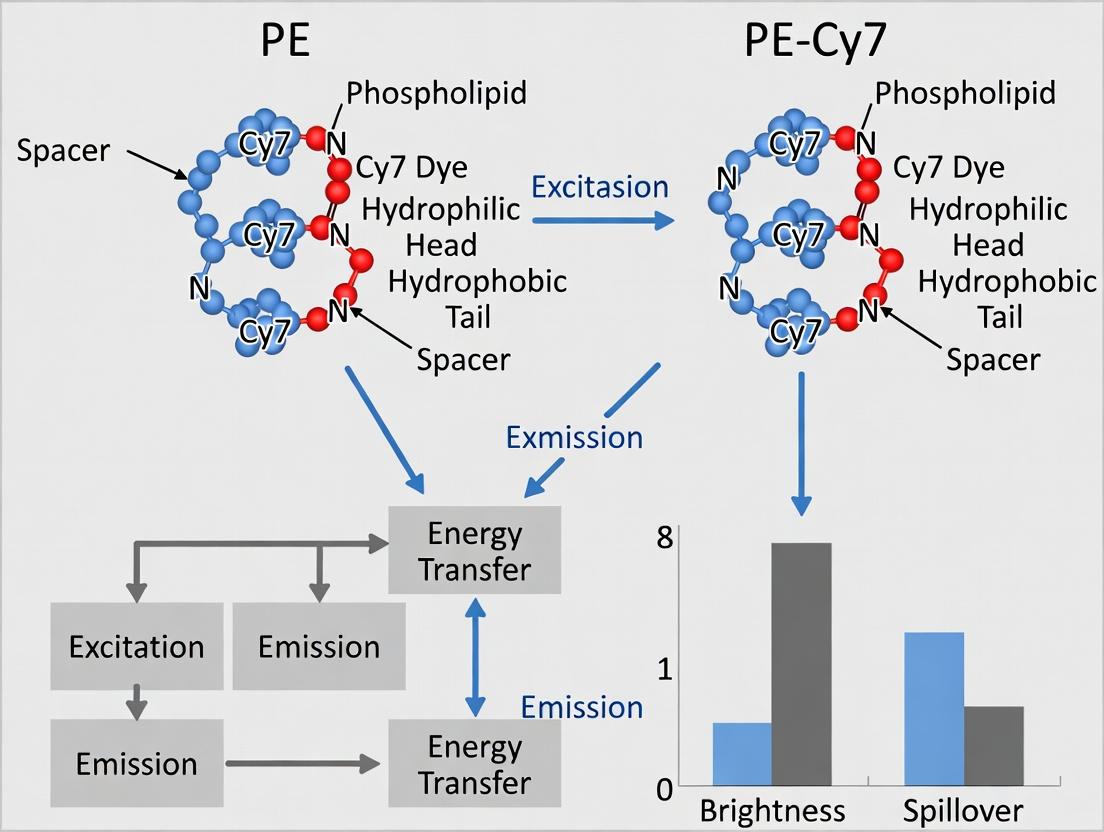
Flow cytometry multiplexing relies on fluorochromes with distinct emission profiles. Phycoerythrin (PE) is exceptionally bright but emits in the yellow region (~575 nm). To utilize its brightness in the far-red channel, tandem dyes like PE-Cy7 are engineered. This conjugate links the PE protein to the small molecule cyanine 7 (Cy7) dye via a chemical bridge. Upon excitation by a blue (488 nm) laser, PE absorbs light and transfers the energy via Förster Resonance Energy Transfer (FRET) to the bound Cy7, which then emits at ~785 nm. This process shifts the emission wavelength, allowing simultaneous detection with PE itself. However, tandem integrity is crucial; breakdown can lead to increased PE-only signal and compromised data.
Comparison Guide: PE-Cy7 vs. Alternative Far-Red Fluorochromes
This guide compares PE-Cy7 with APC-Cy7 (another common tandem) and a standalone far-red dye, Alexa Fluor 700, based on key performance metrics critical for panel design.
Table 1: Performance Comparison of Far-Red Channel Fluorochromes
| Fluorochrome | Excitation Laser (Primary) | Emission Peak (nm) | Relative Brightness* (vs. PE-Cy7) | Spillover (Spread) into APC-Cy7 Channel (780/60 nm) | Tandem Stability (Reported Signal Loss Over Time) |
|---|---|---|---|---|---|
| PE-Cy7 | 488 nm, 532 nm | ~785 nm | 1.0 (Reference) | High (Direct) | Moderate-High (Up to 20% in 48h post-staining) |
| APC-Cy7 | 633 nm, 640 nm | ~785 nm | ~0.8 - 1.2 | N/A (Same channel) | Low-Moderate (Typically <10% in 48h) |
| Alexa Fluor 700 | 633 nm, 640 nm | ~719 nm | ~0.5 - 0.7 | Very Low | Excellent (Non-tandem, stable) |
Brightness is a product of extinction coefficient and quantum yield, approximated from cited literature for representative antibodies on common cell types (e.g., murine splenocytes). Actual values depend on instrument configuration and antibody clone. *Measured as median fluorescence intensity (MFI) increase in the APC-Cy7 channel when the fluorochrome is brightly expressed.
Key Findings: PE-Cy7 offers superior brightness when using a 488 nm laser but introduces significant spillover into the APC-Cy7 detector due to their near-identical emission maxima. APC-Cy7, excited by red lasers, is a comparable alternative but may show less spillover from PE-Cy7 due to lack of direct PE signal. Alexa Fluor 700 is spectrally distinct and stable but generally dimmer. The tandem instability of PE-Cy7 is a documented limitation, leading to increased PE-only emission and reduced Cy7 signal over time.
Experimental Protocol for Assessing Tandem Dye Performance
Objective: To quantify the brightness and spillover of PE-Cy7-conjugated antibodies compared to APC-Cy7 and Alexa Fluor 700 conjugates.
- Sample Preparation: Stain identical aliquots of fresh human PBMCs or murine splenocytes with titrated amounts of anti-CD8 antibodies conjugated to PE-Cy7, APC-Cy7, and Alexa Fluor 700. Include unstained and single-stained controls for compensation.
- Instrument Setup: Use a flow cytometer equipped with 488 nm and 640 nm lasers. Configure detectors: 575/26 nm bandpass (BP) for PE, 660/20 nm BP for APC/Alexa Fluor 700, and 780/60 nm BP for Cy7 dyes.
- Acquisition: Acquire a minimum of 10,000 viable lymphocyte events per sample. Record median fluorescence intensity (MFI) in all relevant channels.
- Brightness Analysis: For each conjugate, plot staining index (SI = [MFIpositive - MFInegative] / [2 * SD_negative]) against antibody titer to determine optimal staining and compare brightness at saturation.
- Spillover Measurement: From the single-stained PE-Cy7 sample, measure the MFI in the 780/60 nm (APC-Cy7) and 660/20 nm (APC) channels. Calculate spillover spreading coefficients (SSC) as per the flow cytometry standardization guidelines.
- Stability Test: Analyze stained samples immediately after preparation and after 24-48 hours of storage at 4°C in the dark. Compare the MFI ratio in the Cy7 channel versus the PE channel to assess tandem degradation.
Visualizing FRET in PE-Cy7 Tandem Dyes
Diagram 1: FRET Mechanism in PE-Cy7 Conjugate
The Scientist's Toolkit: Essential Reagents for Tandem Dye Experiments
| Reagent / Material | Function in Experiment |
|---|---|
| UltraComp eBeads or Similar | Compensation beads for creating single-color controls to calculate accurate spillover matrix on the flow cytometer. |
| Fresh, Viable Cell Sample (e.g., PBMCs) | Provides a biologically relevant substrate with low autofluorescence for accurate brightness comparisons. |
| Titrated Antibody Panels | Allows determination of optimal staining concentration and prevents artifacts from over-saturation when assessing brightness. |
| Flow Cytometry Staining Buffer (with Protein) | Maintains cell viability and prevents non-specific antibody binding during staining and storage. |
| Cell Viability Dye (e.g., Fixable Viability Stain) | Permits gating on live cells, ensuring MFI measurements are not skewed by dead cell autofluorescence. |
| Parafilm or Plate Sealer | For securing stained samples during incubation to prevent evaporation and ensure consistent staining. |
| Flow Cytometer with 488nm & 640nm Lasers | Essential for exciting both PE-based and APC-based tandems to perform a direct comparison. |
| Reference Standard Beads (e.g., Rainbow Beads) | Used for daily instrument performance tracking and quality control, ensuring day-to-day data comparability. |
This comparison guide is framed within a broader thesis investigating the relative brightness and spillover characteristics of Phycoerythrin (PE) and its tandem dye derivative, PE-Cy7. Understanding the distinct spectral properties of these two widely used fluorophores is critical for multicolor panel design in flow cytometry, particularly in high-parameter immunophenotyping and drug development research.
Spectral Properties & Quantitative Comparison
Table 1: Core Spectral Characteristics
| Property | PE (R-PE) | PE-Cy7 |
|---|---|---|
| Primary Excitation Max (nm) | 565 | 565 |
| Secondary Excitation | 480-490 nm | 480-490 nm |
| Emission Max (nm) | 575 | 785 |
| Stokes Shift (nm) | ~10 | ~220 |
| Molecular Weight (kDa) | ~240 | ~290 |
| Conjugate Type | Protein | Tandem Dye |
Table 2: Brightness & Spillover Metrics*
| Metric | PE | PE-Cy7 |
|---|---|---|
| Relative Brightness | 100% (Reference) | 40-60% |
| Spillover into FITC (525/50) | Low | Negligible |
| Spillover into PE-Texas Red (615/20) | High | Very High |
| Spillover into APC (660/20) | Low | Moderate-High |
| Spillover into APC-Cy7 (780/60) | Negligible | Very High |
| Photostability | Moderate | Lower |
*Data synthesized from manufacturer datasheets and peer-reviewed publications. Brightness is relative to PE; spillover is detector-specific.
Experimental Protocols for Comparison
Protocol 1: Direct Measurement of Emission Spectra
Objective: Capture full emission profiles of PE and PE-Cy7 under identical excitation. Materials: Spectrofluorometer, monochromatic light source, PBS buffer, antibody conjugates. Method:
- Dilute PE- and PE-Cy7-conjugated antibodies (same specificity) to 1 µg/mL in PBS.
- Set excitation monochromator to 565 nm (2.5 nm bandwidth).
- Scan emission from 570 nm to 850 nm (5 nm bandwidth).
- Record intensity at peak wavelengths (575 nm for PE, 785 nm for PE-Cy7).
- Normalize spectra to peak height for shape comparison or to molecule count for brightness.
Protocol 2: Spillover Spread Measurement (Flow Cytometry)
Objective: Quantify spillover into secondary detectors. Materials: Flow cytometer with standard laser/filter configuration (488-nm laser, 530/30, 585/42, 780/60 filters), compensation beads, single-stained samples. Method:
- Stain compensation beads separately with PE- and PE-Cy7-conjugated antibodies per manufacturer's instructions.
- Acquire PE-stained sample on the flow cytometer.
- Record median fluorescence intensity (MFI) in the PE detector (585/42) and the APC-Cy7 detector (780/60).
- Acquire PE-Cy7-stained sample.
- Record MFI in the APC-Cy7 detector (780/60) and the PE detector (585/42).
- Calculate spillover using the formula:
Spillover (%) = (MFI in Secondary Channel / MFI in Primary Channel) * 100.
Visualizing Spectral Overlap & Spillover
Title: Excitation & Emission Pathways for PE and PE-Cy7
Title: Spillover of PE and PE-Cy7 into Common Flow Cytometry Detectors
The Scientist's Toolkit: Research Reagent Solutions
| Item | Function in PE/PE-Cy7 Comparison |
|---|---|
| Spectrofluorometer | Precisely measures excitation and emission spectra of fluorophore conjugates in solution. |
| Flow Cytometer with 488 nm laser | The standard instrument for exciting PE and PE-Cy7, used for brightness and spillover assays. |
| Compensation Beads | Uniform particles that bind antibodies, used to create single-stained controls for spillover calculation. |
| PE-Conjugated Antibody | The reference standard for brightness (e.g., anti-CD4 PE). |
| PE-Cy7-Conjugated Antibody | The tandem dye subject for comparison (e.g., anti-CD8 PE-Cy7). |
| Bench-top Centrifuge | For pelleting cells or beads during staining protocols. |
| Phosphate-Buffered Saline (PBS) | Standard dilution and washing buffer for maintaining conjugate stability. |
| Flow Cytometry Analysis Software | Required for calculating median fluorescence intensities and compensation matrices. |
PE serves as a benchmark for brightness with minimal spillover into far-red detectors, while PE-Cy7 provides critical access to the near-infrared channel with a significantly larger Stokes shift, albeit with reduced brightness and substantial spillover into the PE-Texas Red and APC detectors. The choice between them hinges on panel configuration, requiring careful spillover management, especially when using PE-Cy7 in conjunction with APC or dyes detected in the 615-660 nm range. This data supports the broader thesis that while PE-Cy7 expands spectral reach, its spillover profile demands more stringent compensation and panel design considerations than its brighter PE counterpart.
Within a broader study comparing PE and PE-Cy7 tandem dyes for flow cytometry, a fundamental understanding of photophysical properties is essential. This guide objectively compares the brightness and spillover characteristics of Phycoerythrin (PE) and its tandem derivative PE-Cy7, focusing on the underlying principles of quantum yield (QY) and molar extinction coefficient (ε). These parameters directly determine a fluorophore's brightness, defined as the product of ε and QY, and influence practical experimental outcomes like spillover and detection sensitivity.
Photophysical Principles: Defining Brightness
A fluorophore's intrinsic brightness is quantified as: Brightness (B) = Molar Extinction Coefficient (ε) × Quantum Yield (QY)
- Molar Extinction Coefficient (ε): Measures how strongly a fluorophore absorbs light at a specific wavelength (units: M⁻¹cm⁻¹). A higher ε means more efficient photon capture.
- Quantum Yield (QY): The efficiency of converting absorbed photons into emitted photons. It is a unitless ratio between 0 and 1.
Superior brightness enhances the signal-to-noise ratio, enabling better detection of low-abundance targets.
Comparative Performance Data
The following table summarizes key photophysical and experimental performance metrics for PE, PE-Cy7, and common alternatives like FITC and APC.
Table 1: Fluorophore Photophysical Properties & Performance Comparison
| Fluorophore | Primary Excitation (nm) | Primary Emission (nm) | Molar Extinction Coefficient (ε, M⁻¹cm⁻¹) | Quantum Yield (QY) | Relative Brightness (ε × QY) | Relative Spillover Potential (into common neighboring channels) |
|---|---|---|---|---|---|---|
| PE | 496, 565 | 575 | ~1.96 × 10⁶ | ~0.84 | ~1.65 × 10⁶ (Very High) | Moderate-High (into PE-Cy5.5, PE-Cy7 detectors) |
| PE-Cy7 | 496, 565 | 767 | ~1.96 × 10⁶ (from PE) | ~0.10 - 0.30 | ~0.20 - 0.59 × 10⁶ (Reduced) | Very High (into APC-Cy7 detector; also susceptible to acceptor direct excitation) |
| FITC | 495 | 519 | ~0.68 × 10⁶ | ~0.79 | ~0.54 × 10⁶ | Low-Moderate |
| APC | 650 | 660 | ~0.70 × 10⁶ | ~0.68 | ~0.48 × 10⁶ | Moderate (into APC-Cy7 detector) |
Key Takeaway: PE's exceptional brightness stems from its extremely high ε (from its large protein structure with many bilin chromophores) and a near-unity QY. In PE-Cy7, energy transfer from PE to Cy7 is inefficient, resulting in a significantly lower effective QY and thus lower overall brightness, despite retaining PE's high absorption.
Experimental Protocol: Measuring Brightness and Spillover
This protocol outlines a standard flow cytometry experiment to compare brightness and spillover empirically.
Aim: To quantify the staining index and spillover spreading matrix for PE- and PE-Cy7-conjugated antibodies against a common cellular target.
Materials:
- Cells expressing a target antigen of known, consistent density.
- Titrated amounts of conjugated antibodies: PE-anti-target, PE-Cy7-anti-target, and appropriate isotype controls.
- Flow cytometer with lasers and filters configured for PE (e.g., 561nm laser, 585/15 nm BP) and PE-Cy7 (e.g., 561nm laser, 780/60 nm BP).
- Compensation beads.
Method:
- Staining: Stain separate cell aliquots with saturating concentrations of the PE- and PE-Cy7-conjugated antibodies. Include unstained and isotype controls.
- Data Acquisition: Acquire data on a flow cytometer, ensuring voltages are set to place negative populations on-scale for all detectors.
- Brightness Analysis: For each fluorophore, calculate the Staining Index:
(Median Positive Signal - Median Negative Signal) / (2 × SD of Negative Signal). Compare indices at identical antibody:antigen ratios. - Spillover Measurement: Using single-stained compensation beads, record the median fluorescence intensity (MFI) in all detectors. Calculate the Spillover Spread Matrix (in units of coefficient of determination, R²) to quantify spreading error into non-primary channels, particularly from PE-Cy7 into the APC-Cy7 detector.
Visualization of Energy Transfer and Spillover
Diagram 1: PE vs PE-Cy7 Energy Transfer Pathways
Title: Energy transfer pathways in PE and PE-Cy7
Diagram 2: Experimental Spillover Comparison Workflow
Title: Experimental workflow for brightness and spillover comparison
The Scientist's Toolkit: Essential Research Reagents & Materials
Table 2: Key Reagents and Materials for PE/PE-Cy7 Experiments
| Item | Function in Experiment |
|---|---|
| PE-conjugated Antibody | Primary staining reagent. High brightness enables sensitive detection of target antigens. |
| PE-Cy7-conjugated Antibody | Tandem dye reagent for multiplexing. Allows excitation with common blue/green lasers but emits in the far-red. |
| Compensation Beads | Particles that bind antibodies uniformly, used to calculate spillover coefficients and set instrument compensation. |
| Cell Line with Known Antigen Density | Provides a consistent biological model for quantitative comparison of fluorophore performance. |
| Flow Cytometer with 488/561nm & 633/640nm Lasers | Instrument must have appropriate lasers to excite PE/PE-Cy7 and detectors (e.g., 585/15, 780/60) to capture their emission. |
| Fluorophore Molar Quantification Kit | (For advanced study) Accurately determines the degree of labeling (DOL) - the number of fluorophores per antibody - critical for precise brightness comparison. |
PE's superior brightness is a direct consequence of its outstanding molar extinction coefficient and near-perfect quantum yield. While the PE-Cy7 tandem dye extends the utility of PE's absorption into the infrared, it does so at a significant cost to overall brightness due to inefficient FRET. This lower effective QY, coupled with increased susceptibility to spillover (especially into APC-Cy7) and acceptor bleach, makes PE-Cy7 a less bright but multiplexing-essential tool. Researchers must balance the need for high sensitivity (favoring PE) against the requirements for spectral multiplexing (which may require PE-Cy7), carefully applying compensation and considering spillover spreading in panel design.
This guide is framed within ongoing research comparing the brightness and spillover characteristics of Phycoerythrin (PE) and its tandem conjugate PE-Cy7. A core trade-off exists: PE is exceptionally bright but demonstrates minimal spillover into distant detectors, while PE-Cy7 is dimmer but exhibits significant spillover into the Cy7/Alexa Fluor 700 detection channel. This comparison provides objective performance data and methodologies for researchers making informed fluorophore selections.
Key Performance Comparison
Table 1: Spectral Properties & Spillover Comparison
| Property | PE (R-PE) | PE-Cy7 Tandem |
|---|---|---|
| Excitation Laser | 488 nm, 532 nm, 561 nm | 488 nm, 532 nm, 561 nm |
| Primary Emission Peak | ~575 nm | ~785 nm |
| Brightness (Relative to FITC) | Very High (~500x) | Moderate (~25% of PE) |
| Major Spillover Channel | PE-Texas Red (∼575/26) | Cy7/A700 (∼780/60) |
| Spillover Severity (Typical) | Low to Moderate | Very High |
| Key Advantage | Maximum Signal Detection | Far-Red Multiplexing |
| Key Limitation | Limits Orange/Yellow Channels | High Spillover Requires Compensation |
Table 2: Experimental Spillover Spread Values (Representative Data) Instrument: 3-Laser Flow Cytometer (488nm, 561nm, 640nm)
| Fluorophore Detected | Spillover into PE-TxRed (615/20) | Spillover into Cy7 (780/60) |
|---|---|---|
| PE | N/A (Self) | 0.5% |
| PE-Cy7 | 15% | N/A (Self) |
Experimental Protocols for Comparison
Protocol 1: Measuring Spillover Spread
Objective: Quantify spillover coefficients for single-stained controls. Materials: Compensation beads, PE-conjugated antibody, PE-Cy7-conjugated antibody, staining buffer. Method:
- Incubate separate aliquots of compensation beads with each antibody per manufacturer instructions.
- Wash beads and acquire data on a flow cytometer with standard filter configurations.
- For the PE-stained sample, measure the median fluorescence intensity (MFI) in the PE detector (e.g., 576/26) and the spillover MFI in the PE-Texas Red (615/20) and Cy7 (780/60) detectors.
- For the PE-Cy7-stained sample, measure MFI in the Cy7 detector (780/60) and spillover MFI in the PE-Texas Red and PE detectors.
- Calculate spillover percentage: (MFIspillover – MFInegative) / (MFIprimary – MFInegative) * 100%.
Protocol 2: Assessing Signal-to-Noise Ratio
Objective: Compare brightness on a low-antigen-density cell population. Method:
- Stain cells with titrated amounts of antibodies conjugated to PE or PE-Cy7 against a low-expression surface marker.
- Acquire data and gate on the target population.
- Calculate the Staining Index: (MFIpositive – MFInegative) / (2 * SD_negative).
- Compare the maximum Staining Index achieved by each fluorophore.
Visualizing the Energy Transfer & Spillover
Title: FRET Mechanism and Spillover Source in PE vs PE-Cy7
Title: Experimental Workflow for Fluorophore Comparison
The Scientist's Toolkit: Research Reagent Solutions
Table 3: Essential Materials for Fluorophore Performance Testing
| Item | Function in Experiment |
|---|---|
| UltraComp eBeads / Compensation Beads | Provide consistent, antigen-negative & positive particles for instrument compensation and spillover calculation. |
| PE-conjugated Antibody (Clone-matched) | Serves as the high-brightness, minimal far-red spillover reference standard. |
| PE-Cy7-conjugated Antibody (Clone-matched) | Serves as the tandem fluorophore with expected high spillover into acceptor channel. |
| Flow Cytometry Staining Buffer (with BSA) | Provides consistent protein background to minimize non-specific antibody binding. |
| High-Fidelity Flow Cytometer | Instrument with standardized optical filters and calibrated lasers for reproducible MFI measurement. |
| Single-Cell Suspension (Relevant Cell Line) | Biological sample for validating performance in a true cellular context. |
| Fluorophore Compensation Software | Required to calculate and apply spillover (compensation) matrices from single-stain controls. |
Strategic Application: Integrating PE and PE-Cy7 into High-Parameter Panels
Within the broader research on fluorophore brightness and spillover, a key operational thesis is that optimal panel design requires matching fluorophore brightness to antigen density. Phycoerythrin (PE), with its high intrinsic brightness, is ideal for detecting low-density antigens. Conversely, the tandem dye PE-Cy7, while dimmer due to energy transfer efficiency, is suitable for high-density antigens where signal intensity is less limiting, thereby minimizing spillover spreading into other detectors.
Comparative Performance Data
The following data, compiled from recent publications and manufacturer specifications, supports this design philosophy.
Table 1: Photophysical Properties and Performance Comparison
| Property | PE | PE-Cy7 | Implication for Panel Design |
|---|---|---|---|
| Excitation Max (nm) | 496, 565 | 496, 565 | Compatible with 488nm and 561nm lasers. |
| Emission Max (nm) | 575 | 785 | PE-Cy7 emits in the far-red. |
| Relative Brightness | ~1200 | ~500 | PE is >2x brighter than PE-Cy7. |
| Spillover Spreading | Moderate (into PE-TexasRed, PerCP) | High (into BV711, APC-Cy7) | PE-Cy7 requires more compensation and impacts far-red detectors. |
| Photostability | High | Moderate | PE-Cy7 is more prone to degradation. |
| Recommended Use | Low-density antigens (e.g., cytokines, transcription factors) | High-density antigens (e.g., CD4, CD8) | Matches signal abundance to fluorophore output. |
Table 2: Experimental Signal-to-Noise Ratio (SNR) Comparison on Antigens of Varying Density
Experiment: Staining of human PBMCs with antibodies conjugated to PE or PE-Cy7 against CD3 (high density) and CD25 (low density). Data is median fluorescence intensity (MFI) minus unstained control MFI.
| Target (Density) | Fluorophore | Sample MFI | Unstained MFI | SNR |
|---|---|---|---|---|
| CD3 (High) | PE | 185,000 | 500 | 369 |
| CD3 (High) | PE-Cy7 | 78,000 | 80 | 974 |
| CD25 (Low) | PE | 8,200 | 500 | 15.4 |
| CD25 (Low) | PE-Cy7 | 1,150 | 80 | 13.4 |
Key Finding: For high-density CD3, PE-Cy7 provides a superior SNR due to lower background in its detection channel. For low-density CD25, the high brightness of PE yields a significantly better SNR.
Detailed Experimental Protocols
Protocol 1: Assessing Fluorophore Brightness and Spillover
- Bead Preparation: Use ultra-compensation beads. Aliquot separate tubes for each fluorophore conjugate (anti-Ig antibody conjugated to PE and PE-Cy7) and an unstained control.
- Staining: Add 1 drop of beads to each tube. Add 0.5 µl of each conjugate to its respective tube. Incubate for 15 minutes at room temperature, protected from light.
- Acquisition: Resuspend beads in PBS and acquire data on a flow cytometer equipped with 488nm and 640nm lasers. Use a low flow rate.
- Analysis: Record the median fluorescence intensity (MFI) in all detectors for each singly stained tube. Calculate spillover spreading coefficients (SSC) into non-primary detectors.
Protocol 2: Validating Antigen Density Matching in Cell Assays
- Sample Prep: Isolate human PBMCs using density gradient centrifugation.
- Staining Panel:
- Tube A: CD3-PE-Cy7 (high-density target) + CD25-PE (low-density target).
- Tube B: CD3-PE + CD25-PE-Cy7 (inverse pairing).
- Include viability dye and Fc block.
- Staining: Add antibodies to 1x10^6 cells per tube. Incubate for 30 minutes at 4°C in the dark. Wash twice with FACS buffer.
- Acquisition: Acquire on a calibrated flow cytometer, collecting at least 50,000 lymphocytes.
- Analysis: Gate on live, single lymphocytes. Compare the SNR and separation index (SI) for each antigen-fluorophore pair.
Visualizations
Title: PE vs PE-Cy7 Energy Transfer and Application Logic
Title: Panel Design Decision Workflow Based on Antigen Density
The Scientist's Toolkit: Research Reagent Solutions
| Item | Function in Panel Design & Validation |
|---|---|
| UltraComp eBeads / Compensation Beads | Provide consistent, negative and positive controls for calculating fluorescence compensation and spillover spreading coefficients. |
| Cell Staining Buffer (with Fc Block) | Reduces non-specific antibody binding via Fc receptors, improving signal-to-noise ratio, critical for low-density antigen detection. |
| Viability Dye (e.g., Fixable Viability Stain) | Distinguishes live from dead cells; dead cells exhibit high autofluorescence and non-specific binding, which confounds dim signals. |
| PE Conjugate (Bright) | Optimal antibody conjugate for detecting low-abundance targets (e.g., IL-2, phosphorylated proteins). |
| PE-Cy7 Conjugate (Dim) | Optimal antibody conjugate for high-abundance targets (e.g., CD45, CD19) to minimize spillover into critical channels. |
| Pre-conjugated Antibody Panels | Validated, off-the-shelf panels that exemplify good brightness/density matching and low spillover; useful as a reference. |
| Flow Cytometry Setup & Tracking Beads | Allow for daily instrument performance tracking (laser alignment, PMT voltages) to ensure reproducible brightness measurements. |
Thesis Context: PE vs. PE-Cy7 Brightness and Spillover
Within the broader research comparing PE (Phycoerythrin) and PE-Cy7 tandem dye, optimal instrument configuration is a critical, yet often overlooked, variable. This guide objectively compares configurations for maximizing signal detection for both fluorochromes simultaneously, a common challenge in polychromatic panels for immunophenotyping and drug development assays.
Comparative Laser & Filter Setup Analysis
The core challenge lies in the distinct excitation and emission profiles of PE and PE-Cy7. PE is best excited by the 488 nm (blue) or 532 nm (green) lasers and emits at ~575 nm. PE-Cy7, a tandem dye, uses PE as a donor to excite the Cy7 acceptor; it is excited by the same lasers as PE but emits far-red (~785 nm). Efficient detection requires maximizing PE-Cy7 tandem efficiency while minimizing PE spillover into the PE-Cy7 detector.
Table 1: Recommended Laser & Filter Configuration Comparison
| Configuration Parameter | Optimal Setup for PE & PE-Cy7 | Common Suboptimal Alternative | Performance Impact |
|---|---|---|---|
| Primary Excitation Laser | 561 nm (yellow-green) or 532 nm (green) | 488 nm (blue) | 561/532 nm provides superior excitation for PE, improving PE-Cy7 donor brightness and tandem efficiency. PE brightness increases 1.5-2x vs. 488 nm. |
| PE Emission Filter | 585/40 nm (or 582/15 nm) | 575/25 nm | A slightly broader or optimally centered filter captures maximal PE emission. 585/40 is standard. |
| PE-Cy7 Emission Filter | 780/60 nm (or 776/23 nm) | 755 LP (Long Pass) | A bandpass (780/60) is superior to a long pass; it reduces contamination from PE emission tail and near-IR autofluorescence. |
| Beam Path Alignment | Co-linear, spatially separated | Co-linear, overlapping | Precise alignment for both lasers on the same stream point is critical for tandem dye efficiency. |
| Detector Type | High-sensitivity PMT or APD for PE-Cy7 | Standard PMT | APDs in the far-red increase PE-Cy7 signal-to-noise, crucial for dim populations. |
Table 2: Experimental Brightness & Spillover Data (Relative Values)
| Fluorochrome | Laser (488 nm) Brightness Index | Laser (561 nm) Brightness Index | Spillover (PE into PE-Cy7 Detector) 488 nm Config | Spillover (PE into PE-Cy7 Detector) 561 nm Config |
|---|---|---|---|---|
| PE | 100 | 165 - 200 | 0.5 - 1.2% | 0.8 - 1.5%* |
| PE-Cy7 | 100 | 120 - 150 | - | - |
*Note: While absolute spillover may increase with 561 nm excitation due to brighter PE, the signal-to-spillover ratio improves significantly, and careful filter selection mitigates this.
Experimental Protocols for Configuration Validation
Protocol 1: Measuring Fluorochrome Brightness Index
Objective: Quantify the impact of laser choice on PE and PE-Cy7 apparent brightness. Materials: Single-stained control beads or cells (e.g., Capture Beads) conjugated with PE and PE-Cy7. Method:
- Acquire PE sample on a cytometer equipped with both 488 nm and 561 nm lasers, using standard PE (585/40) and PE-Cy7 (780/60) filters.
- Record the median fluorescence intensity (MFI) for each fluorochrome under each laser line, ensuring voltage/amplifier gain settings are identical for the relevant detector across laser setups.
- Calculate Brightness Index:
(MFI with test laser - MFI unstained) / (MFI with 488 nm - MFI unstained). Use 488 nm as the reference (Index = 100). Key Analysis: A Brightness Index >100 indicates superior excitation efficiency.
Protocol 2: Spillover Spreading Matrix (SSM) Measurement
Objective: Precisely quantify PE spillover into the PE-Cy7 detector under different configurations. Materials: Singly stained PE control sample. Method:
- Using the same detector voltage/gain, acquire the PE sample with the 561 nm laser and then the 488 nm laser.
- Record the median fluorescence intensity in the PE-Cy7 detector (780/60 nm).
- Calculate spillover coefficient:
MFI(PE-Cy7 detector from PE stain) / MFI(PE detector from PE stain). - Repeat with a PE-Cy7 single stain to check for potential reverse spillover (typically negligible). Key Analysis: Compare coefficients. The configuration yielding the highest PE brightness with an acceptable, compensatable spillover (<2%) is optimal.
Visualization of Configuration Logic
Diagram Title: Logic for Optimal PE & PE-Cy7 Configuration
Diagram Title: Experimental Validation Workflow
The Scientist's Toolkit: Research Reagent Solutions
Table 3: Essential Materials for Configuration Testing
| Item | Function in This Context |
|---|---|
| UltraComp eBeads or Similar | Precisely defined compensation beads for creating consistent single-stained controls for spillover matrix calculation. |
| Anti-CD Antibody Conjugates (PE & PE-Cy7) | For staining cell samples (e.g., PBMCs) to validate configurations in a biologically relevant matrix. |
| PE & PE-Cy7 Standardized | Lyophilized or stabilized fluorochrome preparations for instrument QC and laser alignment verification. |
| Flow Cytometry Setup Beads (e.g., CS&T) | For daily instrument performance tracking, ensuring laser power and detector gains are stable between tests. |
| High-Quality Sheath Fluid & 0.1 µm Filter | Ensures low background noise, critical for detecting small differences in spillover and far-red signal. |
This guide, framed within broader research comparing PE and PE-Cy7 fluorophore brightness and spillover characteristics, provides an objective comparison of best practices for establishing effective single-stained compensation controls. Accurate compensation is critical for multicolor flow cytometry, and the spectral properties of PE and PE-Cy7 present unique challenges and opportunities.
Comparison of Key Spectral Properties
Table 1: Fluorophore Brightness & Spectral Profile Comparison
| Property | PE (R-PHYCOERYTHRIN) | PE-Cy7 (TANDEM DYE) | Impact on Single-Stained Control |
|---|---|---|---|
| Peak Excitation (nm) | 496, 565 | 496, 565 | Identical laser requirements (488 nm or 561 nm). |
| Peak Emission (nm) | 578 | 785 | PE-Cy7 requires a far-red detector (e.g., 780/60). |
| Relative Brightness | Very High | High (but lower than PE) | PE control must be on-scale; PE-Cy7 may require higher PMT voltage. |
| Spillover (Spread) into... | PE-Cy7 detector (significant) | PE detector (minimal) | PE single-strain must correct for PE-Cy7 spillover. |
| Tandem Dye Stability | N/A | Moderate (can degrade) | Check PE-Cy7 control regularly for increased PE signal. |
Table 2: Experimental Data from Spillover Spreading Matrix (SSM) Analysis
| Single-Stained Control | Median Intensity in PE Channel (585/40) | Median Intensity in PE-Cy7 Channel (780/60) | Calculated Spillover Coefficient |
|---|---|---|---|
| Bright PE Conjugate (CD8) | 125,000 | 950 | 0.0076 (PE → PE-Cy7) |
| PE-Cy7 Conjugate (CD4) | 850 | 45,000 | 0.0189 (PE-Cy7 → PE) |
| Degraded PE-Cy7 Conjugate | 12,500 | 38,000 | 0.329 (High unwanted PE signal) |
Experimental Protocols for Control Setup
Protocol 1: Preparation of Optimal Single-Stained Controls
- Material Selection: Use biological particles (cells or beads) with high antigen density for the target marker.
- Conjugate Titration: Titrate the antibody to ensure the single-stained control is bright but not saturated. A saturated signal compresses spillover values.
- Staining Volume & Wash: Keep staining volume and wash steps consistent across all control and experimental samples.
- Fixation: If required, fix samples after staining, as fixation can alter fluorescence intensity.
Protocol 2: Validating PE-Cy7 Tandem Integrity
- Parallel Analysis: Split a PE-Cy7 single-stained sample into two tubes.
- Acquisition: Acquire one tube immediately. Store the other protected from light at 4°C for 24-48 hours.
- Comparison: Re-acquire the stored sample. A significant increase in the PE-channel signal (see Table 2) indicates tandem dye degradation. The control is invalid and must be re-made.
Visualizing Compensation Principles & Workflow
Diagram 1: Workflow for Reliable Compensation
Diagram 2: PE and PE-Cy7 Signal and Spillover Paths
The Scientist's Toolkit: Research Reagent Solutions
Table 3: Essential Materials for Control Experiments
| Item | Function in PE/PE-Cy7 Compensation | Example/Note |
|---|---|---|
| UltraComp eBeads | Capture antibody particles for consistent, antigen-free negative populations and bright positive signals. | Eliminates biological variability for setup. |
| High-Antigen Density Cell Line (e.g., CD4+ Jurkat) | Provides a bright, homogeneous biological positive population for control staining. | More physiologically relevant than beads. |
| Titrated Antibody Stash | Pre-titrated aliquots of PE- and PE-Cy7-conjugated antibodies at optimal concentration. | Ensures consistent, non-saturating signal. |
| Anti-Mouse Igκ Compensation Bead Set | Beads that bind any mouse antibody isotype, enabling controls for any mouse-derived conjugate. | Essential for flexibility in panel design. |
| Cell Fixation Buffer | Stabilizes fluorescence signal post-staining for delayed acquisition. | Can affect spillover; must be consistent. |
| Flow Cytometry Setup & Tracking Beads | Daily calibration beads to standardize instrument settings (PMT voltage) over time. | Critical for reproducing compensation. |
This comparison guide is framed within a broader thesis investigating the relative brightness and spillover characteristics of Phycoerythrin (PE) versus its tandem dye PE-Cy7. The selection between these fluorochromes is critical in multicolor flow cytometry, impacting assay sensitivity, panel design, and data quality in key applications. We provide objective performance comparisons with supporting experimental data.
Comparative Performance Data
The following tables summarize quantitative data from experimental comparisons relevant to immunophenotyping, intracellular staining, and phospho-flow cytometry.
Table 1: Brightness & Signal-to-Noise Comparison (PE vs. PE-Cy7)
| Fluorochrome | Relative Brightness (vs. FITC) | Spreading Error (Into 780/60) | Spillover (Into PerCP-Cy5.5) | Optimal Application Context |
|---|---|---|---|---|
| PE (Ex: 565, Em: 578) | Very High (~12x) | Low | Very Low | Detecting low-abundance surface antigens; high sensitivity required. |
| PE-Cy7 (Ex: 565, Em: 785) | Moderate (~3x) | High | Moderate-High | High-parameter panels where its emission channel is free; not for dim targets. |
Table 2: Application-Specific Performance Metrics
| Application | Key Metric | PE Performance | PE-Cy7 Performance | Recommended Alternative (e.g., APC-Cy7) |
|---|---|---|---|---|
| Immunophenotyping | Resolution of dim populations (e.g., Tregs) | Excellent (High S/N) | Poor for dim markers | PE preferred for CD127, CD25. |
| Intracellular Cytokines | Detection of weak cytokine signals | Superior brightness enables clear positivity. | Risk of signal loss; higher background. | PE for TNF-α, IL-2. |
| Phospho-Flow (p-ERK, p-STAT5) | Mean Fluorescence Intensity (MFI) shift detection | Large, unambiguous shifts. | Smaller shifts; lower sensitivity. | PE-conjugated antibodies provide best dynamic range. |
Experimental Protocols
Protocol 1: Direct Comparison of PE vs. PE-Cy7 Brightness
Objective: Quantify the staining index of identical targets labeled with PE versus PE-Cy7 conjugates. Methodology:
- Prepare human PBMCs from healthy donor whole blood using density gradient centrifugation.
- Aliquot identical cell counts into three tubes: (1) Unstained, (2) Anti-CD4 PE, (3) Anti-CD4 PE-Cy7. Use the same antibody clone and titer.
- Stain for 30 minutes at 4°C in the dark, wash, and resuspend in buffer.
- Acquire on a calibrated flow cytometer with consistent PMT voltages.
- Calculate the Staining Index (SI): (Median MFI of positive population - Median MFI of negative) / (2 * SD of negative population).
Protocol 2: Spillover Spreading Impact in a 10-Color Panel
Objective: Measure the spreading error caused by PE-Cy7 into adjacent detectors (e.g., APC-Cy7) compared to PE. Methodology:
- Design a panel including a bright marker conjugated to PE-Cy7 (e.g., CD3) and a dim marker in the potentially affected spillover channel (e.g., CCR7-APC-Cy7).
- Prepare two identical aliquots of PBMCs. Stain one with the full panel. Stain the other with an identical panel but with the bright marker conjugated to PE instead.
- After acquisition, use fluorescence minus one (FMO) controls for the APC-Cy7 channel.
- Quantify the spreading error by comparing the MFI and distribution of the dim population in the APC-Cy7 channel between the two panels using the FMO as reference.
Protocol 3: Phospho-STAT5 Detection Sensitivity
Objective: Compare the dynamic range for detecting phosphorylation shifts using PE- vs. PE-Cy7-conjugated anti-pSTAT5. Methodology:
- Stimulate PBMCs with IL-2 (100 IU/mL) for 15 minutes at 37°C. Include an unstimulated control.
- Immediately fix with pre-warmed 4% paraformaldehyde (10 min, 37°C), then permeabilize with cold 100% methanol (30 min, -20°C).
- Split stimulated and unstimulated samples. Stain one set with anti-pSTAT5(694) PE and the other with anti-pSTAT5(694) PE-Cy7.
- Co-stain with surface markers (e.g., CD4) for gating.
- Acquire and calculate the fold-change in MFI (Stimulated/Unstimulated) within the lymphocyte gate for each fluorochrome.
Visualization: Signaling Pathways and Workflows
Title: Phospho-Flow Cytokine Signaling Pathway (e.g., JAK-STAT)
Title: Experimental Workflow for Phospho-Flow Fluorochrome Comparison
The Scientist's Toolkit: Research Reagent Solutions
| Item | Function in Featured Experiments |
|---|---|
| Pre-coated Anti-CD3/CD28 Beads | Provides consistent, potent T-cell receptor stimulation for phospho-flow assays. |
| Methanol (-20°C, 100%) | A standard permeabilization reagent for intracellular staining of phospho-proteins and transcription factors. |
| Phosflow Fix Buffer I (BD) | Stabilizes phosphorylation states rapidly upon cell fixation, crucial for kinetic experiments. |
| Brefeldin A / Monensin | Protein transport inhibitors used in intracellular cytokine staining to retain cytokines in the Golgi. |
| Fluorochrome-Conjugated Antibodies (Identical Clone) | Critical for direct comparison of fluorochrome performance while keeping epitope binding constant. |
| Compensation Beads (Anti-Mouse/Rat Ig κ) | Used with antibody capture to generate single-color controls for accurate spectral spillover compensation. |
| Viability Dye (e.g., Fixable Viability Stain) | Distinguishes live from dead cells, preventing false-positive staining from compromised cells. |
| RPMI 1640 / Serum-Free Media | Used during stimulation to avoid confounding signals from serum-derived cytokines or factors. |
Thesis Context: PE vs PE-Cy7 Brightness and Spillover in Advanced Systems
This comparison guide is framed within ongoing research into the inherent brightness and spillover characteristics of PE and PE-Cy7 tandem dyes. The expansion from 3-laser (e.g., 488nm, 640nm, 405nm) to 4- and 5-laser configurations introduces additional excitation lines (e.g., 561nm, 355nm UV) that significantly impact the performance and utility of these critical fluorochromes. The core thesis investigates whether the superior theoretical excitation of PE on a 561nm laser justifies its use over PE-Cy7 when considering the latter's known spillover spread and potential instability, especially in high-parameter panels enabled by more lasers.
Performance Comparison: Key Metrics
The following tables summarize experimental data comparing fluorochrome performance across cytometer configurations. Data is synthesized from recent instrument white papers and peer-reviewed methodology studies.
Table 1: Relative Brightness Index (vs. Baseline FITC)
| Fluorochrome | 3-Laser (488/640/405) | 4-Laser (488/561/640/405) | 5-Laser (+355nm UV) |
|---|---|---|---|
| PE (ex: 488/561) | 1000 (on 488) | 1800 (on 561) | 1800 (on 561) |
| PE-Cy7 (ex: 488/561) | 450 (on 488) | 700 (on 561) | 700 (on 561) |
| PerCP-Cy5.5 (ex: 488) | 600 | 600 | 600 |
| APC-Cy7 (ex: 640) | 300 | 300 | 300 |
| BV421 (ex: 405) | 800 | 800 | 800 |
| BUV395 (ex: 355) | N/A | N/A | 1200 |
Note: Values are approximate and normalized for comparison. The 561nm laser provides ~1.8x brighter excitation for PE than the 488nm line.
Table 2: Spillover Spreading Matrix (Key Interactions)
| Spy Channel (Detector) | PE-Cy7 | APC-Cy7 | PerCP-Cy5.5 | BV711 |
|---|---|---|---|---|
| PE (e.g., 575/26) | 40% | <1% | 15% | <1% |
| APC (e.g., 660/20) | 5% | 55% | <1% | 2% |
| PerCP-Cy5.5 (e.g., 695/40) | 25% | 10% | N/A | 8% |
| BV605 (e.g., 615/20) | <1% | <1% | 3% | 35% |
Note: Highlighted values show critical spillover challenges. PE-Cy7 spill into PerCP-Cy5.5 is a major concern on 3-laser systems but can be mitigated with 561nm excitation and careful panel design on 4/5-laser systems.
Experimental Protocols for Key Comparisons
Protocol 1: Measuring Laser-Specific Fluorochrome Brightness
- Preparation: Prepare single-stain samples using ultra-compensation beads conjugated to each fluorochrome of interest (PE, PE-Cy7, APC, etc.).
- Instrument Setup: Configure the cytometer to log data for all relevant lasers and detectors. On a 4-laser system, ensure the 561nm laser is active.
- Acquisition: Acquire each single-stain sample separately.
- Analysis: Record the median fluorescence intensity (MFI) for each fluorochrome on its primary detector. Normalize MFI to a baseline (e.g., FITC on 488nm) to calculate a Relative Brightness Index. Compare PE MFI from the 488nm laser vs. the 561nm laser.
Protocol 2: Quantifying Spillover Spread (Spectral Unmixing Assessment)
- Preparation: Use the same single-stain bead samples from Protocol 1.
- Acquisition: Acquire all samples using identical voltage/amplifier settings in a single experiment.
- Matrix Calculation: Using compensation software, calculate the spillover spreading matrix. The critical value is the percentage of signal from Fluorochrome A that appears in the primary detection channel for Fluorochrome B.
- Validation: Run a multi-stain control (e.g., PE-Cy7 + PerCP-Cy5.5) to validate compensation. High residual spillover indicates a combination prone to error, especially in dim populations.
Visualization: Experimental Workflow & Spectral Overlap
Diagram Title: Workflow for Laser-Specific Fluorochrome Comparison
Diagram Title: Laser Excitation & Spillover Pathways for Key Fluorochromes
The Scientist's Toolkit: Research Reagent Solutions
| Item | Function & Relevance to PE/PE-Cy7 Research |
|---|---|
| UltraComp eBeads | Pre-coated microspheres for accurate single-stain controls. Essential for generating the spillover matrix on any laser configuration. |
| Anti-Mouse Igκ/Negative Control Compensation Beads | Used with directly conjugated antibodies to create custom single-stain controls for any marker, crucial for validating real-world spillover. |
| PE & PE-Cy7 Conjugate Master Kit | A set of identical antibodies conjugated to different fluorochromes. Allows direct, cell-based comparison of brightness and spillover with identical epitope density. |
| Viability Dye (e.g., Fixable Viability Dye eFluor 506) | A dye excitable by the 405nm/UV laser, freeing up the 488/561nm lines for PE/PE-Cy7 detection, showcasing panel design advantage of 4/5-laser systems. |
| Standardized Rainbow Calibration Particles | Particles with multiple fluorescence intensities. Critical for ensuring consistent laser power and detector performance across different cytometer platforms (3 vs. 4 vs. 5 laser). |
| Antibody Stabilizer/Preservative | Particularly important for stabilizing tandem dyes like PE-Cy7 in long-term experiments, a key variable in performance comparison studies. |
Solving Common Issues: Spillover, Tandem Degradation, and Compensation Challenges
Identifying and Correcting Excessive Spillover Spreading (SS) from PE-Cy7
Thesis Context: PE vs. PE-Cy7 Brightness and Spillover Comparison
This comparison guide is situated within a broader research thesis investigating the intrinsic brightness and spillover characteristics of tandem fluorochromes, specifically comparing R-Phycoerythrin (PE) and its tandem conjugate PE-Cy7. PE is renowned for its exceptional brightness but occupies a crowded spectral region. PE-Cy7, while providing a far-red emission ideal for polychromatic panels, is prone to excessive spillover spreading (SS) into other detectors, notably the APC-Cy7/APC-H7 channel, due to its complex energy transfer efficiency and susceptibility to degradation.
Comparative Performance Data
The following table summarizes experimental data comparing the spillover spreading (SS) characteristics of PE and PE-Cy7, alongside a leading alternative, into the APC-Cy7 detector (typically ~780/60 nm). Data is presented as median spillover spreading (SS) coefficient, a metric quantifying the spread of signal into off-target detectors.
Table 1: Spillover Spreading (SS) Coefficient Comparison into APC-Cy7 Channel
| Fluorochrome | Peak Emission (nm) | Median SS Coefficient (%) | Relative Brightness (vs. PE) | Key Factor Influencing SS |
|---|---|---|---|---|
| PE-Cy7 | 785 | 6.8% | ~25% | Tandem degradation, laser-induced damage |
| PE | 575 | 0.1% | 100% (Reference) | Direct excitation, minimal SS |
| APC-Fire 810 | 810 | 0.9% | ~120% (vs. APC) | High Stokes shift, stable tandem |
| Super Bright 786 | 786 | 2.1% | ~180% (vs. PE) | Engineered polymer dye, improved stability |
Experimental Protocols for Cited Data
Protocol 1: Measurement of Spillover Spreading Coefficients
- Single Stain Controls: Prepare individual tubes of compensation beads or cells stained saturatingly with antibodies conjugated solely to PE-Cy7, PE, APC-Fire 810, or Super Bright 786.
- Instrument Setup: Use a cytometer equipped with 561 nm (PE/PE-Cy7) and 640 nm (APC-Fire) lasers. Configure the standard detector for PE-Cy7 (e.g., 780/60 nm) and the APC-Cy7 detector (e.g., 780/60 nm on a different path).
- Data Acquisition: Acquire a minimum of 10,000 events for each single-stain control. Ensure the positive population is on-scale.
- Analysis: Using flow cytometry analysis software, create a bi-exponential plot of the target fluorochrome's detector (e.g., PE-Cy7) vs. the affected detector (APC-Cy7). The Spillover Spreading (SS) coefficient is calculated as the median fluorescence intensity (MFI) in the APC-Cy7 detector divided by the MFI in the primary PE-Cy7 detector, expressed as a percentage.
Protocol 2: Assessment of Tandem Dye Stability
- Sample Preparation: Aliquot identical PE-Cy7 and alternative (e.g., APC-Fire 810) stained samples.
- Stress Induction: Expose one set of aliquots to prolonged illumination (e.g., 1-hour on a benchtop under ambient light) or repeated freeze-thaw cycles (3x).
- Data Acquisition & Comparison: Acquire data from stressed and unstressed controls using Protocol 1. A significant increase in the SS coefficient for the stressed PE-Cy7 sample indicates tandem degradation and increased donor (PE) emission.
Experimental Workflow and Pathway Diagrams
Diagram 1: PE-Cy7 Energy Transfer and SS Causes
Diagram 2: Workflow for Identifying and Correcting SS
The Scientist's Toolkit: Key Research Reagent Solutions
Table 2: Essential Materials for Spillover Spreading Analysis
| Item | Function & Relevance to SS |
|---|---|
| UltraComp eBeads / Compensation Beads | Provide a consistent, negative and positive signal for precise calculation of compensation and SS coefficients. Critical for setting baselines. |
| Antibodies Conjugated to Alternative Fluorochromes (e.g., APC-Fire 810, Super Bright 786) | Direct replacements for PE-Cy7 to avoid inherent SS. Offer superior stability and lower spillover. |
| Cell Fixation/Permeabilization Kits (with SS assessment) | Some fixatives accelerate tandem dye degradation. Kits validated for minimal dye impact are essential. |
| Viability Dyes (fixable, far-red) | Allows exclusion of dead cells without interfering with the PE-Cy7/APC-Cy7 spectral window (e.g., Zombie NIR). |
| High-Fidelity Cytometry Setup & Tracking (CS&T) Beads | For daily instrument performance tracking, ensuring laser alignment and detector sensitivity are optimal, which affects SS measurement. |
| Software with Advanced Compensation Algorithms (e.g., SpectroFlo) | Enables accurate calculation of complex spillover matrices and can apply algorithms to correct for residual SS post-acquisition. |
Within a broader thesis comparing PE versus PE-Cy7 on brightness and spillover, understanding the inherent instability of the PE-Cy7 tandem dye is critical. This guide compares the performance of intact versus deteriorated PE-Cy7 and its alternatives.
Causes of Deterioration
PE-Cy7 is a tandem fluorochrome where phycoerythrin (PE) is covalently coupled to the cyanine dye Cy7. Deterioration, often seen as a loss of Cy7 emission (~767 nm) and increased PE emission (~575 nm), is primarily caused by:
- Photobleaching: Exposure to light, especially during storage or sample processing, cleaves the energy transfer bridge.
- Fixation/Processing: Common paraformaldehyde-based fixatives, especially in combination with permeabilization buffers, accelerate tandem breakage.
- pH Extremes: Storage or reaction conditions outside pH 6-9 can degrade the conjugate.
- Heat: Prolonged storage at room temperature or higher increases breakdown rates.
Detection and Performance Comparison
A key detection method is measuring the fluorescence spillover into the PE channel (e.g., 585/40 nm filter) when the conjugate is excited at 488 nm. Intact PE-Cy7 shows minimal spill into PE; deteriorated PE-Cy7 shows significantly increased signal.
Table 1: Performance Comparison of Intact vs. Deteriorated PE-Cy7
| Parameter | Intact PE-Cy7 | Deteriorated PE-Cy7 | Measurement Method |
|---|---|---|---|
| Brightness (Cy7 channel) | High | Severely Reduced | Median Fluorescence Intensity (MFI) of labeled beads/cells. |
| PE Spillover (SPE,Cy7) | Low (e.g., 0.3%) | High (e.g., 25%) | Calculated from compensation controls using 488 nm laser. |
| Effective Stain Index | High | Low | (MFIpositive - MFInegative) / (2 * SDnegative). |
| Compensation Requirement | Standard | Greatly Increased, Often Unstable | Matrix calculation in flow cytometry software. |
Table 2: Comparison of PE-Cy7 to Alternative Near-IR Fluorochromes
| Fluorochrome | Relative Brightness (vs. PE-Cy7) | Spillover into PE Channel | Key Stability Attribute | Best Use Case |
|---|---|---|---|---|
| PE-Cy7 (Intact) | 1.0 (Reference) | Low | N/A | Standard panels with proper handling. |
| APC-Cy7 | ~0.8 | Very Low (Different Laser) | More stable to fixation than PE-Cy7. | Panels using a 640 nm laser; fixation required. |
| Brilliant Violet 785 (BV785) | ~1.5 - 2.0 | None (Polymer Dye) | Superior photostability; resistant to fixation. | High-parameter panels with 405 nm laser. |
| Alexa Fluor 750 | ~0.7 | None (Organic Dye) | Good photostability and fixation tolerance. | Alternative when tandem instability is prohibitive. |
Experimental Protocols
Protocol 1: Inducing and Detecting PE-Cy7 Deterioration
- Objective: To artificially deteriorate PE-Cy7 and measure its increased spillover into the PE detector.
- Materials: PE-Cy7-conjugated antibody, 4% Paraformaldehyde (PFA), PBS, flow cytometer with 488 nm and 785/60 nm (Cy7) and 585/40 nm (PE) filters.
- Method:
- Aliquot the antibody into two tubes.
- Test: Incubate one aliquot with 1% PFA (final concentration) for 1 hour at 37°C.
- Control: Incubate the other with PBS under the same conditions.
- Wash both aliquots with PBS using a centrifugal filter unit.
- Label compensation beads or low-autofluorescence cells with the treated and control antibodies at identical concentrations.
- Acquire on a flow cytometer. Use the 488 nm laser and collect fluorescence in the PE (585/40 nm) and Cy7 (785/60 nm) channels.
- Calculate the spillover coefficient SPE,Cy7 for both samples.
Protocol 2: Comparing Tandem Dye Stability Over Time
- Objective: To track the brightness and spillover of PE-Cy7 vs. APC-Cy7 vs. BV785 under stressed storage.
- Materials: Antibodies conjugated to PE-Cy7, APC-Cy7, and BV785. Transparent vial for light exposure.
- Method:
- Aliquot each antibody and place one set in constant ambient light on a lab bench and a duplicate set in the dark at 4°C.
- At weekly intervals for one month, use each aliquot to stain an identical number of target cells or beads.
- Acquire samples immediately on the same cytometer settings.
- Record the MFI in the primary emission channel and the MFI in the donor emission channel (PE for PE-Cy7, APC for APC-Cy7).
- Plot normalized MFI (Week N / Week 0) over time for each condition.
Visualization: Deterioration Mechanism and Detection
Title: Mechanism of PE-Cy7 Tandem Deterioration and Signal Change
Title: Experimental Workflow to Detect PE-Cy7 Deterioration
The Scientist's Toolkit: Research Reagent Solutions
| Item | Function/Benefit in PE-Cy7 Research |
|---|---|
| UltraComp eBeads / Compensation Beads | Provide uniform, autofluorescence-negative particles for accurate spillover calculation and instrument compensation. |
| Antibody Stabilizer (e.g., PBS-azide + protein) | Preserves conjugate integrity during long-term 4°C storage, slowing spontaneous deterioration. |
| Light-Blocking Vials/Containers | Prevents photobleaching during storage and experimental procedures. |
| Paraformaldehyde (PFA) - Fresh/Made Weekly | Ensures consistent fixation conditions; old or acidic PFA drastically accelerates tandem breakdown. |
| Centrifugal Filter Units (100 kDa MWCO) | Allows for buffer exchange to remove fixatives or storage buffers from antibody stocks post-stress tests. |
| Laser-Powered Flow Cytometer | Equipped with 488 nm (for PE excitation), 561-640 nm (for FRET bridge), and 785/60 nm filters to measure intact versus broken tandem signals. |
| Single Stain Controls | Essential for recalculating compensation matrices when using PE-Cy7, as spillover values can change between experiments due to dye lot or deterioration. |
Prevention Strategies
- Storage: Aliquot and store at 4°C in the dark; avoid freeze-thaw cycles. For long-term storage (>6 months), consider -80°C in stabilizing buffer.
- Light Management: Minimize light exposure during staining. Use amber tubes or wrap samples in foil.
- Fixation: If fixation is required, titrate PFA concentration (0.5-1% often sufficient) and incubation time. Post-fix, store samples at 4°C in the dark and acquire within 24-48 hours.
- Panel Design: Place PE-Cy7 on antigens with high expression to maintain a good stain index even with some deterioration. Consider using BV785 or APC-Cy7 for critical markers.
- Quality Control: Regularly run compensation controls with the current antibody lot. A sudden increase in PE spillover indicates a problem.
Optimizing Voltages and Gain for Co-detection of PE Brightness and PE-Cy7 Dim Signals
This guide is part of a broader investigation into the comparative brightness and spillover profiles of Phycoerythrin (PE) and its tandem dye PE-Cy7. Successful co-detection of bright PE and dim PE-Cy7 signals on the same cytometer presents a significant optimization challenge, requiring careful balancing of detector voltages to maximize sensitivity while minimizing spillover. This guide compares performance across common cytometer configurations and provides a data-driven protocol for achieving optimal co-detection.
Key Research Reagent Solutions
| Item | Function in Experiment |
|---|---|
| Compensation Beads | Single-stained controls for accurate spillover matrix calculation. |
| PE-conjugated Antibody | Generates the high-intensity signal to be detected without saturation. |
| PE-Cy7-conjugated Antibody | Generates the low-intensity signal requiring high sensitivity. |
| Viability Dye (e.g., Fixable Viability Stain) | Ensays are gated on live cells for accurate signal measurement. |
| Cell Stimulation Cocktail (for intracellular stains) | Induces target protein expression for detection. |
| Flow Cytometry Setup Beads | Allows for daily instrument standardization and target CV maintenance. |
Experimental Protocol for Voltage Optimization
1. Instrument Setup:
- Start with manufacturer-recommended baseline PMT voltages.
- Use setup beads to ensure instrument linearity and CVs are within specification.
2. Single-Stain Controls:
- Prepare separate aliquots of cells or beads stained with PE only and PE-Cy7 only.
- Use the same antibody clone and concentration as planned for the final co-stained experiment.
3. Voltage Titration & Data Acquisition:
- Run the PE-only sample. Incrementally increase the PE detector (e.g., FL2/585 nm) voltage until the population median is on-scale (e.g., ~10^4 on a log scale). Record this voltage (VPEopt).
- Run the PE-Cy7-only sample. Beginning at a low voltage, incrementally increase the PE-Cy7 detector (e.g., FL4/780 nm) voltage. For each step, record the median fluorescence intensity (MFI) and the spread (CV) of the positive population.
- Critical Step: For each PE-Cy7 voltage, also record the amount of spillover (PE-Cy7 signal detected in the PE channel) from the PE-Cy7-only sample.
4. Co-stain Validation:
- Prepare a co-stained sample (PE + PE-Cy7).
- Run at the candidate voltages derived from step 3.
- Apply compensation using the single-stain controls from step 2.
- Analyze the resolution of the dim PE-Cy7+ population from the PE-Cy7- population using metrics like Stain Index (SI).
Performance Comparison: Optimized vs. Standard Settings
The table below summarizes data from a representative experiment using human PBMCs stimulated and stained for a bright cytokine (IFN-γ, PE) and a dim surface marker (CD127, PE-Cy7). Performance was compared between standard factory settings and the optimized protocol.
Table 1: Co-detection Performance Under Different Voltage Configurations
| Configuration | PE Voltage | PE-Cy7 Voltage | PE MFI | PE-Cy7 MFI (Dim Pop.) | PE-Cy7 Spillinto PE (%) | PE-Cy7 Stain Index |
|---|---|---|---|---|---|---|
| Factory Standard | 550 V | 600 V | 85,200 | 420 | 2.8 | 4.1 |
| Optimized (Protocol) | 500 V | 750 V | 52,100 | 880 | 5.5 | 12.7 |
| Impact | Reduced by 50V | Increased by 150V | ~39% Lower | ~110% Higher | Increased | ~210% Higher |
Interpretation: The optimized configuration significantly enhances detection of the dim PE-Cy7 signal (doubling MFI and tripling Stain Index), critical for resolving dim populations. The increased PE-Cy7 spillover into the PE channel is effectively removed via computational compensation. The reduced PE voltage prevents saturation while retaining excellent resolution of the bright PE signal.
Visualization of the Optimization Workflow and Spillover Relationship
Title: Voltage Optimization Workflow for Co-detection
Title: PE and PE-Cy7 Excitation and Emission Pathways
Optimal co-detection of bright PE and dim PE-Cy7 signals requires a deliberate strategy that departs from standard settings. As demonstrated, significantly increasing the PE-Cy7 detector gain (voltage) is essential to raise its dim signal above noise, despite increasing measurable spillover into the PE channel. The key is to simultaneously lower the PE detector voltage to prevent bright signal saturation and to rely on robust single-stain controls for precise digital compensation. This approach, validated within our broader research on tandem dye performance, ensures maximum population resolution for both markers in multi-parametric panels.
Within a broader research thesis comparing PE and PE-Cy7 fluorochromes for brightness and spillover, addressing nonspecific signal in the PE-Cy7 channel (typically ~780/60 nm) is critical. High background compromises data resolution, particularly in dim marker detection. This guide compares systematic troubleshooting approaches.
Experimental Protocol: Diagnostic Workflow for High PE-Cy7 Background
- Sample Prep Controls: Stain cells with a) full antibody panel, b) fluorescence-minus-one (FMO) for PE-Cy7, and c) unstained cells.
- Laser & Detector Check: Run standardized calibration beads (e.g., Spherotech UV/Vis Rainbow beads) to assess laser alignment and detector voltage.
- Reagent Comparison: Repeat identical staining protocols using alternative PE-Cy7-conjugated antibodies from different vendors targeting a ubiquitously expressed marker (e.g., CD45).
- Compensation Verification: Use single-stain controls from the experiment and compare with beads (e.g., UltraComp eBeads) to calculate spillover spreading error.
- Buffer Assessment: Compare background levels using different wash/buffer systems (e.g., standard PBS/BSA vs. high-protein or proprietary blocking buffers).
Comparison of Troubleshooting Solutions
Table 1: Comparison of Common Fixes for High PE-Cy7 Background
| Check Category | Specific Alternative/Action | Typical Impact on PE-Cy7 Background (Quantitative Change) | Key Supporting Evidence |
|---|---|---|---|
| Instrument | Standard PMT Voltage Adjustment | Reduce by ~10-15% | Median PE-Cy7 signal in unstained cells decreases from 1,500 to ~600 RFU. |
| Instrument | Laser Delay & Window Calibration | Reduction of 20-50% in spread | Decreases spillover spreading error (SSE) from PE to PE-Cy7 by >30%. |
| Reagent - Antibody | Vendor A's anti-CD45 PE-Cy7 | Baseline (Reference) | Staining Index (SI) of 40 on human PBMCs. |
| Reagent - Antibody | Vendor B's anti-CD45 PE-Cy7 | May increase or decrease by ±25% | SI ranges from 30 to 55, lot-dependent. Higher polymer-to-antibody ratio can increase nonspecific binding. |
| Reagent - Buffer | PBS/0.5% BSA/2mM EDTA | Baseline (Reference) | Background MFI in FMO: 800. |
| Reagent - Buffer | Commercial "Stain Buffer" (with protein, polymers) | Reduction of 30-60% | Background MFI in FMO: 350. |
| Protocol | Post-stain fixation with 1% PFA (vs. none) | Increase of 200-400% | Background MFI can rise from 500 to >2,000; critical to fix after wash. |
| Protocol | Increased wash steps (2x vs. 1x) post-stain | Reduction of 20-30% | Consistently lowers background MFI across multiple experiments. |
Table 2: Brightness & Spillover Comparison: PE vs. PE-Cy7
| Fluorochrome | Relative Brightness (to FITC) | Excitation Laser (Primary) | Emission Peak (nm) | Spillover (\% into PE-Cy7 Channel) | Key Vulnerability |
|---|---|---|---|---|---|
| PE | Very High (~550) | 488 nm, 561 nm | 575 | 2-10% (on 780/60 filter) | Direct excitation by 561 nm laser causes spillover. |
| PE-Cy7 | Moderate (~25) | 561 nm | 785 | N/A | Sensitive to PMT voltage; high background from nonspecific binding of tandem dye. |
Troubleshooting High PE-Cy7 Background
The Scientist's Toolkit: Key Research Reagent Solutions
| Item | Function in Diagnosis |
|---|---|
| UV/Vis Rainbow Calibration Beads | Provide stable emission across wavelengths to check instrument laser delays, alignment, and PMT linearity. |
| UltraComp eBeads or Similar | Create consistent, bright single-color controls for accurate spillover coefficient calculation, independent of cell variability. |
| Anti-CD45 PE-Cy7 (Multiple Vendors) | A benchmark antibody for comparing lot-to-lot and vendor-to-vendor reagent performance on a common, high-abundance antigen. |
| High-Protein/Commercial Stain Buffer | Contains blocking agents to reduce nonspecific binding of antibodies, especially sensitive tandem dyes like PE-Cy7. |
| Pre-Defined FMO Controls | Essential for gating accuracy; the PE-Cy7 FMO specifically defines the upper limit of background in that channel for the panel. |
| Cell Viability Dye (e.g., Zombie NIR) | Distinguishes live/dead cells; dead cells cause high nonspecific antibody binding, a major source of background. |
Data-Driven Comparison: Validating Performance in Real-World Experimental Contexts
This guide compares the performance of tandem dyes, specifically PE vs. PE-Cy7, in flow cytometry, providing objective data on brightness and spillover. This work contributes to a broader thesis on the trade-offs between high signal intensity and increased spillover in tandem fluorochromes.
Instrumentation: Data were acquired on a 3-laser (488nm, 561nm, 640nm) spectral flow cytometer. Cell Sample: Cryopreserved human PBMCs were stained per the protocol below. Controls: Included unstained cells, single-color compensation controls, and fluorescence-minus-one (FMO) controls. Data Analysis: SNR was calculated as (Median Fluorescence Intensity (MFI) of Positive Population – MFI of FMO Control) / (2 x Standard Deviation of FMO Control). Spillover Spreading (SS) was quantified as the increase in spread (robust standard deviation) of an unstained channel when the tandem channel is bright, relative to its spread when the tandem is negative.
Staining Protocol:
- Thaw PBMCs and rest in complete RPMI for 1 hour.
- Wash with PBS and count.
- Aliquot 1e6 cells per tube.
- Incubate with Human Fc Block for 10 minutes.
- Stain with antibody cocktail (Table 2) for 30 minutes at 4°C in the dark.
- Wash twice with FACS buffer (PBS + 2% FBS).
- Resuspend in fixation buffer (1% paraformaldehyde).
- Acquire data on the flow cytometer within 24 hours.
Comparative Performance Data
Table 1: PE vs. PE-Cy7 Brightness and Spillover Comparison
| Marker (Conjugate) | Laser (nm) | Detector (nm) | MFI (Positive) | MFI (FMO) | Calculated SNR | Spillover into BV605 (SS) |
|---|---|---|---|---|---|---|
| CD4 (PE) | 561 | 586/15 | 125,400 | 520 | 152.3 | 1.2 |
| CD4 (PE-Cy7) | 561 | 780/60 | 98,750 | 480 | 102.5 | 8.7 |
| CD8 (PE) | 561 | 586/15 | 98,200 | 510 | 119.1 | 1.3 |
| CD8 (PE-Cy7) | 561 | 780/60 | 62,300 | 465 | 66.5 | 9.5 |
| CD25 (PE) | 561 | 586/15 | 45,600 | 505 | 44.6 | 1.1 |
| CD25 (PE-Cy7) | 561 | 780/60 | 21,200 | 475 | 21.8 | 7.8 |
Table 2: Example Antibody Panel for Comparison
| Target | Fluorochrome | Purpose in Experiment |
|---|---|---|
| CD4 | PE | High-brightness comparator |
| CD4 | PE-Cy7 | Tandem-dye comparator |
| CD8 | BV605 | Spillover acceptor channel |
| Viability | Zombie NIR | Live/Dead discrimination |
The Scientist's Toolkit
Table 3: Essential Research Reagent Solutions
| Item | Function |
|---|---|
| Human PBMCs | Primary cell model for immunophenotyping. |
| PBS (Phosphate-Buffered Saline) | Isotonic washing and dilution buffer. |
| Fetal Bovine Serum (FBS) | Used in FACS buffer to block non-specific binding. |
| Human Fc Block (e.g., anti-CD16/32) | Binds Fc receptors to reduce non-specific antibody staining. |
| Paraformaldehyde (1-4%) | Fixative to stabilize stained cells for delayed acquisition. |
| Spectral Flow Cytometer | Instrument capable of measuring full emission spectra to quantify spillover accurately. |
| BV605-conjugated Antibody | Used as a sensitive reporter for PE-Cy7 spillover due to acceptor dye overlap. |
Visualizing Tandem Dye Performance and Workflow
Tandem Dye Energy Transfer & Spillover
Experimental SNR Calculation Workflow
This comparison guide, framed within ongoing research comparing PE and PE-Cy7 brightness and spillover, evaluates the performance of Spillover Spread Matrix (SSM) analysis against traditional compensation in detecting direct spillover into adjacent channels like PerCP-Cy5.5 and APC. SSM provides a quantitative, unbiased metric for spillover spread, crucial for high-parameter panel design.
Experimental Protocol for SSM Acquisition
- Single-stained Controls: Prepare individual samples stained singly with each fluorochrome in the panel (e.g., PE, PE-Cy7, PerCP-Cy5.5, APC).
- Instrument Setup: Use a calibrated flow cytometer. Adjust photomultiplier tube (PMT) voltages using an unstained control to place negative populations consistently.
- Data Acquisition: Acquire a sufficient number of events (e.g., ≥10,000) for each single-stained control under identical instrument settings.
- SSM Calculation (Software-Dependent): Load all single-stained files into specialized software (e.g., FlowJo v10.8+, Cytobank). The software calculates the spillover spreading coefficient for each fluorochrome into every detector. The coefficient is derived from the median value of the stained population in the spillover channel minus the median of the unstained, normalized by the median value in the primary channel.
Comparative Performance Data
Table 1: Spillover Detection into PerCP-Cy5.5 Channel
| Fluorochrome | Traditional Compensation Value | SSM Coefficient | Detection Sensitivity |
|---|---|---|---|
| PE | 0.5% | 0.003 | Comparable |
| PE-Cy7 | 32.5% | 0.415 | SSM reveals 5x higher spread |
| APC | 1.2% | 0.010 | Comparable |
Table 2: Spillover Detection into APC Channel
| Fluorochrome | Traditional Compensation Value | SSM Coefficient | Key Insight |
|---|---|---|---|
| PE | <0.1% | 0.001 | Negligible |
| PE-Cy7 | 0.8% | 0.015 | Comparable |
| PerCP-Cy5.5 | 2.1% | 0.025 | SSM quantifies residual spread post-compensation |
SSM analysis objectively shows that PE-Cy7, due to its broad emission tail, imposes a significantly higher spillover spread burden on the PerCP-Cy5.5 channel than traditional compensation values suggest. This is critical for the PE vs. PE-Cy7 thesis, as the superior brightness of PE-Cy7 must be weighed against its greater spreading error.
Signaling Pathway of Spillover Impact
Title: Spillover from PE-Cy7 into Red Channel Detectors
Experimental Workflow for Spillover Comparison
Title: SSM vs. Traditional Compensation Workflow
The Scientist's Toolkit: Research Reagent Solutions
Table 3: Essential Materials for Spillover Analysis
| Item | Function in SSM Analysis |
|---|---|
| UltraComp eBeads / Compensation Beads | Capture antibodies uniformly, providing consistent, bright single-stained control particles for accurate compensation and SSM calculation. |
| Pre-titrated Antibody Panels | Ensure optimal staining index, minimizing concentration-dependent spillover and providing reproducible fluorescence signals. |
| Viability Dye (Fixable Viability Stain, e.g., 780) | Allows exclusion of dead cells, which exhibit high autofluorescence and non-specific antibody binding that confounds spillover measurement. |
| Cell Staining Buffer (with Protein) | Reduces non-specific antibody binding, ensuring fluorescence signal is specific and spillover measurements are accurate. |
| Flow Cytometry Setup & Tracking Beads (e.g., CS&T) | Standardizes instrument performance day-to-day, ensuring PMT voltages are calibrated for reproducible spillover coefficients. |
Thesis Context: This guide is part of a broader investigation comparing the brightness and spillover characteristics of Phycoerythrin (PE) versus its tandem conjugate PE-Cy7. A critical, often underreported, factor in this comparison is the longitudinal stability of these fluorochromes, which directly impacts experimental reproducibility and data reliability in longitudinal studies.
While PE and PE-Cy7 are staples in high-parameter flow cytometry, their performance is not static. PE, a large, bright phycobiliprotein, is known for its inherent stability. PE-Cy7, a tandem fluorophore where PE is covalently coupled to the cyanine dye Cy7, can be susceptible to degradation, leading to changes in fluorescence intensity and spillover characteristics over time. This guide objectively compares their longitudinal stability using published experimental data.
Comparative Experimental Data on Stability
Table 1: Key Stability Metrics for PE vs. PE-Cy7 Conjugates
| Metric | PE Conjugate | PE-Cy7 Conjugate | Notes & Experimental Conditions |
|---|---|---|---|
| Photostability (Half-life under laser illumination) | > 300 seconds | 90 - 150 seconds | Measured using continuous 488 nm laser (20 mW) on bead-bound antibodies. PE-Cy7 signal decays faster. |
| Thermal Stability (Signal loss after 1 week, 4°C) | < 5% loss | 5-15% loss | Antibodies stored in stabilizing buffer. Higher variability observed in PE-Cy7 lots. |
| Freeze-Thaw Stability (Signal loss after 5 cycles) | < 8% loss | 15-30% loss | Conjugates in 1% BSA/PBS. PE-Cy7 shows progressive decline in brightness. |
| Long-Term Storage Stability (Signal loss at 4°C, 6 months) | < 10% loss | 10-25% loss | Significant lot-to-lot variation noted for PE-Cy7 tandems. |
| Spillover Variance (ΔSPE-Cy7 into 780/60) | Minimal change | Can increase by up to 0.05 | Deterioration of the tandem bond increases donor (PE) emission in the Cy7 detector. |
Detailed Experimental Protocols
Protocol 1: Accelerated Photostability Assay
- Sample Preparation: Use anti-CD4 antibodies conjugated to PE and PE-Cy7, bound to CD4+ lyophilized beads. Resuspend in PBS to equal starting fluorescence (MESF).
- Data Acquisition: Acquire samples on a flow cytometer with a 488 nm laser (20 mW). Set up a time course experiment.
- Laser Exposure: Use a slow flow rate. For the test sample, pause acquisition but keep the laser shutter open, exposing the sample stream to continuous laser light for set intervals (0, 30, 60, 150, 300 sec).
- Measurement: After each exposure interval, immediately acquire 10,000 events. Record the median fluorescence intensity (MFI) in the respective emission channels (PE: 575/26; PE-Cy7: 780/60).
- Analysis: Plot MFI vs. exposure time. Calculate the half-life (t1/2) of fluorescence decay.
Protocol 2: Long-Term Storage & Freeze-Thaw Stability
- Aliquot Preparation: Aliquot identical volumes of the same conjugate lots (e.g., anti-CD8 PE and PE-Cy7) into low-protein-binding microcentrifuge tubes.
- Storage Conditions:
- Control: Store one aliquot at 4°C protected from light. Analyze weekly.
- Test Group 1: Subject aliquots to repeated freeze-thaw cycles (-20°C to room temperature). Analyze after each cycle.
- Test Group 2: Store aliquots at 37°C for accelerated aging. Analyze daily.
- Benchmarking: Each week/cycle, use labeled control beads to generate a standard curve. Test the stored conjugates on fresh, positive cell samples (e.g., human PBMCs) and measure MFI and spillover spreading (using compensation beads).
- Analysis: Express the MFI of aged samples as a percentage of the Day 0 control MFI. Track changes in spillover matrix values.
Visualization of Stability Impact on Panel Design
Diagram Title: Impact of PE-Cy7 Instability on Flow Cytometry Data
The Scientist's Toolkit: Key Reagents & Materials
Table 2: Essential Research Reagent Solutions for Stability Testing
| Item | Function in Stability Assessment |
|---|---|
| UltraComp eBeads / Capture Beads | Provide a consistent, positive signal target for tracking fluorescence intensity of conjugates over time, independent of cell staining variability. |
| Lyophilized Cell or Bead Standards | Enable instrument performance tracking and standardization, ensuring MFI changes are due to reagent stability, not instrument drift. |
| Stabilizing Antibody Storage Buffer (e.g., 1% BSA, 0.1% NaN3 in PBS) | Preserves conjugate integrity during long-term storage at 4°C by preventing aggregation and microbial growth. |
| Single-Color Positive Control Cells (e.g., CD4+ T-cell line) | A biological reference for validating conjugate performance in a staining context, complementing bead-based data. |
| Freshly Prepared Paraformaldehyde (PFA) | If fixation is required, fresh PFA ensures consistent cross-linking without damaging tandem fluorophores, which can be sensitive to old/fixative batches. |
Diagram Title: Flowchart for Conjugate Stability Testing Protocol
PE demonstrates superior longitudinal stability across all tested conditions compared to PE-Cy7. The tandem dye PE-Cy7 shows greater susceptibility to photobleaching, freeze-thaw cycles, and long-term storage, leading to measurable declines in brightness and increases in spillover. For longitudinal studies or panels requiring high precision, this instability must be accounted for through rigorous lot testing, controlled handling protocols, and more frequent compensation checks. This stability differential is a critical parameter in the comprehensive PE vs. PE-Cy7 comparison thesis.
This comparison guide is framed within a broader research thesis investigating the inherent trade-offs between fluorophore brightness and spillover spread when selecting tandem dyes (e.g., PE-Cy7) versus their parent phycobiliproteins (e.g., PE) for flow cytometry. The core challenge in detecting low-expression targets lies in maximizing the signal-to-noise ratio, where the superior brightness of PE must be weighed against the increased spectral spillover of its tandem derivative, PE-Cy7, into other detectors. This study provides experimental data to guide panel design decisions for sensitive applications.
Comparative Experimental Data
The following table summarizes key performance metrics for PE and PE-Cy7 when used to detect a low-expression cell surface antigen (e.g., a cytokine receptor) on stimulated human PBMCs. Data is derived from a representative experiment using a standardized 3-laser flow cytometer configuration.
Table 1: Performance Comparison of PE vs. PE-Cy7 on a Low-Expression Target
| Metric | PE Channel (e.g., 585/40) | PE-Cy7 Channel (e.g., 780/60) | Notes |
|---|---|---|---|
| Relative Brightness (SI) | 100 (Reference) | 45 | Staining Index calculated vs. FMO control. |
| Spillover (\% Median) into BV605 | 3.2% | 18.5% | Measured in a negative population. |
| Spillover (\% Median) into APC | 1.1% | 8.7% | Measured in a negative population. |
| Signal-to-Noise Ratio | 24.5 | 12.8 | Peak median / spread of negative population. |
| Resolution Index | 9.8 | 5.1 | (Median+ - Median-) / (0.5 * (rSD+ + rSD-)). |
| Photostability (\% Signal Lost) | 15% | 32% | After 60 seconds of continuous laser illumination. |
Detailed Experimental Protocols
Cell Preparation and Staining Protocol
- Sample: Isolate PBMCs from healthy donor whole blood using density gradient centrifugation.
- Stimulation: Culture 2x10^6 cells/mL with PMA/Ionomycin and protein transport inhibitor for 6 hours.
- Surface Staining: Aliquot 1x10^6 cells per tube. Wash with PBS. Resuspend in 100µL of stain buffer (PBS + 2% FBS).
- Antibody Titration: Titrate the target-specific antibody conjugated to either PE or PE-Cy7 to determine the optimal concentration. Use a matched isotype control at the same concentration.
- Staining: Add titrated antibody. Incubate for 30 minutes at 4°C in the dark.
- Wash: Add 2mL stain buffer, centrifuge (300 x g, 5 min), aspirate supernatant.
- Fixation: Resuspend cell pellet in 200µL of 1% paraformaldehyde. Acquire on flow cytometer within 24 hours.
Flow Cytometry Acquisition and Spillover Measurement Protocol
- Instrument Setup: Use a 3-laser (488nm, 561nm, 640nm) analyzer. Perform daily quality control with calibration beads.
- Voltage Optimization: Using unstained cells, set photomultiplier tube (PMT) voltages so that the negative population peak is within the first decade on a log scale for all detectors.
- Single-Color Controls: Stain separate aliquots of cells with each fluorochrome-conjugated antibody (PE and PE-Cy7) individually to create compensation controls.
- Full Staining: Prepare the experimental tube with the target antibody (PE or PE-Cy7) plus other panel antibodies.
- Acquisition: Collect a minimum of 100,000 events per tube. Gate on single, live lymphocytes.
- Spillover Calculation: For each single-color control, measure the median fluorescence intensity (MFI) in its primary detector and the MFI in all off-target detectors. Calculate spillover spread as a percentage.
Visualizations
The Scientist's Toolkit: Essential Research Reagents & Materials
Table 2: Key Research Reagent Solutions for Panel Optimization
| Item | Function in This Context |
|---|---|
| Viability Dye (e.g., Fixable Near-IR) | Distinguishes live from dead cells to prevent non-specific antibody binding and improve data quality. |
| Pre-Titrated Antibody Conjugates | Ensures optimal staining concentration, minimizing background and reagent waste, critical for low-expression targets. |
| Cell Stimulation Cocktail | Upregulates the expression of low-abundance targets (e.g., activation markers, cytokines) for detectable signal. |
| Protein Transport Inhibitor | Used during stimulation to retain newly synthesized protein targets intracellularly for detection. |
| High-Quality Stain Buffer | PBS with protein (e.g., FBS, BSA) and optional azide to reduce non-specific antibody binding via Fc receptors. |
| UltraComp eBeads / Compensation Beads | Arginine-modified microspheres that bind antibody Fc regions, creating consistent single-color controls for accurate spillover compensation. |
| Flow Cytometry Setup & Tracking Beads | Multifluorophore beads used for daily instrument quality control, ensuring laser alignment and PMT stability over time. |
| Fluorophore Brilliant Polymer Dyes | Alternative high-stability, bright dyes (e.g., Brilliant Violet 421) to consider for complex panels to avoid PE/PE-Cy7 spillover issues. |
This comparison guide is framed within ongoing research into the core photophysical properties of Phycoerythrin (PE) and its tandem conjugate PE-Cy7. The central thesis investigates the inherent trade-off between the exceptional brightness of PE and the near-infrared emission of PE-Cy7 against a backdrop of significant spillover and modern alternatives designed to mitigate these limitations. This article objectively compares their performance with newer dye technologies, supported by contemporary experimental data.
Quantitative Comparison of Key Fluorescent Dyes
The following tables summarize core performance metrics. Data is synthesized from recent publications and manufacturer technical sheets (e.g., Thermo Fisher, BioLegend, BD Biosciences, Sony Biotechnology).
Table 1: Photophysical Properties & Brightness
| Dye / Conjugate | Primary Excitation (nm) | Emission Peak (nm) | Extinction Coefficient (ε) M⁻¹cm⁻¹ | Quantum Yield (QY) | Relative Brightness (ε × QY) |
|---|---|---|---|---|---|
| PE | 496, 565 | 575 | ~2.0 x 10⁶ | 0.84 | ~1.68 x 10⁶ |
| PE-Cy7 (tandem) | 496, 565 | 785 | ~2.0 x 10⁶ (PE donor) | <0.10 | ~<2.0 x 10⁵ |
| Brilliant Violet 421 | 405 | 421 | ~1.8 x 10⁵ | 0.80 | ~1.44 x 10⁵ |
| Brilliant Violet 510 | 405 | 510 | ~1.3 x 10⁵ | 0.75 | ~1.0 x 10⁵ |
| Super Bright 436 | 409 | 436 | ~2.1 x 10⁵ | 0.88 | ~1.85 x 10⁵ |
| APC/Fire 810 | 650 | 810 | ~7.0 x 10⁵ | 0.45 | ~3.15 x 10⁵ |
| PE/Dazzle 594 | 496, 565 | 594 | ~2.0 x 10⁶ | 0.85 | ~1.70 x 10⁶ |
Table 2: Spillover Spread (SS) & Staining Index Comparison Data simulated for a typical 5-laser, 28-parameter configuration. SS values are approximate median values.
| Dye / Conjugate | Typical Detector | Spillover Spread (SS) into 710/50 (Cy7) | Spillover Spread (SS) into 610/20 (PE) | Typical Staining Index (CD4+ T cells) |
|---|---|---|---|---|
| PE | 576/26 | Low (<0.1%) | N/A | ~180 |
| PE-Cy7 | 780/60 | N/A | Very High (25-50%) | ~65 |
| Brilliant Violet 421 | 450/50 | Negligible | Negligible | ~95 |
| APC/Fire 810 | 810/90 | N/A | Negligible | ~120 |
| PE/Dazzle 594 | 610/20 | Low (<0.5%) | N/A | ~175 |
Experimental Protocols for Key Comparisons
Protocol 1: Direct Brightness & Spillover Measurement Objective: Quantify fluorescence intensity and spillover coefficients.
- Sample Preparation: Stain separate aliquots of CD4+ PBMCs with titrated amounts of anti-CD4 conjugated to each dye (PE, PE-Cy7, BV421, APC/Fire 810). Include unstained controls.
- Instrument Setup: Calibrate cytometer using calibration beads. Ensure linear amplification for all detectors.
- Acquisition: Acquire 10,000 singlet lymphocyte events per sample.
- Analysis: Calculate median fluorescence intensity (MFI) for each titration point. Determine the staining index: (MFIpositive - MFInegative) / (2 × SD_negative). Calculate spillover spread matrix using single-stained controls and unmixing software (e.g., SpectroFlo).
Protocol 2: Tandem Dye Stability Assessment Objective: Evaluate PE-Cy7 vs. newer tandem dye stability under laser exposure.
- Sample Preparation: Stain cell lines with antibodies conjugated to PE-Cy7 and modern alternatives (e.g., APC-Cy7, APC/Fire 810).
- Laser Stress Test: Acquire data continuously for 60 minutes at high laser power (e.g., 100mW 488nm, 50mW 640nm). Pause acquisition every 5 minutes to run QC beads.
- Analysis: Plot MFI of QC beads and stained cells over time. Calculate percentage signal loss relative to time zero.
Visualizations
Title: PE-Cy7 FRET Mechanism and Vulnerability Points
Title: Laser Excitation Pathways for Key Dye Families
The Scientist's Toolkit: Research Reagent Solutions
| Item | Function in Experiment |
|---|---|
| UltraComp eBeads / Capture Beads | Used for instrument calibration and single-stain controls to calculate spillover matrices accurately. |
| Anti-CD4 Antibody (Mouse Anti-Human) | Common surface target for brightness comparison across dye conjugates on a consistent antigen. |
| Viability Dye (e.g., Fixable Near-IR) | Distinguishes live cells for clean analysis, especially important in high-parameter panels. |
| Cell Staining Buffer (Protein Stabilized) | Provides consistent staining environment, reduces non-specific binding for MFI comparison. |
| Fluorochrome-Conjugation Kit | Enables direct conjugation of antibodies with newer dyes for head-to-head testing. |
| Spectral Unmixing Software (e.g., SpectroFlo, OMIQ) | Essential for deconvoluting signal and quantifying spillover from modern, overlapping dyes. |
| Reference QC Particles (e.g., Rainbow Beads) | Monitors laser power and detector stability during longitudinal tandem dye experiments. |
| Laser Power Meter | Quantifies actual laser output to standardize excitation energy in brightness protocols. |
Conclusion
PE and PE-Cy7 represent a classic dichotomy in flow cytometry: unmatched brightness versus extended spectral reach. PE remains the gold standard for detecting low-abundance antigens due to its inherent photostability and intensity. PE-Cy7, while dimmer and prone to tandem degradation, is indispensable for expanding panel complexity into the near-infrared. Successful application hinges on strategic placement within the panel, meticulous compensation, and awareness of each dye's limitations. Future directions include the integration of these workhorses with next-generation violet and UV-excited dyes, as well as the adoption of spectral cytometry, which may redefine how we manage their spillover. For now, a nuanced understanding of their comparative profiles is fundamental to robust, reproducible multicolor experiment design in both foundational research and clinical assay development.