OCT-Guided Biopsy for Colorectal Dysplasia: Advancing Precision in Early Detection and Targeted Therapy
This article provides a comprehensive examination of Optical Coherence Tomography (OCT)-guided biopsy for the management of colorectal dysplasia, tailored for researchers, scientists, and drug development professionals.
OCT-Guided Biopsy for Colorectal Dysplasia: Advancing Precision in Early Detection and Targeted Therapy
Abstract
This article provides a comprehensive examination of Optical Coherence Tomography (OCT)-guided biopsy for the management of colorectal dysplasia, tailored for researchers, scientists, and drug development professionals. We explore the foundational principles of OCT contrast in dysplastic tissues, detailing the technological basis and light-tissue interactions. The methodological section outlines current clinical workflows, imaging protocols, and integration with endoscopic platforms for targeted biopsy. We address key challenges in image interpretation, artifact mitigation, and procedural optimization. Finally, we present a critical analysis of validation studies, comparing OCT-guided biopsy against standard histopathology and emerging techniques like confocal laser endomicroscopy. The conclusion synthesizes the translational potential of this technology for improving diagnostic accuracy, guiding therapeutic development, and personalizing surveillance strategies in inflammatory bowel disease (IBD) and colorectal cancer screening.
Understanding OCT Imaging Fundamentals: Principles and Tissue Contrast in Colorectal Dysplasia
Optical Coherence Tomography (OCT) is a non-invasive, high-resolution imaging technology based on low-coherence interferometry. Within the broader thesis on OCT-guided biopsy for colorectal dysplasia research, OCT serves as a critical tool for in vivo, real-time identification and targeting of dysplastic lesions in the colon. This enables precise, image-guided biopsy acquisition, improving the yield for molecular analysis and enhancing research into early detection markers and therapeutic responses in drug development pipelines.
Foundational Principles: Low-Coherence Interferometry
OCT measures backscattered light from biological tissue. Its axial resolution (typically 1-15 µm) is decoupled from lateral resolution and is determined by the coherence length of the light source. The core principle is Michelson interferometry using a broadband, low-coherence light source.
Key Interferometry Equation: The detected interferometric signal intensity ( ID ) at the detector is given by: [ ID = IR + IS + 2\sqrt{IR IS} \cdot |\gamma(\Delta l)| \cdot \cos(2k_0 \Delta l) ] Where:
- ( I_R ): Reference arm intensity
- ( I_S ): Sample arm intensity
- ( \gamma(\Delta l) ): Complex degree of coherence
- ( \Delta l ): Path length difference between arms
- ( k_0 ): Central wavenumber of source
Only light from sample depths where the path length difference ( \Delta l ) is within the coherence length of the source will interfere constructively, providing depth selectivity.
Quantitative Parameters of Modern OCT Systems
Table 1: Typical Performance Parameters of OCT Systems for Gastrointestinal Research
| Parameter | Spectral-Domain (SD-OCT) | Swept-Source (SS-OCT) | Relevance to Colorectal Imaging |
|---|---|---|---|
| Central Wavelength | ~840 nm, ~1300 nm | 1060-1300 nm | 1300 nm offers deeper penetration in scattering tissue. |
| Axial Resolution | 1-5 µm (in tissue) | 5-10 µm (in tissue) | Higher resolution delineates mucosal layers. |
| Imaging Depth | 1-2 mm | 2-5 mm | Sufficient to image submucosa in colon. |
| A-Scan Rate | 50-200 kHz | 100-500 kHz (up to MHz) | High speed reduces motion artifact in vivo. |
| Lateral Resolution | 10-30 µm | 15-30 µm | Determined by objective lens spot size. |
Signal and Image Generation: From A-Scan to B-Scan
A-Scan (Axial Scan) Generation Protocol
An A-Scan represents the depth-resolved reflectivity profile at a single lateral point.
Protocol: Generation of a Single A-Scan in Fourier-Domain OCT (SD-OCT)
Spectral Data Acquisition:
- Illuminate the sample with broadband light.
- Recombine light from reference and sample arms at the spectrometer.
- Acquire the interferogram ( I_D(k) ) as a function of wavenumber ( k ) using a line-scan camera.
Pre-processing:
- Background Subtraction: Subtract a reference spectrum (taken with blocked sample arm).
- Dispersion Compensation: Apply numerical compensation to match dispersion in both arms.
- Resampling: Re-sample data from wavelength ( \lambda ) to wavenumber ( k )-space (( k = 2\pi/\lambda )).
Fourier Transform:
- Apply a Fast Fourier Transform (FFT) to the pre-processed spectral signal ( I_D(k) ).
- The magnitude of the FFT result yields the depth-resolved reflectivity profile (A-Scan): ( A(z) = |FFT[I_D(k)]| ).
Logarithmic Compression:
- Apply a logarithmic scale (e.g., ( 10 \cdot \log_{10}(A(z)) )) to the linear A-Scan data to visualize a wide dynamic range of backscatter intensities.
B-Scan (Cross-sectional Image) Generation Protocol
A B-Scan is a two-dimensional cross-sectional image composed of a series of adjacent A-Scans.
Protocol: Generation of a B-Scan for Colorectal Tissue Assessment
Lateral Scanning:
- Using galvanometric mirrors, translate the focused probe beam across the tissue surface in a straight line.
Data Matrix Acquisition:
- At each lateral position ( x ), acquire a full spectral interferogram ( I_D(k, x) ).
- This results in a raw data matrix of size ( [Nk \times Nx] ), where ( Nk ) is the number of spectral points and ( Nx ) is the number of lateral positions.
Processing Pipeline:
- Process each column of the matrix (each ( I_D(k, x) )) according to the A-Scan protocol above.
- This generates a matrix of size ( [Nz \times Nx] ), where ( N_z ) is the number of depth points.
Image Display:
- Map the logarithmically compressed amplitude values to a grayscale or false-color lookup table.
- Assemble the A-Scans side-by-side in the order of acquisition to form the final 2D B-Scan image, representing optical backscatter in the ( x-z ) plane.
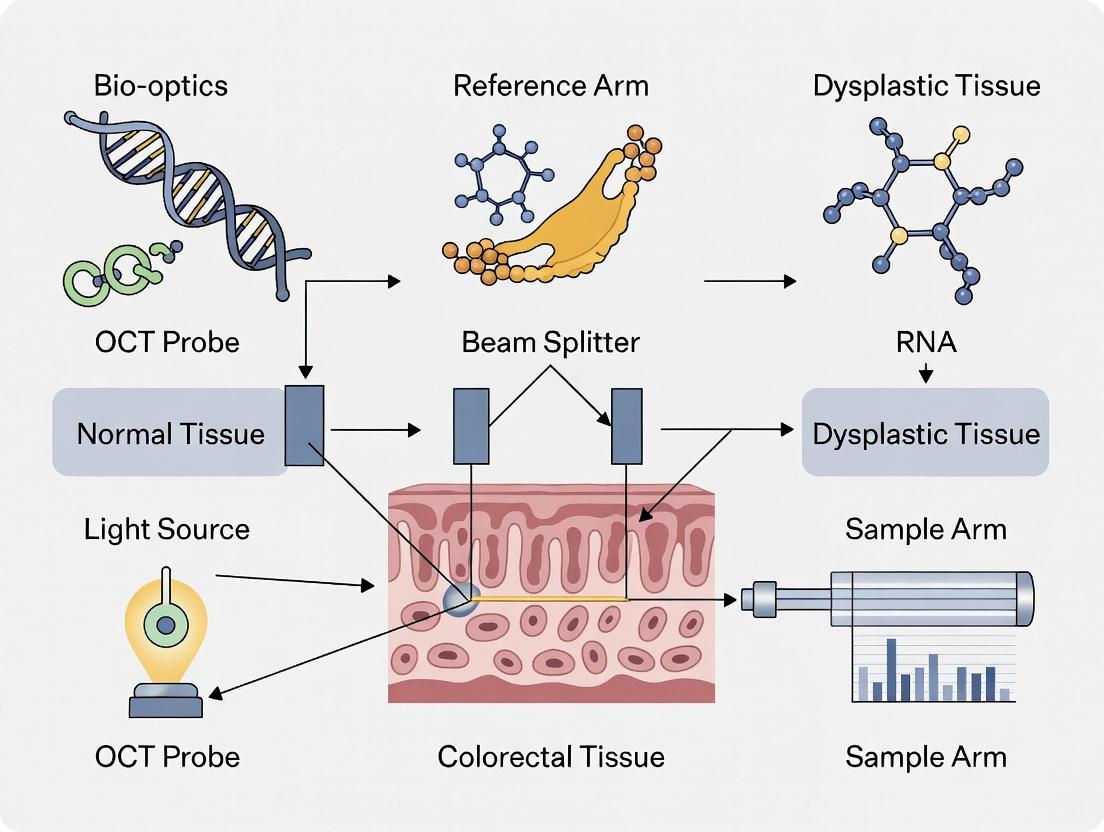
Diagram 1: FD-OCT System and Signal Flow (79 chars)
Diagram 2: A-Scan to B-Scan Construction (79 chars)
The Scientist's Toolkit: Research Reagent Solutions for OCT-Guided Biopsy Studies
Table 2: Essential Materials for Ex Vivo/In Vivo OCT-Guided Biopsy Protocol
| Item | Function/Description | Example Product/Category |
|---|---|---|
| FD-OCT System | Provides the core imaging capability. Requires endoscopic compatibility for in vivo work. | Thorlabs Telesto series, Michelson Diagnostics VivoSight (skin), custom endoscopic probes. |
| Endoscopic Probe | Flexible or rigid optical probe to deliver and collect light within the colon. | GRIN-lens based micro-optic probes, balloon-centered catheters for stability. |
| Index Matching Fluid | Applied between probe tip and tissue to reduce strong surface reflection and improve signal. | Glycerol (70-100%), saline, or commercial optical gels. |
| Tissue Stabilization Mount | For ex vivo studies, to minimize motion and orient specimens. | Custom 3D-printed holders with orientation markers. |
| Biopsy Marking Dye | To physically mark the OCT-imaged site for targeted biopsy. | Sterile surgical ink (e.g., Spot), cautery mark. |
| Spectral Calibration Kit | For system calibration and point-spread-function measurement. | Set of calibrated reflective mirrors and neutral density filters. |
| Histology-Compatible OCT Mounting Medium | For ex vivo imaging of fresh specimens without damaging histology. | Phosphate-buffered saline (PBS), optimal cutting temperature (OCT) compound. |
| Image Co-registration Software | To digitally record the precise location of each B-Scan and corresponding biopsy site. | MATLAB with Image Processing Toolbox, 3D Slicer, custom LabVIEW applications. |
Experimental Protocol: OCT-Guided Biopsy of Murine Colonic Dysplasia
Title: Ex Vivo Correlation of OCT B-Scan Features with Histopathology in a Colitis-Associated Dysplasia Model.
Objective: To validate OCT image features (e.g., loss of layered architecture, crypt distortion) against histopathological gold standard in targeted biopsies.
Materials: As listed in Table 2, using a benchtop FD-OCT system and fresh surgical specimens from a murine AOM/DSS model.
Detailed Methodology:
Specimen Preparation:
- Euthanize mouse and resect entire colon. Flush lumen with cold PBS.
- Pin the colon open, mucosa-side up, on a wax dish using minutien pins. Keep moist with PBS.
OCT Imaging Survey:
- Apply a drop of glycerol to the mucosal surface.
- Using the OCT probe mounted on a translation stage, acquire a series of dense, overlapping B-Scans (e.g., 1000 A-Scans per B-Scan, 200 B-Scan locations) along the length of the colon.
Target Identification and Marking:
- In real-time, analyze B-Scans for dysplastic features: 1) Loss of distinct mucosal/submucosal layered boundary, 2) Heterogeneous/vertically oriented crypt structures, 3) Increased and irregular subsurface scattering.
- For each region of interest (ROI) identified, physically mark the exact lateral location on the tissue adjacent to the B-Scan line using sterile surgical ink.
Precise Biopsy Acquisition:
- Using a 2mm punch biopsy tool, take a full-thickness tissue sample centered on the ink mark. Ensure the punch is perpendicular to the tissue surface.
- For each ROI, also acquire a control biopsy from an adjacent, architecturally normal-appearing OCT region.
Histological Correlation:
- Process all biopsies for standard H&E histology. Section the tissue block perpendicular to the mucosal surface, aligning with the OCT B-Scan plane.
- A gastrointestinal pathologist, blinded to the OCT data, grades each biopsy for dysplasia (negative, indefinite, low-grade, high-grade).
Data Co-registration & Analysis:
- Digitally map the histology slide image onto the corresponding OCT B-Scan using the ink mark and tissue edges as fiducials.
- Quantify diagnostic performance (sensitivity, specificity) of OCT criteria for detecting dysplasia.
Diagram 3: OCT Guided Biopsy Validation Workflow (85 chars)
The overarching thesis proposes that optical coherence tomography (OCT) can provide real-time, microscopic guidance for targeted biopsy in colorectal cancer surveillance, dramatically improving dysplasia detection yield over random biopsy protocols. This document details the application notes and protocols for characterizing the key optical contrast mechanisms—scattering, attenuation, and architectural disruption—that differentiate dysplastic from normal colonic mucosa in OCT imaging. Quantifying these parameters forms the basis for developing automated, objective OCT diagnostic algorithms.
Core Contrast Mechanisms & Quantitative Metrics
The following table summarizes the primary optical properties and architectural features that generate contrast in colonic OCT, along with their quantitative descriptors.
Table 1: Key Optical Contrast Mechanisms in Colonic Mucosa OCT
| Contrast Mechanism | Physical Basis | Normal Mucosa Presentation | Dysplastic Mucosa Presentation | Primary Quantitative Metric(s) |
|---|---|---|---|---|
| Scattering | Refractive index mismatches at subcellular & extracellular boundaries. | Uniform, fine granular pattern from crypt architecture. | Increased heterogeneity; denser nuclei and crowded glands elevate backscatter. | Speckle variance, intensity variance, normalized standard deviation. |
| Attenuation | Combination of scattering and absorption leading to signal decay with depth. | Layered attenuation profile: rapid in epithelium, slower in lamina propria. | Homogenized, rapid attenuation due to hypercellularity and glandular crowding. | Attenuation coefficient (μ, mm⁻¹), calculated from depth-resolved intensity fit. |
| Layered Architecture | Delineation of tissue microstructures. | Distinct, continuous layers: mucosa (crypts), muscularis mucosa, submucosa. | Loss of layered structure; crypt fusion, disruption of muscularis mucosa, submucosal invasion. | Layer thickness, texture correlation, boundary sharpness/irregularity. |
Experimental Protocols
Protocol 3.1: Ex Vivo OCT Imaging and Coregistration for Biopsy Validation
- Objective: To acquire high-resolution OCT datasets of fresh colectomy specimens with precise histological correlation.
- Materials: Spectral-domain OCT system (central λ ~1300nm), fresh surgical specimen, biopsy punch (3mm), specimen mounting medium, cassette for histology.
- Method:
- Orient the fresh colonic mucosa and rinse with saline.
- Identify regions of interest (ROI) under white light.
- Acquire 3D OCT volumetric scans (e.g., 6x6mm, 1024 x 512 pixels) of each ROI. Save data.
- Using a sterile biopsy punch, take a tissue cylinder from the exact center of the OCT scan ROI. Mark orientation.
- Immediately fix the punch biopsy in 10% neutral buffered formalin for standard H&E processing.
- Process the remaining tissue for whole-mount histology of the surrounding area.
- Pathologist grades dysplasia (negative, indefinite, low-grade, high-grade) on H&E.
- Coregister OCT volumes with histology using fiduciary markers (vessel patterns, crypt bundles).
Protocol 3.2: Quantification of Attenuation Coefficient (μ)
- Objective: To derive a depth-resolved attenuation coefficient map from single-scatter model OCT data.
- Materials: OCT volumetric data (linear intensity scale), custom analysis software (e.g., MATLAB, Python).
- Method:
- Preprocessing: Flatten the tissue surface in each A-scan. Apply a confocal point spread function correction if needed.
- Model Fitting: For each A-scan, model the depth-dependent intensity I(z) as: I(z) = P * exp(-2μz) where P is the backscattered intensity at the surface and z is depth.
- Fit the model to the linear intensity data from a defined depth range (e.g., 50-300μm below surface) using a least-squares algorithm.
- Output μ (mm⁻¹) for each A-scan. Generate en face maps by averaging μ over the depth range of interest (e.g., mucosa layer).
- Validation: Compare median μ values between histologically confirmed normal and dysplastic ROIs using Mann-Whitney U test.
Protocol 3.3: Analysis of Layered Architecture Disruption
- Objective: To objectively quantify the loss of layered structure in dysplastic mucosa.
- Materials: OCT B-scans, image segmentation software.
- Method:
- Layer Segmentation: Manually or via semi-automated algorithm, segment the key boundaries: mucosal surface, basal crypt layer (interface with lamina propria), and muscularis mucosa.
- Feature Extraction:
- Layer Thickness: Calculate mean and variability of mucosal thickness.
- Boundary Irregularity: Compute the fractal dimension or standard deviation of the basal crypt boundary.
- Textural Correlation: Use a moving window to calculate the correlation coefficient of texture between adjacent image regions. Dysplasia shows lower spatial correlation.
The Scientist's Toolkit: Research Reagent Solutions
Table 2: Essential Materials for OCT Dysplasia Contrast Research
| Item | Function/Application | Example/Notes |
|---|---|---|
| Spectral-Domain OCT System | High-speed, high-resolution 3D imaging of tissue microstructure. | Central wavelength ~1300nm for optimal penetration in colon; axial resolution <10μm. |
| Specimen Mounting Medium | Immobilizes tissue for stable imaging and prevents dehydration. | Clear, viscous gel (e.g., carboxymethylcellulose) with refractive index ~1.33. |
| Histology Coregistration Kit | Enables precise correlation between OCT scan and histologic diagnosis. | Includes 3mm biopsy punch, tissue dyes for orientation, and custom grid-marked cassettes. |
| Attenuation Analysis Software | Extracts quantitative attenuation coefficient from raw OCT data. | Custom scripts in Python (using NumPy, SciPy) or MATLAB with curve fitting toolbox. |
| Digital Pathology Slide Scanner | Creates high-resolution whole-slide images for direct visual coregistration with OCT en face maps. | 20x magnification or higher; supports brightfield H&E. |
Visualizations
5.1 OCT Dysplasia Contrast Analysis Workflow
5.2 Optical Property Changes in Dysplasia
Application Notes
These optical biomarkers serve as critical quantitative endpoints for in vivo and ex vivo assessment of colorectal dysplasia, providing a bridge between OCT imaging and histopathological validation. Their accurate identification is central to the thesis that OCT-guided biopsy can significantly improve the yield and precision of sampling in early carcinogenesis research and therapeutic monitoring.
Disruption of Crypt Architecture: In healthy mucosa, OCT reveals a regular, "pit-and-cave" pattern of crypts. Dysplasia leads to irregular, dilated, branched, or completely effaced crypt structures. This can be quantified using architectural texture analysis metrics.
Increased Nuclei-to-Cytoplasm (N/C) Ratio: A hallmark of cellular atypia, an elevated N/C ratio manifests in OCT as increased signal intensity and heterogeneity in the epithelial layer, as nuclei scatter light more strongly than cytoplasm. This is quantifiable via OCT signal attenuation analysis.
Loss of Layering: The normal colorectal wall has distinct OCT layers corresponding to the mucosa, submucosa, and muscularis propria. Dysplasia blurs or obliterates the clear mucosal-submucosal interface, leading to a loss of this layered appearance.
Table 1: OCT Biomarker Metrics in Normal vs. Dysplastic Colorectal Tissue
| Biomarker | Normal Range (Mean ± SD) | Dysplastic Range (Mean ± SD) | Primary Quantitative OCT Measure | Diagnostic Threshold |
|---|---|---|---|---|
| Crypt Regularity Index | 0.85 ± 0.07 | 0.42 ± 0.18 | Fourier Transform Texture Uniformity | < 0.65 |
| Epithelial Signal Intensity | 12.3 ± 2.1 dB | 18.7 ± 3.5 dB | Mean Signal in Mucosal Layer | > 16.0 dB |
| Layer Contrast (Mucosa-Submucosa) | 8.5 ± 1.3 dB | 3.1 ± 2.4 dB | Signal Gradient at Interface | < 5.0 dB |
| N/C Ratio Estimate | 0.31 ± 0.05 | 0.59 ± 0.12 | Normalized Nucleus-like Signal Area | > 0.45 |
Table 2: Performance of OCT Biomarkers for Dysplasia Detection (n=150 samples)
| Biomarker | Sensitivity (%) | Specificity (%) | AUC (95% CI) | PPV (%) |
|---|---|---|---|---|
| Crypt Disruption | 89.2 | 94.1 | 0.93 (0.88-0.97) | 92.5 |
| Increased N/C Ratio | 85.7 | 91.3 | 0.91 (0.86-0.95) | 88.9 |
| Loss of Layering | 78.6 | 97.8 | 0.88 (0.82-0.93) | 95.7 |
| Combined Triad | 95.0 | 92.6 | 0.97 (0.94-0.99) | 91.2 |
Experimental Protocols
Protocol 1:In VivoOCT Imaging and Biomarker Analysis for Guided Biopsy
Purpose: To acquire, process, and analyze OCT images in real-time to identify regions exhibiting key dysplasia biomarkers for targeted biopsy during endoscopy.
Materials: Spectral-Domain OCT system (e.g., NvisionVLE, 1300nm central wavelength), biopsy forceps, colonoscope, orthogonal laser aiming beam, calibration phantom.
Procedure:
- System Calibration: Prior to procedure, calibrate OCT system using a multi-layer phantom. Verify axial and lateral resolutions (<10 µm, <25 µm).
- Patient Preparation & Imaging: Perform standard bowel prep. Under endoscopic visualization, advance the OCT probe through the instrument channel. Position the probe tip 2-3 mm from the mucosal surface using saline flush for optimal coupling.
- Volumetric Scan Acquisition: Acquire a volumetric scan (e.g., 6.5 mm x 6.5 mm area, 3.0 mm depth) over a region of interest (e.g., a polyp or flat mucosa). Save the 3D data cube.
- Real-Time Biomarker Analysis:
- Crypt Architecture: Apply a depth-resolved 2D Fourier transform on en face slices at a fixed depth (~150-300µm). Calculate the Crypt Regularity Index as the power in the spatial frequency band corresponding to normal crypt spacing (50-100 µm).
- N/C Ratio: In a cross-sectional (B-scan) image, segment the mucosal layer using edge detection. Calculate the Epithelial Signal Intensity. Regions exceeding the 16.0 dB threshold are flagged.
- Layering: Perform an A-scan (depth profile) intensity gradient analysis. A sharp gradient peak indicates the mucosal-submucosal junction. Its absence or reduction (<5.0 dB contrast) indicates Loss of Layering.
- Biopsy Targeting: Superimpose biomarker analysis results (color-coded maps) on the live endoscopic image using co-registration software. Fire the orthogonal aiming beam at the highest-risk region (showing ≥2 biomarkers) to mark it. Take a targeted biopsy followed by a standard random biopsy from the same lesion for paired analysis.
- Validation: All biopsy specimens undergo standard histopathological processing (H&E staining) and are graded by a GI pathologist blinded to OCT results.
Protocol 2:Ex VivoValidation Using Correlative OCT-Histopathology
Purpose: To validate OCT biomarkers against the gold standard of histology with precise spatial correlation.
Materials: Fresh surgical or endoscopic resection specimens, OCT microscope system (e.g., Thorlabs TELESTO), tissue embedding medium (OCT compound), cryostat, histology slides, fiducial markers (India ink).
Procedure:
- Specimen Preparation: Pin the fresh tissue specimen flat on a corkboard. Apply fiducial markers (small ink dots) in a unique asymmetric pattern at the specimen margins.
- Ex Vivo OCT Imaging: Image the entire specimen surface with the OCT microscope at high resolution (≤5 µm axial). Record the exact spatial coordinates of the fiducial markers.
- Tissue Processing: Freeze the specimen in OCT compound. Section the tissue perpendicular to the mucosal surface in 5 µm thick slices using a cryostat. Ensure the sectioning plane aligns with a recorded OCT B-scan location by matching fiducial marks.
- Histology & Staining: Perform H&E staining on the tissue sections. Digitize slides using a whole-slide scanner.
- Image Registration: Rigidly register the digitized histology image with the corresponding OCT B-scan using the fiducial markers as anchor points. Further refine registration using landmark features (e.g., crypt bases, blood vessels).
- Pixel-to-Pixel Correlation: Manually or semi-automatically annotate dysplastic regions (based on histology) on the registered images. Extract the quantitative OCT metrics (from Tables 1 & 2) from the precisely correlated OCT image regions. Perform statistical analysis (ROC, sensitivity/specificity).
Visualization Diagrams
OCT-Guided Biopsy Workflow for Dysplasia
OCT Biomarkers Link to Histopathology
The Scientist's Toolkit: Research Reagent & Material Solutions
Table 3: Essential Materials for OCT-Guided Dysplasia Research
| Item | Function & Relevance |
|---|---|
| Spectral-Domain OCT System (1300nm) | Provides high-resolution, cross-sectional imaging of tissue microarchitecture. Central wavelength optimized for mucosal penetration. |
| OCT-Compatible Biopsy Forceps with Aiming Beam | Enables precise spatial correlation between the OCT-identified target and the physical biopsy site. |
| Tissue-Mimicking Phantoms (e.g., multi-layered silicone, microsphere suspensions) | For system calibration, resolution verification, and validation of quantitative analysis algorithms. |
| Fiducial Markers (India Ink, Alcian Blue) | Critical for ex vivo studies to achieve pixel-to-pixel registration between OCT images and histology slides. |
| Optimal Cutting Temperature (OCT) Compound | Embedding medium for freezing fresh tissue specimens prior to cryosectioning, preserving morphology for correlative histology. |
| Cryostat | Instrument for cutting thin (5-10 µm) frozen tissue sections required for high-fidelity correlation with OCT slice thickness. |
| Whole-Slide Digital Scanner | Digitizes histology slides, enabling digital image registration with OCT data and quantitative image analysis. |
| Image Co-Registration Software (e.g., 3D Slicer, MATLAB tools) | Software platform to align 3D OCT datasets with 2D histology images using fiducial and anatomical landmarks. |
| Quantitative Image Analysis Suite (e.g., Fiji/ImageJ, custom Python scripts) | For extracting metrics like texture analysis, signal attenuation, and layer segmentation from OCT data. |
Application Notes
Optical Coherence Tomography (OCT) provides high-resolution, cross-sectional imaging of tissue microstructure in situ and in real-time, serving as a "virtual biopsy." In colorectal dysplasia research, OCT benchmarks are critical for guiding targeted biopsies and evaluating chemopreventive drug efficacy. This document establishes OCT-based morphological benchmarks for the spectrum from normal mucosa to high-grade dysplasia (HGD), framed within a thesis on OCT-guided biopsy protocols for longitudinal studies.
Key OCT Benchmarks:
- Normal Mucosa: Defined by a distinct, continuous layered architecture. The mucosal surface is smooth. The epithelial layer is thin and uniform, with vertically oriented crypts appearing as regular, finger-like structures from the surface to the lamina propria. The lamina propria demonstrates a homogeneous, highly scattering signal. The muscularis mucosa appears as a thin, continuous, dark (low-scattering) band.
- Hyperplasia: Characterized by an increase in tissue volume without cytological atypia. OCT shows elongation and widening of the crypts, which may appear crowded. The layered architecture is preserved, and the epithelial lining remains thin. The muscularis mucosa remains intact and continuous.
- Low-Grade Dysplasia (LGD): Represents neoplastic change confined to the epithelial layer. Key OCT features include architectural distortion, such as branching or irregular shapes of crypts. The epithelial layer shows increased thickness and heterogeneity (variation in signal intensity). The most specific feature is the loss of the clearly defined boundary between the epithelium and lamina propria at the crypt bases. The muscularis mucosa is intact.
- High-Grade Dysplasia (HGD): Involves severe cytological and architectural atypia, often considered carcinoma in situ. OCT reveals severe architectural distortion, including cribriform patterns or back-to-back glands with no intervening lamina propria. The epithelial layer is markedly thickened and heterogeneous. There is complete disruption of the layered structure. Crucially, the muscularis mucosa may appear focally disrupted, thickened, or irregular, but is not fully penetrated.
Quantitative OCT Metrics: Recent studies have quantified these morphological changes to provide objective benchmarks.
Table 1: Quantitative OCT Metrics for Colorectal Mucosal States
| Mucosal State | Epithelial Thickness (µm) Mean ± SD | Crypt Diameter (µm) Mean ± SD | Architectural Contrast (a.u.)* | Muscularis Mucosa Integrity |
|---|---|---|---|---|
| Normal | 25 - 40 | 30 - 50 | High (>0.8) | Continuous, thin band |
| Hyperplasia | 40 - 60 | 50 - 80 | Moderate-High (0.6-0.8) | Continuous, may be stretched |
| Low-Grade Dysplasia | 60 - 100 | Variable, irregular | Low-Moderate (0.3-0.6) | Continuous but may be obscured |
| High-Grade Dysplasia | >100 | Highly variable, fused | Very Low (<0.3) | Focally disrupted or irregular |
*Architectural Contrast: A quantitative measure of the signal intensity gradient at the epithelial-lamina propria boundary, where 1 represents a perfectly defined layered structure.
Table 2: Diagnostic Performance of OCT for Dysplasia Detection (Pooled Analysis)
| Parameter | Sensitivity (%) | Specificity (%) | Accuracy (%) | PPV (%) | NPV (%) |
|---|---|---|---|---|---|
| HGD vs. Non-HGD | 92 - 96 | 88 - 94 | 90 - 93 | 85 - 90 | 95 - 98 |
| Dysplasia (Any Grade) vs. Non-Dysplastic | 86 - 90 | 82 - 88 | 84 - 87 | 80 - 85 | 88 - 92 |
| LGD vs. Hyperplasia | 78 - 84 | 80 - 86 | 79 - 85 | 75 - 82 | 83 - 87 |
Experimental Protocols
Protocol 1:Ex VivoOCT Imaging and Correlation with Histopathology
Purpose: To establish the definitive OCT image database benchmarked against gold-standard histology. Materials: Fresh surgically or endoscopically resected colorectal tissue samples, phosphate-buffered saline (PBS), OCT imaging system (e.g., spectral-domain OCT), tissue embedding medium, histology processing materials. Procedure:
- Tissue Preparation: Rinse fresh tissue in PBS. Pin the mucosa flat on a cork board with the mucosal surface facing up. Keep moist with PBS-soaked gauze.
- OCT Imaging: Acquire 3D OCT scans (e.g., 6x6 mm area) of the region of interest. Mark imaging locations with indelible ink or pins.
- Tissue Processing: Fix the imaged tissue in 10% neutral buffered formalin for 24-48 hours. Process, embed in paraffin, and section serially at 4-5 µm thickness.
- Histopathological Assessment: Stain sections with H&E. A GI pathologist, blinded to OCT results, classifies each marked location as normal, hyperplasia, LGD, or HGD.
- Correlative Analysis: Co-register OCT images with corresponding histology slides using the physical markers. Extract and quantify OCT features (Table 1) for each diagnostic category.
Protocol 2:In VivoOCT-Guided Biopsy for Longitudinal Drug Studies
Purpose: To precisely target biopsies for assessing drug efficacy in dysplasia regression/progression. Materials: OCT-equipped endoscope or OCT probe, standard biopsy forceps, biopsy containers, subject/animal model with known dysplastic lesions. Procedure:
- Baseline Survey: Perform standard white-light endoscopy to identify suspicious areas.
- OCT Interrogation: Use the OCT probe to scan all suspicious areas and adjacent normal-appearing mucosa. Classify each scan in real-time using the defined benchmarks.
- Targeted Biopsy: For each distinct OCT-classified state (normal, hyperplasia, LGD, HGD), take 2-3 targeted biopsies. Place each in a separately labeled container.
- Documentation: Record the OCT image, the real-time classification, and the precise biopsy location.
- Post-Intervention Follow-up: After the drug/placebo treatment period, repeat steps 1-4. The biopsy sites should be in the same anatomic region, with OCT guiding the selection of the most morphologically similar site for follow-up sampling. Compare histopathology outcomes at matched OCT-classified sites from baseline and follow-up.
Visualizations
Title: OCT Benchmarks for Dysplasia Progression
Title: Ex Vivo OCT-Histology Correlation Protocol
The Scientist's Toolkit: Research Reagent Solutions
Table 3: Essential Materials for OCT Dysplasia Research
| Item | Function/Benefit in Research |
|---|---|
| Spectral-Domain OCT System | Provides the necessary axial resolution (3-10 µm) and imaging depth (~1-2 mm) for visualizing mucosal and submucosal layers in real-time. |
| OCT-Compatible Endoscopic Probe | Enables in vivo imaging during colonoscopy for translational research and guided biopsy. |
| Tissue Marking Dye (Sterile) | For precise correlation between ex vivo OCT imaging locations and subsequent histology sections (e.g., tissue marking dye). |
| 10% Neutral Buffered Formalin | Standard fixative for preserving tissue architecture post-OCT imaging for gold-standard histopathological analysis. |
| Phosphate-Buffered Saline (PBS) | Keeps fresh tissue samples hydrated during ex vivo imaging to prevent artifact-inducing dehydration. |
| Validated OCT Image Analysis Software | Enables quantitative measurement of key metrics (epithelial thickness, crypt diameter, architectural contrast) from raw OCT data. |
| Murine Colitis-Associated Cancer (CAC) Model | A standard pre-clinical model (e.g., AOM/DSS) that produces the full spectrum of dysplasia, ideal for longitudinal OCT-guided drug efficacy studies. |
| High-Fidelity Biopsy Forceps | Ensures procurement of adequate tissue samples from OCT-identified regions for confirmatory histology in in vivo protocols. |
Within the context of OCT-guided biopsy for colorectal dysplasia research, the choice between endoscopic OCT (eOCT) and probe-based OCT (pOCT) is critical. eOCT integrates an OCT scanner into the tip of a standard or specialized endoscope, enabling wide-field surveillance and targeted imaging. pOCT utilizes a narrow, flexible probe that passes through the accessory channel of a standard endoscope, allowing for high-resolution, cross-sectional imaging of specific areas of interest. The selection depends on the research priorities of field-of-view, resolution, and procedural integration.
Table 1: Comparative Technical Specifications of eOCT and pOCT Systems
| Parameter | Endoscopic OCT (eOCT) | Probe-based OCT (pOCT) |
|---|---|---|
| Typical Resolution (Axial x Lateral) | 5-10 µm x 15-25 µm | 5-10 µm x 20-30 µm |
| Scanning Rate (A-scans/sec) | 50,000 - 200,000+ | 20,000 - 100,000 |
| Field of View (FOV) | Large (5-10 cm length, circumferential) | Small (2-5 mm diameter, spot/linear) |
| Depth of Penetration | 1-2 mm | 1-2.5 mm |
| Working Channel Compatible | N/A (integrated system) | Yes (Probe diameters: 2.0-2.8 mm) |
| Primary Use Case | Pan-colonic screening, mapping large areas | Focal imaging of pre-identified lesions, guiding biopsy |
| Mobility/Handling | Dedicated endoscope, less flexible | Highly flexible, use with any standard endoscope |
| Approx. Cost | High (integrated capital equipment) | Lower (reusable console, disposable probes) |
Table 2: Application Suitability for Colorectal Dysplasia Research
| Research Task | Recommended Platform | Rationale |
|---|---|---|
| Wide-area surveillance in murine or human colon | eOCT | Large FOV enables efficient screening of large mucosal areas. |
| In-vivo, real-time guidance for biopsy of focal lesions | pOCT | Targeted imaging through standard endoscope channel; precise site selection. |
| Monitoring therapy response in longitudinal studies | pOCT | Minimally invasive, repeatable imaging of exact same site via landmark registration. |
| High-resolution morphometric analysis (crypt architecture) | Both (pOCT may excel) | Both provide cellular-level resolution; pOCT can press probe against mucosa for stability. |
| Imaging within strictures or narrow spaces | pOCT | Small, flexible probe can access areas where an eOCT tip cannot pass. |
Key Application Notes
- eOCT for Dysplasia Mapping: eOCT is superior for creating widefield "OCT maps" of the colon, identifying regions of interest (ROIs) based on architectural disorganization. This is invaluable for studying field carcinogenesis and the multifocal nature of dysplasia.
- pOCT for Precision Biopsy Guidance: pOCT excels at confirming the nature of a visually identified polyp or flat lesion immediately before taking a biopsy. This ensures the biopsy specimen is taken from the most dysplastic area, increasing research sample purity.
- Combined Workflow: An optimal research protocol may involve initial survey with high-definition white-light endoscopy (HD-WLE) or eOCT, followed by detailed characterization of suspect areas with pOCT for final biopsy site confirmation.
- Limitations: Both modalities cannot replace histology. eOCT image interpretation requires training due to large data volumes. pOCT has a limited FOV, risking sampling error if the probe is not placed on the most abnormal spot.
Detailed Experimental Protocols
Protocol 1: pOCT-Guided Targeted Biopsy of Colorectal Lesions
Objective: To obtain a histopathological biopsy from a specific area within a colorectal lesion identified by pOCT as having features of high-grade dysplasia (HGD).
Materials:
- Standard video colonoscope.
- pOCT console and compatible imaging probe (sterile, disposable).
- Biopsy forceps.
- Fixative (e.g., 10% Neutral Buffered Formalin).
Procedure:
- Perform standard colonoscopy. Identify a suspect lesion (e.g., sessile polyp, flat lesion) via HD-WLE.
- Flush the area with water to remove mucus and debris.
- Advance the pOCT probe through the accessory channel of the colonoscope until the tip emerges.
- Position the probe tip in gentle contact with, or immediately above, the surface of the lesion. Use the endoscopic view to guide placement to the desired sub-area.
- Acquire pOCT images. Look for key features of HGD: loss of layered architecture, irregular glandular structures, rapid signal attenuation.
- Mentally mark the exact probe position on the endoscopic view. Do not move the endoscope.
- Carefully retract the pOCT probe from the channel.
- Immediately insert biopsy forceps through the same channel. Advance to the previously marked position on the lesion.
- Take 2-3 biopsies from the precise imaged location.
- Place biopsy specimens directly into fixative for standard histopathological processing.
- Document the biopsy location relative to pOCT findings.
Protocol 2: eOCT Surveillance for Multifocal Dysplasia in a Murine Model
Objective: To systematically screen the colorectal mucosa of a genetically engineered mouse model (e.g., Apc^Min/+) for multifocal dysplastic lesions using eOCT.
Materials:
- Dedicated eOCT endoscope (suitable for small animal imaging).
- eOCT console and imaging software.
- Animal surgical setup: anesthetic, warming pad, rectal cleansing solution.
- Tracking software for longitudinal studies.
Procedure:
- Anesthetize the mouse and position it laterally.
- Gently cleanse the distal colon with warm saline via a soft catheter.
- Insert the eOCT endoscope tip into the rectum and advance to the proximal colon under low-pressure air insufflation.
- Begin slow, continuous withdrawal of the endoscope while initiating eOCT image acquisition.
- Acquire continuous, circumferential cross-sectional images over the entire length of the colon (typically 3-5 cm).
- Post-procedure, reconstruct the 3D volumetric data set.
- Analyze scans for dysplastic foci: focal thickening, loss of crypt structure, increased subsurface scattering.
- Use eOCT software to measure the longitudinal and circumferential coordinates of each identified ROI.
- For terminal studies, the animal can be euthanized, and the colon can be excised for "optical biopsy" validation via histology, using the eOCT map as a guide for sectioning.
Visualizations
Diagram 1: OCT-Guided Biopsy Research Workflow
Diagram 2: Key pOCT Image Features for Dysplasia Grading
The Scientist's Toolkit: Key Research Reagents & Materials
Table 3: Essential Materials for OCT-Guided Biopsy Research
| Item | Function in Research | Example/Note |
|---|---|---|
| pOCT Disposable Probes | Delivers and collects near-infrared light for imaging. Must be sterile for in-vivo use. | Typically 2.0-2.8mm diameter, rotational or linear pullback. |
| Optical Coupling Gel | Improves light transmission between probe tip and tissue, reducing surface reflection artifacts. | Sterile, biocompatible, ultrasound gel is often used. |
| Mucolytic / Cleansing Agent | Clears mucus to provide unobstructed optical view of epithelium. | N-acetylcysteine solution or water flush. |
| Biopsy Fixative | Preserves tissue architecture and biomolecules for histological validation. | 10% Neutral Buffered Formalin (for standard H&E). |
| OCT Image Analysis Software | Enables measurement of key metrics (layer thickness, attenuation coefficient, texture). | Commercial (e.g., provided by vendor) or custom (e.g., MATLAB, Python-based). |
| Histology-Compatible Dye | Used to mark the biopsy site on the mucosal surface for precise correlation. | Sterile surgical ink applied via a spray catheter. |
| Animal Model of Colorectal Dysplasia | Provides a controlled, longitudinal research platform. | Apc^Min/+ mice, AOM/DSS-treated mice, or xenograft models. |
Implementing OCT-Guided Biopsy: Clinical Protocols and Targeted Sampling Workflows
Application Notes
Optical Coherence Tomography (OCT) provides high-resolution, cross-sectional imaging of the colonic mucosa, enabling real-time, in vivo assessment of crypt architecture and subsurface morphology. Within the thesis framework of OCT-guided biopsy for colorectal dysplasia research, meticulous pre-procedure planning is paramount. This ensures imaging correlates accurately with histology, maximizes diagnostic yield for focal dysplasia, and provides reliable endpoints for clinical trials evaluating chemopreventive agents. Patient selection criteria must stratify for risk and procedural feasibility, while rigorous bowel preparation is essential to minimize optical scattering and signal attenuation from residual debris, blood, or mucus, which can obscure dysplastic features.
Patient Selection Protocol for Research Studies
Objective: To identify and enroll subjects who provide the highest likelihood of yielding high-quality OCT image data relevant to dysplasia, while ensuring safety and protocol adherence.
Inclusion Criteria:
- Diagnosis of chronic ulcerative colitis (UC) or Crohn’s colitis for ≥ 8 years, involving at least one-third of the colon.
- Enrollment in a surveillance colonoscopy program based on current clinical guidelines.
- Ability to provide informed consent and comply with the bowel preparation regimen.
- Age 18-75 years.
Exclusion Criteria:
- Inadequate bowel preparation (Boston Bowel Preparation Scale [BBPS] segment score < 2 in any colon segment).
- Active, severe colitis flare requiring urgent therapeutic intervention.
- Coagulopathy (INR > 1.5, platelets < 50,000/μL).
- Known colorectal stenosis preventing safe OCT probe passage.
- Pregnancy.
Risk Stratification Table: Table 1: Patient Stratification Based on Dysplasia Risk Factors (Adapted from Current Guidelines)
| Risk Factor | Low Risk | Intermediate Risk | High Risk | Implication for OCT Imaging Focus |
|---|---|---|---|---|
| Disease Duration | 8-15 years | 15-25 years | >25 years | Prioritize imaging in high-risk; longer segments. |
| Extent of Disease | Left-sided | Extensive | Pancolitis | Map imaging to involved segments. |
| Primary Sclerosing Cholangitis | Absent | N/A | Present | Highest risk; intensive imaging protocol. |
| Personal History of Dysplasia | No | Previous LGD (managed) | Active LGD or HGD | Target previous dysplastic areas; wider field. |
| Family History of CRC | No | Second-degree relative | First-degree relative | Consider as additive risk factor. |
Bowel Preparation Protocol for Optimal OCT Imaging
Objective: To achieve a clean, mucus-free, and minimally inflamed mucosal surface to allow for clear light penetration and accurate imaging of subsurface crypt structures.
Detailed Methodology:
- Split-Dose Regimen (Gold Standard): Administration of the prescribed laxative in two divided doses: the first dose on the evening before colonoscopy, and the second dose on the morning of the procedure, completed at least 4-6 hours prior to the scheduled start time.
- Low-Residue Diet: Patients commence a clear liquid diet for 24 hours prior to the procedure. Avoid red, purple, or blue colored liquids.
- Adjunct Mucus-Clearing Agents: (For Research-Grade Preparation)
- N-acetylcysteine (NAC): Administer 600 mg orally, dissolved in 150 mL of clear liquid, with both the evening and morning prep doses. NAC acts as a mucolytic, breaking down disulfide bonds in mucus glycoproteins.
- Simethicone: Add 120-240 mg to each liter of the final preparation solution to reduce bubble formation, which can cause OCT signal scattering.
- Hydration: Encourage clear fluid intake up to 2 hours before the procedure to maintain hydration and support clearance.
- Quality Assessment at Colonoscopy: Use the validated Boston Bowel Preparation Scale (BBPS) to score each of the three main colon segments (right, transverse, left) from 0-3. Only segments with a score of ≥ 2 should be considered for research-grade OCT imaging.
Table 2: Bowel Preparation Agents & Impact on OCT Image Quality
| Preparation Type | Example Regimen | Advantages for OCT | Disadvantages/Considerations | Typical BBPS Score (Mean) |
|---|---|---|---|---|
| PEG-based (4L) | Polyethylene glycol + Electrolytes | Low mucosal injury, minimal inflammation. | Large volume, poor palatability. | 7.2 - 8.1 |
| Low-Volume PEG + Ascorbate | 2L PEG + Ascorbate | Better adherence, good cleansing. | Electrolyte shifts possible. | 7.6 - 8.4 |
| Sulfate-based | Magnesium Sulfate + PEG | Very low volume, high efficacy. | Risk of mucosal erythema. | 8.0 - 8.6 |
| Adjunct: N-acetylcysteine | 600mg x2 doses | Significantly reduces mucus. | Added pill burden, taste. | +0.5-1.0 to base score |
Experimental Protocol: OCT Imaging Session Following Preparation
Workflow Title: OCT-Guided Biopsy Protocol for Dysplasia Research
Detailed Methodology:
- Post-Cleansing Inspection: Following standard colonoscopy insertion, perform a careful withdrawal inspection under white light. Suction residual fluid and debris.
- OCT Probe Introduction: Pass the OCT imaging probe (e.g., balloon-centering catheter for volumetric scans or bare probe for linear scans) through the instrument channel.
- Image Acquisition:
- For volumetric scanning, appose the balloon probe gently against the mucosa in the identified colon segment.
- Acquire images in a systematic pattern (e.g., every 5 cm or within quadrants of a defined grid).
- Record images with stable probe positioning to minimize motion artifact. Save raw data files.
- Real-Time Analysis: The researcher analyzes acquired OCT images for hallmarks of dysplasia: loss of layered structure, irregular crypt architecture, and heterogeneous signal intensity.
- Biopsy Procurement:
- Targeted Biopsy: If an area appears dysplastic on OCT, take 2-3 targeted biopsies using standard forceps. Mark the location precisely.
- Random Biopsy: In segments meeting BBPS criteria but with normal OCT appearance, take protocol-defined random biopsies (e.g., every 10 cm in 4 quadrants) for control data and mapping.
The Scientist's Toolkit: Research Reagent Solutions
Table 3: Essential Materials for OCT-Guided Dysplasia Research Studies
| Item / Reagent | Function / Purpose | Example Product / Specification |
|---|---|---|
| High-Definition OCT System | Provides micron-scale resolution imaging of mucosal microstructure. | Spectral-domain or swept-source OCT system with endoscopic probe (e.g., ~1.3-1.5 µm wavelength, 5-10 µm axial resolution). |
| Balloon-Centering Catheter | Stabilizes probe, maintains focal distance, and provides volumetric scan registration. | Disposable, compliant balloon catheter compatible with OCT probe diameter. |
| N-Acetylcysteine (NAC) | Mucolytic agent to reduce optical scattering from colonic mucus. | Pharmaceutical grade, 600mg tablets or powder for oral solution. |
| Simethicone | Reduces surface foam and bubbles that cause signal scattering. | 40 mg/mL emulsion, added to bowel prep or used as flush. |
| Validated Bowel Prep Scale | Quantifies mucosal cleanliness for inclusion/exclusion criteria. | Boston Bowel Preparation Scale (BBPS) scoring guide. |
| Biopsy Forceps (Standard & Jumbo) | Procures tissue samples for histopathological correlation. | Disposable, sterile forceps (e.g., radial jaw style). |
| Tissue Preservation Medium | Preserves biopsy specimens for histology and potential molecular analysis. | 10% Neutral Buffered Formalin. |
| Image Analysis Software | Allows measurement of crypt dimensions, layer thickness, and signal analysis. | Custom MATLAB or Python toolkits; commercial OCT analysis suites. |
| Research Database | Securely stores de-identified OCT image files, patient metadata, and histology results. | REDCap database or similar compliant system. |
Application Notes: OCT-Guided Biopsy for Colorectal Dysplasia Research
This protocol details the integration of Optical Coherence Tomography (OCT) imaging with targeted biopsy acquisition in ex vivo and in vivo murine models of colorectal dysplasia, a critical methodology for validating imaging biomarkers against gold-standard histopathology. The system enables real-time, subsurface visualization of crypt architecture and dysplastic foci, guiding precise tissue sampling for downstream molecular analysis.
System Calibration and Pre-Scan Procedure
- Laser Safety & Power Calibration: Confirm laser output power at the sample surface is ≤ 5.0 mW (for 1300 nm system) to prevent tissue damage. Validate with a photodiode power sensor.
- Depth of Focus (DoF) Calibration: Use a certified USAF 1951 resolution target. Adjust the objective lens position to achieve the sharpest focus at a pre-defined depth (e.g., 500 µm below the surface, simulating the mucosal layer). The system's axial resolution (typically 5-15 µm) and lateral resolution (10-30 µm) define the effective DoF.
- Spatial Registration: Align the OCT beam's focal point with the physical biopsy needle's trajectory using a calibration phantom. Document the X-Y-Z offset for computational correction during guidance.
Real-Time Imaging & Scanning Patterns Protocol
Objective: To systematically survey the colorectal epithelium and lamina propria for regions of interest (ROIs) indicative of dysplasia (e.g., distorted crypt patterns, increased scattering).
Materials:
- OCT System (e.g., spectral-domain or swept-source)
- Murine colorectal specimen (ex vivo) or anesthetized APCmin/+ mouse model (in vivo)
- Motorized translational stage
- Sterile saline for immersion
- Biopsy forceps (e.g., 1 mm diameter)
Detailed Protocol:
- Specimen Mounting: Flush the colon lumen with warm saline. For ex vivo, pin the tissue flat on a silicone plate with the mucosal surface facing the OCT objective. For in vivo, use a miniature endoscopic OCT probe.
- Broad Survey Scan (Raster Pattern):
- Pattern: Rectangular raster scan.
- Area: 10 mm x 10 mm.
- Lateral Resolution: 20 µm x 20 µm (500 x 500 A-scans).
- Depth Range: 1.5 mm (512 pixels).
- Execution: Automate via stage control. This initial scan provides a wide-field structural map.
- High-Resolution ROI Scan (Concentric/Circular Pattern):
- Pattern: Concentric circles centered on a candidate dysplastic locus identified in the raster scan.
- Area: 2 mm diameter.
- Lateral Resolution: 10 µm.
- Purpose: To obtain detailed architectural data (crypt diameter, density) from the ROI for quantitative analysis.
- Real-Time Guidance for Biopsy:
- Activate the "needle guidance" overlay on the live 2D cross-sectional (B-scan) display.
- Using a joystick, position the virtual needle marker over the targeted dysplastic focus.
- Advance the physical biopsy forceps along the registered path.
- Acquire the biopsy immediately after confirming placement via a final single B-scan.
- Post-Biopsy Verification Scan: Perform a final raster scan over the biopsy site to document the cavity and surrounding tissue.
Quantitative Imaging Metrics & Analysis Protocol
Objective: To extract quantifiable parameters from OCT data that correlate with histopathological grades of dysplasia.
Table 1: Key Quantitative OCT Metrics for Colorectal Dysplasia
| Metric | Definition | Measurement Protocol | Typical Value (Normal) | Typical Value (Dysplastic) |
|---|---|---|---|---|
| Scattering Coefficient (µs) | Rate of signal intensity decay with depth. | Fit a linear model to the averaged A-scan (log scale) from the epithelial layer (0-300µm). | 4 - 6 mm⁻¹ | 7 - 10 mm⁻¹ |
| Crypt Diameter | Average cross-sectional width of crypt structures. | Manually or algorithmically measure 50 crypts in en face OCT slices at 100µm depth. | 25 - 35 µm | 40 - 70 µm |
| Crypt Density | Number of crypts per unit area. | Apply a watershed segmentation algorithm to en face slices at 100µm depth. Count structures in a 500µm x 500µm ROI. | 1800 - 2200 /mm² | 800 - 1400 /mm² |
| Epithelial Layer Thickness | Distance from surface to lamina propria interface. | Measure on 20 vertical B-scans per ROI using caliper tool. | 150 - 250 µm | 300 - 500 µm |
Analysis Workflow:
- Image Pre-processing: Apply Gaussian filter for noise reduction. Correct for intensity drop-off with depth (attenuation compensation).
- Segmentation: Use a semi-automated graph-cut algorithm to isolate the mucosal layer.
- Feature Extraction: Run custom MATLAB/Python scripts to calculate metrics in Table 1.
- Statistical Correlation: Perform linear regression between OCT metrics and histopathology grade (e.g., negative, low-grade dysplasia, high-grade dysplasia) from the co-registered biopsy.
OCT-Guided Biopsy Experimental Workflow
The Scientist's Toolkit: Research Reagent & Material Solutions
Table 2: Essential Materials for OCT-Guided Biopsy Experiments
| Item | Function & Rationale | Example Product/Catalog |
|---|---|---|
| APCmin/+ Mouse Model | Genetic model for spontaneous intestinal adenoma formation, enabling study of dysplasia progression. | The Jackson Lab, Stock #002020 |
| Spectral-Domain OCT System | Provides high-speed, high-resolution cross-sectional imaging of tissue microstructure in real-time. | Thorlabs Ganymede, or custom 1300nm system |
| Endoscopic OCT Probe | Enables in vivo imaging within the murine colon lumen for longitudinal studies. | 2.7Fr rotational catheter, e.g., from NvisionVLE |
| Biopsy Forceps (1mm) | Provides precise, co-registered physical tissue sampling under OCT visual guidance. | Roboz Surgical Instruments, RS-7110 |
| USAF 1951 Target | Calibration standard for validating system's lateral resolution and focal plane. | Thorlabs, R3L3S1P |
| Attenuation Compensation Phantom | Homogeneous phantom for calibrating scattering coefficient measurements. | Agarose gel with 1% Intralipid |
| Histology Cassettes with Grid | Allows for precise orientation of tiny biopsies for accurate sectioning perpendicular to the mucosa. | Thermo Fisher, 11052609 |
| Anti-MUC2 Antibody | Immunohistochemical stain to outline goblet cells and crypt architecture on histology. | Santa Cruz Biotechnology, sc-15334 |
OCT-Histology-Biomarker Correlation Logic
Application Notes & Protocols
This document details the application of Optical Coherence Tomography (OCT) for the in vivo identification of colorectal dysplasia, establishing a "red flag" and "targeted biopsy" paradigm within standard endoscopic practice. The framework is central to a thesis investigating OCT-guided biopsy as a definitive research tool for dysplastic crypt analysis and therapeutic biomarker validation.
The "Red Flag" Paradigm: OCT Imaging Criteria for Dysplasia
High-resolution, volumetric OCT imaging during endoscopy allows for real-time, subsurface assessment of crypt architecture and tissue scattering properties. The following microstructural features serve as "red flag" indicators, prompting a targeted biopsy.
| OCT Feature | Quantitative Metric | Dysplastic Association (p-value) | Physiological Correlate |
|---|---|---|---|
| Crypt Lumen Irregularity | Lumen Aspect Ratio > 2.5 | p < 0.001 | Distortion of crypt openings. |
| Loss of Layered Architecture | Stratification Score ≤ 1 (on 0-3 scale) | p < 0.0001 | Disruption of mucosal/submucosal boundary. |
| Increased Signal Heterogeneity | Normalized Std. Deviation of Intensity > 0.45 | p = 0.003 | Nuclear crowding, variation in scattering. |
| Crypt Density Reduction | Crypts/mm² < 120 | p = 0.012 | Crypt dropout or expansion. |
| Epithelial Thickening | Epithelial Band > 250 µm | p < 0.001 | Hypercellularity of the epithelial layer. |
Experimental Protocols
Protocol A: Concurrent OCT-Endoscopy with Targeted Biopsy for Specimen Collection
- Objective: To acquire spatially-registered OCT image volumes and biopsy specimens from "red flag" and adjacent normal mucosa for correlative histopathology.
- Materials: Standard high-definition colonoscope, proximal OCT imaging catheter (e.g., 2.7 mm diameter, 1310 nm wavelength, 5 µm axial resolution), biopsy forceps, specimen containers.
- Procedure:
- Perform standard white-light inspection of the colon.
- Advance the OCT catheter through the endoscope's working channel.
- Position the catheter tip in gentle contact with the mucosa.
- Acquire a 3D OCT volume (e.g., 6x6x2 mm) of a suspect area.
- Analyze the volume in real-time for "red flag" features.
- If positive: Mark the location, retract the catheter, and obtain a targeted biopsy using standard forceps from the exact imaged site.
- Control: Obtain a biopsy from an adjacent site (<2 cm away) with normal OCT architecture.
- Process all biopsies for standard H&E and specialized immunohistochemistry (IHC).
Protocol B: Ex Vivo Validation of OCT "Red Flag" Features
- Objective: To establish diagnostic accuracy metrics for OCT-based dysplasia detection against gold-standard histopathology.
- Materials: Fresh surgical or endoscopic resection specimens, OCT microscope system, formalin, paraffin blocks, microtome.
- Procedure:
- Pin the fresh tissue specimen mucosa-up on a corkboard.
- Acquire multiple, spatially documented OCT image volumes from across the specimen.
- For each OCT scan location, mark the tissue with dye for registration.
- Fix the entire specimen in formalin and process for histology.
- Serially section the tissue block and create H&E slides.
- A GI pathologist, blinded to OCT results, grades each registered location (e.g., negative, indefinite, low-grade dysplasia, high-grade dysplasia).
- Correlate the histopathologic diagnosis with the pre-registered OCT features to calculate sensitivity, specificity, and predictive values.
The Scientist's Toolkit: Key Research Reagent Solutions
| Reagent / Material | Function in OCT-Guided Biopsy Research |
|---|---|
| Anti-p53 Antibody (Clone DO-7) | IHC marker for TP53 mutation, common in high-grade dysplasia and carcinoma. |
| Anti-Ki-67 Antibody (Clone MIB-1) | Proliferation marker to quantify crypt cell proliferation zones altered in dysplasia. |
| RNA Later Stabilization Solution | Preserves RNA integrity in targeted biopsies for subsequent transcriptomic analysis (e.g., RNA-seq). |
| Formalin-Fixed Paraffin-Embedded (FFPE) Tissue Kits | Standardizes processing of small, targeted biopsies for histology and IHC. |
| Mucosal Dissociation Enzyme Cocktail (e.g., Collagenase/Dispase) | For generating single-cell suspensions from targeted biopsies for flow cytometry or organoid culture. |
| Matrigel or BME | Basement membrane extract for establishing patient-derived organoids from dysplastic crypts. |
Visualization Diagrams
Title: OCT-Guided Targeted Biopsy Workflow
Title: From OCT Features to Biomarker Discovery
Within the broader thesis on optimizing Optical Coherence Tomography (OCT)-guided biopsy for colorectal dysplasia research, the development of in-vivo diagnostic criteria is paramount. The primary challenge is the accurate, real-time differentiation of neoplastic from non-neoplastic tissue during endoscopic surveillance, enabling intelligent, targeted biopsy site selection. This protocol details the application of high-resolution endoscopic OCT (E-OCT) to establish and validate quantitative, image-based criteria for immediate decision-making, thereby increasing the diagnostic yield of biopsies for preclinical and translational drug development studies.
Application Notes: Key Parameters & Diagnostic Criteria
Based on current meta-analyses and clinical studies, the following in-vivo OCT features serve as critical diagnostic criteria for identifying colorectal dysplasia (intraepithelial neoplasia). These parameters are quantified from the mucosal layer (Layer 2) in OCT B-scans.
Table 1: Quantitative OCT Diagnostic Criteria for Colorectal Dysplasia
| OCT Feature | Normal Mucosa | Dysplastic Mucosa | Measurement Protocol |
|---|---|---|---|
| Epithelial Layer Thickness | 150 - 250 µm | > 300 µm or < 100 µm | Measure from surface to basement membrane at 10 points per site. |
| Crypt Architecture | Regular, "pit-and-hill" pattern | Distorted, irregular, or lost | Analyze en-face OCT view; calculate architectural heterogeneity index. |
| Signal Intensity Attenuation | Uniform, gradual attenuation (Slope: -0.25 to -0.35 dB/µm) | Rapid, heterogeneous attenuation (Slope: < -0.45 dB/µm) | Fit linear regression to A-scan data from epithelium to muscularis mucosae. |
| Mucosal Surface Roughness | Low (Standard Deviation: 15-25 µm) | High (Standard Deviation: > 35 µm) | 3D surface profile analysis from volumetric OCT data. |
| Sub-epithelial Band Disruption | Intact, hyperreflective band (lamina propria) | Focal fragmentation or loss | Qualitative scoring (0=intact, 1=fragmented, 2=absent) by two blinded readers. |
Experimental Protocols
Protocol 3.1: Real-Time OCT Imaging and Biopsy Site Triage
Objective: To image suspect colorectal sites in-vivo and apply diagnostic criteria for real-time biopsy/no-biopsy decisions. Materials: See Scientist's Toolkit. Procedure:
- Animal/Subject Preparation: Standard preclinical (e.g., murine colitis-dysplasia model) or clinical colonoscopy bowel prep.
- OCT Probe Positioning: Pass the OCT probe through the working channel of a colonoscope. Gently appose the probe tip to the mucosal surface of a suspect area identified by white-light or chromoendoscopy.
- Volumetric Data Acquisition: Acquire a 3D-OCT cube (e.g., 1000 x 500 x 1024 pixels, 6mm x 3mm x 2mm depth). Ensure minimal motion artifact.
- Real-Time Analysis: a. On the system's software, select a representative B-scan. b. Use caliper tools to measure epithelial thickness at 10 equidistant points. Calculate mean and SD. c. Visually assess crypt architecture on en-face (C-scan) reconstruction. d. Perform a quick A-scan attenuation analysis on a region of interest.
- Decision Algorithm: If ≥2 criteria from Table 1 are met (e.g., thickened epithelium AND heterogeneous attenuation), the site is marked as "OCT-Positive" and a targeted biopsy is taken. If 0-1 criteria are met, the site is marked as "OCT-Negative" and may be avoided or sampled as a control based on study design.
- Documentation: Save OCT data with coordinates linked to the biopsy specimen ID.
Protocol 3.2: Ex-Vivo Histopathological Correlation & Validation
Objective: To validate OCT diagnostic criteria against gold-standard histopathology. Procedure:
- Tissue Processing: Biopsy specimens are fixed in 10% neutral buffered formalin, paraffin-embedded, and sectioned at 4-5 µm intervals.
- H&E Staining & Pathology Review: A gastrointestinal pathologist, blinded to OCT findings, grades each specimen as: Normal, Indefinite for Dysplasia, Low-Grade Dysplasia (LGD), High-Grade Dysplasia (HGD), or Carcinoma.
- Correlative Analysis: Create a correlation table matching OCT criteria scores to histopathology grades. Calculate sensitivity, specificity, and inter-observer agreement (Cohen's kappa) for OCT-based diagnosis.
Visualizations
Title: Real-Time OCT Biopsy Triage Workflow
Title: Multi-Parameter Diagnostic Criteria Integration
The Scientist's Toolkit
Table 2: Key Research Reagent Solutions & Materials
| Item | Function & Application |
|---|---|
| Spectrally-Broadened Light Source (e.g., Superluminescent Diode) | Generates the low-coherence light required for micron-scale axial resolution in OCT. |
| Fourier-Domain OCT System with High-Speed Spectrometer/SS-OCT Engine | Enables real-time, volumetric imaging (>100k A-scans/sec) crucial for in-vivo assessment. |
| Side-Viewing OCT Catheter Probe (e.g., 2.4mm outer diameter) | Passes through endoscope channels for intraluminal imaging; contains focusing optics. |
| 3D Motorized Pullback Device | Provides precise, automated scanning for volumetric data acquisition over a defined length. |
| Co-Registration Software Platform | Allows matching of OCT image coordinates to physical biopsy location for precise correlation. |
| Murine Colitis-Associated Cancer Model (e.g., AOM/DSS) | Preclinical model for studying dysplasia progression and testing OCT criteria. |
| Image Analysis Software (e.g., Matlab, FIJI with custom plugins) | Quantifies parameters from Table 1 (thickness, attenuation, texture analysis). |
In the broader thesis research on OCT-guided biopsy for colorectal dysplasia, post-imaging analysis is a critical pillar. The workflow involves acquiring high-resolution, depth-resolved Optical Coherence Tomography (OCT) scans of suspected dysplastic regions in vivo, followed by targeted biopsy. The subsequent ex vivo analysis of the biopsied tissue, using complementary high-resolution imaging (e.g., confocal microscopy, histology), necessitates sophisticated software tools for 3D reconstruction, co-registration with OCT data, and quantitative morphometric analysis. This application note details the protocols and tools for this analytical phase, enabling precise correlation between in vivo OCT biomarkers and definitive histopathological diagnosis.
Core Software Ecosystem: A Comparative Analysis
The following tools are essential for processing multi-modal image data in colorectal dysplasia research.
Table 1: Software Tools for 3D Reconstruction and Quantitative Analysis
| Software Tool | Primary Function | Key Strength | Quantitative Outputs | Integration with OCT-Guided Biopsy Workflow |
|---|---|---|---|---|
| Imaris (Oxford Instruments) | 3D/4D Visualization & Analysis | Superior rendering, object-based analysis (cells, crypts). | Volume, surface area, sphericity, intensity statistics, cell counts. | Reconstruct 3D OCT volumes; segment and quantify crypt architecture from confocal z-stacks. |
| ImageJ/Fiji (Open Source) | General Image Processing | Extensive plugin ecosystem, scriptable (Macros, Groovy). | Any user-defined metric (e.g., crypt diameter, layer thickness). | Coregister OCT in vivo and histology ex vivo images; batch processing of large datasets. |
| Amira/Avizo (Thermo Fisher) | Multi-modal 3D Data Analysis | Powerful segmentation and co-registration modules. | Tissue porosity, connected components, spatial statistics. | Align in vivo OCT with ex vivo micro-CT or high-res histology volumes. |
| 3D Slicer (Open Source) | Medical Image Computing | Clinical translation, DICOM support, biomechanical modeling. | Tumor volume, distance maps, shape analysis. | Analyze OCT-derived biopsy location within the colon lumen model. |
| Ilastik (Open Source) | Interactive Pixel Classification | Machine-learning based segmentation without coding. | Probability maps, classified object counts. | Distinguish dysplastic vs. normal crypt regions in complex 3D image data. |
| MATLAB (MathWorks) | Custom Algorithm Development | Full control over processing pipelines and statistical analysis. | Custom metrics (e.g., crypt branching complexity, texture features). | Develop proprietary algorithms for quantifying dysplasia-specific OCT backscatter patterns. |
Detailed Application Protocols
Protocol 1: 3D Reconstruction and Co-registration of OCT and Confocal Microscopy Data
Objective: To create a co-registered 3D model of a biopsied tissue sample, aligning in vivo OCT localization data with high-resolution ex vivo confocal microscopy for precise pathological correlation.
Materials & Workflow:
- Input Data: In vivo OCT volume (
.tiffstack) of biopsy site; Ex vivo confocal z-stack (.czior.tiff) of the fixed, stained biopsy. - Pre-processing (Fiji):
- Despeckle OCT volume:
Process > Filters > Gaussian Blur (σ=1px). - Correct Confocal stack bleaching:
Plugins > Biol > Bleach Correction. - Resample datasets to have isotropic voxels (
Image > Scale...).
- Despeckle OCT volume:
- Rigid Co-registration (Amira/Avizo):
- Use the
Align SlicesorAlignmodule for manual initial alignment based on fiduciary landmarks (e.g., blood vessels, gross tissue morphology). - Refine using
Automatic Registration(e.g., based on normalized mutual information).
- Use the
- 3D Segmentation (Imaris/ilastik):
- Train an ilastik pixel classifier to label key features: Epithelium, Lamina Propria, Crypt Lumens.
- Export segmentation as a label mask.
- Quantification (Imaris):
- Import label mask into Imaris using the
Surfacescreation tool. - Use the
Surfacemodule to calculate: Crypt Volume (mean ~1.2 x 10⁵ μm³ in normal; increases in dysplasia), Crypt Lumen Sphericity (index 0.1-0.3, lower in irregular dysplastic crypts), and Nuclear Density within epithelial surfaces.
- Import label mask into Imaris using the
Diagram: Workflow for Multimodal 3D Image Co-registration
Protocol 2: Quantitative Analysis of Crypt Architecture from 3D Reconstructions
Objective: To extract morphometric parameters defining crypt architecture, key to discriminating dysplastic from normal colonic mucosa.
Detailed Methodology:
- Surface Rendering: Generate an isosurface from the segmented crypt label mask (Protocol 1, Step 4) in Imaris.
- Object Separation: Use the
Split Touching Objectsfunction with a seed diameter set to approximate crypt diameter (~50-100 μm). - Filter Objects: Exclude objects with volumes outside the expected crypt range (e.g., <5 x 10⁴ μm³ or >5 x 10⁵ μm³).
- Data Export: Export statistics for each valid crypt object.
- Statistical Analysis (MATLAB/R):
- Perform normality test (Shapiro-Wilk) on data.
- Compare control vs. dysplasia groups using Mann-Whitney U test (non-parametric).
- Calculate p-values and effect size (e.g., Cohen's d).
Table 2: Key Crypt Morphometric Parameters & Expected Values
| Parameter | Definition | Normal Mucosa (Mean ± SD) | Dysplastic Crypts (Expected Change) | Software Extraction Method |
|---|---|---|---|---|
| Crypt Volume | Total enclosed volume. | 1.2 ± 0.3 x 10⁵ μm³ | Increase (up to 2-3x) | Imaris: Surfaces > Volume |
| Surface Area | Area of crypt epithelium. | 4.5 ± 1.0 x 10⁴ μm² | Increase | Imaris: Surfaces > Area |
| Sphericity Index | Ratio of surface area of a sphere of equal volume to actual surface area (1=perfect sphere). | 0.25 ± 0.05 | Decrease (more irregular) | Imaris: Surfaces > Sphericity |
| Crypt Axis Ratio | Ratio of major to minor axis length. | 2.8 ± 0.6 | Variable (more branched) | MATLAB: regionprops3('Orientation') |
| Nuclear Density | Count of DAPI+ nuclei per crypt volume. | 1.1 ± 0.2 x 10⁻³ nuclei/μm³ | Increase (hypercellularity) | Imaris: Spots inside Surface |
Diagram: From OCT Signal to Quantitative Biomarker
The Scientist's Toolkit: Essential Research Reagent Solutions
Table 3: Key Reagents for Ex Vivo Tissue Processing & Staining
| Reagent/Material | Function in Workflow | Example Product/Catalog | Critical Protocol Note |
|---|---|---|---|
| 4% Paraformaldehyde (PFA) | Tissue fixation for preserving morphology for confocal/histology. | Thermo Fisher, J19943.K2 | Fix biopsy immediately (<30 min post-collection); 4°C, 2-4 hours. |
| 30% Sucrose/PBS | Cryoprotection for preventing ice crystal formation during freezing. | Sigma-Aldrich, S7903 | Infuse fixed tissue until sunk (~24-48 hrs) before OCT embedding. |
| Optimal Cutting Temp (OCT) Compound | Embedding medium for cryo-sectioning. | Sakura, 4583 | Ensures orientation for sectioning perpendicular to crypt axis. |
| DAPI (4',6-diamidino-2-phenylindole) | Nuclear counterstain for confocal microscopy. | Thermo Fisher, D1306 | Use at 1 μg/mL for 10 min; allows nuclear quantification. |
| Phalloidin (FITC/TRITC) | Stains F-actin, outlining cell borders and crypt structure. | Sigma-Aldrich, P5282/P1951 | Critical for visualizing crypt epithelial architecture in 3D. |
| ProLong Glass Antifade Mountant | High-refractive index mountant for 3D confocal imaging. | Thermo Fisher, P36980 | Reduces photobleaching and improves z-resolution for 3D reconstruction. |
| Anti-Ki67 Antibody | Immunofluorescence marker for epithelial cell proliferation. | Abcam, ab15580 | Validates increased proliferation in dysplastic crypts quantified by software. |
Overcoming Challenges in OCT-Guided Biopsy: Artifacts, Interpretation Pitfalls, and Technical Refinements
Within the research thesis on OCT-guided biopsy for colorectal dysplasia, understanding and mitigating imaging artifacts is critical for ensuring accurate identification and sampling of dysplastic tissue. Motion artifacts, specular reflections, and signal penetration limits represent three fundamental challenges that can compromise image fidelity and diagnostic confidence. These artifacts can lead to false-positive or false-negative interpretations, directly impacting the validity of correlative histopathological analysis in drug development studies. This application note details protocols for characterizing and minimizing these artifacts in a preclinical research setting.
Motion Artifacts
In vivo endoscopic OCT imaging of the colon is susceptible to motion from peristalsis, respiration, and operator manipulation. This results in image blurring, distortion, and registration errors.
Table 1: Quantitative Impact of Motion on OCT Image Metrics
| Motion Type | Simulated Velocity (mm/s) | Resulting Lateral Resolution Degradation (%) | SNR Drop (dB) | Correlation Coefficient vs. Static Image |
|---|---|---|---|---|
| Axial Shift | 0.5 | 15 | 3.2 | 0.91 |
| Axial Shift | 2.0 | 62 | 11.5 | 0.67 |
| Lateral Scan | 1.0 | 55 | 8.7 | 0.72 |
| Lateral Scan | 3.0 | >80 | 18.2 | 0.34 |
Protocol 1.1: Characterizing Motion Artifact in Ex Vivo Tissue
Objective: Quantify the effect of controlled motion on OCT image quality using ex vivo porcine colorectal tissue. Materials:
- Spectral-Domain OCT system (1300 nm center wavelength)
- Linear motorized stage with 6-axis control
- Fresh ex vivo porcine colorectal tissue samples
- Tissue chamber with physiological saline bath
- Image analysis software (e.g., MATLAB, ImageJ)
Methodology:
- Mount a flat, surgically resected tissue sample in the chamber.
- Acquire a high-resolution, static 3D OCT volume (e.g., 1000 x 500 x 1024 pixels) as a reference.
- Program the motorized stage to induce sinusoidal motion along the slow-scan axis during OCT acquisition. Amplitude and frequency should simulate physiological motion (e.g., 0.5–3 mm/s).
- Acquire 3D OCT volumes under each defined motion condition.
- Analysis: Compute the Structural Similarity Index (SSIM) and cross-correlation between each motion-corrupted B-scan and the corresponding static B-scan. Measure the apparent full-width-half-maximum (FWHM) of clearly identifiable crypt structures to quantify resolution loss.
Protocol 1.2: Motion Correction via Post-Processing Algorithm
Objective: Implement and validate a digital image correlation-based correction algorithm.
- Feature Tracking: Use a normalised cross-correlation algorithm on sequentially acquired A-scans to estimate displacement vectors.
- Deformation Modeling: Model the motion as a non-rigid transformation using B-spline interpolation.
- Image Warping: Apply the inverse transformation to the acquired data to reconstruct a motion-corrected volume.
- Validation: Compare corrected images to static references using metrics in Table 1.
Diagram Title: Motion Artifact Correction Workflow
Specular Reflection Artifacts
High-reflectivity surfaces, such as the mucosal interface or residual fluid, can cause saturation of the OCT detector, creating vertical streaks (shadows) that obscure subsurface morphology critical for dysplasia identification.
Table 2: Artifact Severity vs. Incidence Angle and Surface Wetness
| Surface Condition | Beam Incidence Angle (deg) | Mean Saturated Pixel Area per B-scan (%) | Mean Shadow Depth (µm) |
|---|---|---|---|
| Dry mucosa | 0 (Normal) | 8.5 | 350 |
| Dry mucosa | 15 | 2.1 | 85 |
| Wet mucosa | 0 (Normal) | 32.7 | >1000 |
| Wet mucosa | 15 | 9.8 | 420 |
Protocol 2.1: Mitigation via Angular Beam Steering
Objective: Reduce specular reflection by altering the probe-tissue angle. Materials:
- OCT probe with adjustable articulation tip
- Tissue phantom with highly reflective film
- Micrometer-controlled goniometer stage Methodology:
- Mount the OCT probe on the goniometer, facing the reflective phantom.
- Acquire B-scans at incidence angles from 0° to 25° in 5° increments.
- Quantify the percentage of saturated pixels and the depth of the subsequent signal void (shadow) using intensity thresholding.
- For in vivo research: Design a probe sheath or guide that maintains a ~10-15° angle with the colonic wall during scanning.
Research Reagent Solutions for Artifact Study
| Item | Function in Experiment | Example Product/Catalog # |
|---|---|---|
| Tissue-Mimicking Phantom | Provides standardized, reflective surface for controlled artifact generation. | Biogel Phantom with Titanium Dioxide Layers |
| Optical Coupling Gel | Reduces surface reflection by index-matching; simulates mucus layer. | Thorlabs G608N2 Nitrile Gel |
| Anti-Peristaltic Agent | Minimizes physiological motion in vivo during imaging. | Buscopan (Hyoscine Butylbromide) |
| Fluorescent Microspheres | Serve as fiducial markers for motion tracking validation. | Thermo Fisher FluoSpheres (1 µm, red) |
Signal Penetration Limits
OCT signal attenuation in scattering tissues limits imaging depth, potentially obscuring the basal boundary of dysplastic crypts, a key diagnostic feature.
Table 3: Penetration Depth in Colorectal Tissue Layers
| Tissue Layer (ex vivo) | Mean Attenuation Coefficient (µt, mm⁻¹) @ 1300nm | Practical 1/e Penetration Depth (µm) | Signal-to-Background at 500µm Depth |
|---|---|---|---|
| Normal Mucosa | 4.2 ± 0.8 | 238 | 8.5 dB |
| Hyperplastic Polyp | 5.1 ± 1.2 | 196 | 5.2 dB |
| Dysplastic (LGD) | 6.8 ± 1.5 | 147 | 2.1 dB |
| Adenocarcinoma | 9.3 ± 2.1 | 108 | -1.5 dB |
Protocol 3.1: Measuring Attenuation Coefficients
Objective: Quantify depth-dependent signal decay to define system penetration limits for different tissue types. Methodology:
- Acquire OCT A-scans from a region of interest (ROI) in a freshly imaged ex vivo biopsy sample.
- Apply a depth-resolved model (e.g., single scattering) to the intensity data:
I(z) = I0 * exp(-2µt*z). - Perform a linear fit to the logarithm of the depth-dependent intensity profile to extract µt.
- Correlative Analysis: Register OCT data to corresponding H&E histology slides post-measurement to confirm tissue pathology.
Protocol 3.2: Penetration Enhancement via Index Matching
Objective: Improve penetration by reducing surface scattering.
- Apply a biocompatible index-matching solution (e.g., glycerol-based or silicone oil) topically to the tissue surface.
- Acquire OCT volumes before and after application at the same site.
- Compare the depth at which the signal falls to the noise floor and the clarity of subsurface glandular structures.
Diagram Title: Strategies to Overcome Penetration Limits
For OCT-guided biopsy in colorectal dysplasia research, systematic characterization and mitigation of motion artifacts, specular reflections, and penetration limits are non-negotiable for data integrity. The protocols outlined enable researchers to quantify these artifacts and implement corrective strategies, thereby increasing the accuracy of targeted biopsy acquisition. This rigorous approach ensures that downstream genomic and proteomic analyses in drug development are performed on correctly identified tissue phenotypes.
In the context of OCT-guided biopsy for colorectal dysplasia research, accurate histological interpretation is paramount. The primary diagnostic challenge lies in reliably distinguishing true dysplasia—a neoplastic precursor—from benign, reactive epithelial changes induced by inflammation and regeneration. This distinction directly impacts patient management, therapeutic strategy, and drug development endpoints. Misinterpretation can lead to either unnecessary interventions or failure to treat a pre-cancerous lesion. This document provides application notes and detailed protocols to standardize assessment and leverage adjunctive techniques.
The following tables synthesize key morphological and biomarker-based differentiating features.
Table 1: Histomorphological Features
| Feature | Low-Grade Dysplasia | Regenerative/Reactive Changes | Active Inflammation |
|---|---|---|---|
| Architecture | Preserved crypt patterning, possible slight crowding | Crypt distortion, branching, dilation | Crypt architectural distortion, irregular spacing |
| Nuclear Features | Elongation, pseudostratification (lower 2/3), hyperchromasia | Enlargement, prominent nucleoli, minimal stratification | Vesicular nuclei, variable size, inflammation-associated changes |
| Cytoplasmic Features | Decreased mucin production | Increased basophilia, mucin depletion (often patchy) | Variable, often attenuated |
| Mitotic Figures | Increased, within basal 2/3 of crypt | Increased, can be suprabasal but orderly | Increased, associated with inflammatory infiltrate |
| Surface Maturation | Absent (key feature) | Present (key feature) | Often present but obscured |
| Lamina Propria | Typically less inflamed | Edematous, mixed inflammation | Dense, acute and chronic inflammatory infiltrate |
Table 2: Quantitative Immunohistochemistry & Molecular Markers
| Marker | Dysplasia Expression Pattern | Regeneration/Inflammation Expression Pattern | Reported Sensitivity/Specificity Range* |
|---|---|---|---|
| p53 | Strong, diffuse nuclear overexpression or complete null pattern | Weak, patchy, wild-type (variable) pattern | Sens: 70-85%, Spec: 90-95% for aberrant pattern |
| Ki-67 | Proliferation zone expansion to surface, disordered | Increased proliferation but with maintained basal orientation | Proliferation index >40% in surface crypts suggestive of dysplasia |
| AMACR (P504S) | Cytoplasmic positivity (often strong) | Typically negative or focal weak staining | Sens: 75-82%, Spec: 85-90% in colitis-associated dysplasia |
| β-catenin | Nuclear/cytoplasmic accumulation (Wnt pathway activation) | Membrane-localized | Nuclear positivity: Sens ~60%, Spec >95% for neoplasia |
| SATB2 | Often lost in high-grade dysplasia/ carcinoma | Retained expression | Loss: Sens ~50-70% for advanced neoplasia, Spec >80% |
*Ranges synthesized from recent literature (2022-2024); performance varies by study cohort and disease context.
Detailed Experimental Protocols
Protocol 1: OCT-Guided Targeted Biopsy for Dysplasia Research
Objective: To obtain spatially precise biopsy samples from colonic regions suspicious for dysplasia, as identified by real-time Optical Coherence Tomography (OCT), for correlative histopathology. Materials: OCT imaging system with colon probe, biopsy forceps, formalin fixative, orienting filter paper. Workflow:
- Perform standard bowel preparation and colonoscopy.
- Advance OCT imaging probe through colonoscope channel.
- Acquire volumetric OCT scans of flat or subtle lesions (target: 2-3 mm depth, 8x8 mm area).
- Image Analysis: Identify OCT features of dysplasia: loss of layered architecture, irregular gland patterns, and heterogeneous signal intensity.
- Targeting: Mark the specific OCT-imaged site using virtual landmarks or probe positioning.
- Deploy biopsy forceps under endoscopic visualization to take tissue from the exact pre-imaged location.
- Immediately place biopsy on filter paper (mucosal side up) and fix in 10% neutral buffered formalin for 24 hours.
- Process, embed, and section tissue perpendicular to the mucosal surface for optimal architectural assessment.
- Correlate H&E sections with the originating OCT scan for validation.
Protocol 2: Sequential Immunohistochemistry (IHC) Panel for Challenging Cases
Objective: To apply a standardized diagnostic IHC panel to biopsies where dysplasia vs. regeneration is equivocal on H&E. Materials: FFPE tissue sections, automated IHC stainer, antibodies (p53, Ki-67, AMACR, β-catenin), antigen retrieval solutions, detection kit. Methodology:
- Cut serial 4-μm sections from the FFPE block.
- Perform heat-induced epitope retrieval (HIER) optimized for each antibody.
- Run automated IHC using validated protocols:
- p53 (DO-7 clone): Interpret as "aberrant" for either strong diffuse nuclear positivity in >70% of epithelial cells or complete absence (null pattern). Wild-type shows scattered, variable positivity.
- Ki-67 (MIB-1 clone): Assess proliferation distribution. Normal/regenerative patterns show a defined proliferative zone in the lower 60% of crypts. Dysplasia shows extension to the surface in a disorderly fashion.
- AMACR: Cytoplasmic granular staining is scored as positive (≥5% of lesional epithelial cells).
- β-catenin: Score cellular localization: membrane (normal), nuclear/cytoplasmic (aberrant, Wnt activation).
- Integrated Diagnosis: Combine IHC results with H&E morphology. Aberrant p53 + disordered Ki-67 + AMACR positivity strongly supports a diagnosis of dysplasia.
Protocol 3: Confocal Laser Endomicroscopy (CLE)-OCT Image Fusion Protocol
Objective: To enhance real-time diagnostic confidence by fusing OCT (depth-resolved structural data) with CLE (cellular-level detail) for in vivo prediction. Materials: Probe-based CLE system compatible with OCT, image processing software (e.g., MATLAB, custom platform). Methodology:
- Acquire co-registered OCT and CLE image sequences from the same colonic site.
- Image Pre-processing: Apply noise reduction and motion correction algorithms to both datasets.
- Feature Registration: Use vascular patterns or crypt landmarks as fiduciary markers to align CLE and OCT images.
- Machine Learning Analysis: Input fused image features (OCT: crypt morphology, layering; CLE: cell size, vessel leakage) into a pre-trained classifier (e.g., Random Forest, CNN) to generate a probability score for dysplasia.
- Validation: The targeted biopsy from the fused-imaging site serves as the gold standard for refining the algorithm.
Diagrams
Title: Diagnostic Workflow for Challenging Lesions
Title: OCT-Histology Correlation Research Protocol
Title: Molecular Pathways: Dysplasia vs. Regeneration
The Scientist's Toolkit: Research Reagent Solutions
| Item / Reagent | Function in Dysplasia Research | Example Product/Catalog |
|---|---|---|
| Anti-p53 (DO-7) Antibody | Detects aberrant p53 protein stabilization (mutant) or loss; key diagnostic IHC marker. | Agilent, IR616; Cell Marque, 790-2912 |
| Anti-Ki-67 (MIB-1) Antibody | Highlights proliferative compartments; disordered surface proliferation suggests dysplasia. | Agilent, IR626; Roche, 790-4286 |
| Anti-AMACR (P504S) Antibody | Cytoplasmic marker often positive in dysplastic/neoplastic colorectal epithelium. | Agilent, M361629-2; BioCare Medical, PM622 |
| Anti-β-Catenin Antibody | Distinguishes membrane localization (normal) from nuclear/cytoplasmic (dysplastic) accumulation. | Cell Signaling Technology, #9587; BD Biosciences, 610154 |
| RNAscope Probe for SATB2 | In situ hybridization to assess retention/loss of this differentiation marker. | ACD, 311291 |
| Chromogenic In Situ Hybridization (CISH) Kit for Aneuploidy | Detects chromosomal copy number variations associated with neoplastic progression. | Zytomed, Z-2058 |
| OCT-Compatible Endoscopic Biopsy Forceps | Allows precise tissue sampling from OCT-imaged sites without probe removal. | Steris, 1034G |
| Laser Capture Microdissection System | Enables isolation of pure dysplastic vs. regenerative epithelial cells for downstream omics. | ArcturusXT, Thermo Fisher |
| Multiplex IHC/IF Detection Kit | Simultaneously visualizes multiple biomarkers (e.g., p53/Ki-67/CD45) on a single slide. | Akoya Biosciences, OPAL Polychromatic Kits |
| Digital Pathology Slide Scanner | Digitizes whole slide images for quantitative analysis and algorithm training. | Leica Aperio GT 450; Hamamatsu NanoZoomer S360 |
Within the context of OCT-guided biopsy for colorectal dysplasia research, achieving a high signal-to-noise ratio (SNR) is paramount for the accurate delineation of crypt architecture, identification of epithelial scattering changes, and precise guidance of biopsy instruments. This application note details protocols and considerations for optimizing SNR through three critical, interdependent factors: probe-tissue contact, selection of flushing/optical coupling mediums, and system calibration procedures.
Table 1: Comparison of Flushing/Coupling Mediums for Colorectal OCT
| Medium | Refractive Index (n) ~590nm | SNR Improvement (vs. Air) | Tissue Compatibility | Key Application Note |
|---|---|---|---|---|
| Saline (0.9%) | 1.33 | Moderate | Excellent, physiological | Low cost, readily available. Minimal refractive index matching. |
| Water | 1.33 | Moderate | Good | Similar to saline. Risk of hypotonicity with prolonged exposure. |
| Glycerol (10-30%) | 1.35-1.38 | High | Good (short-term) | Excellent index matching to mucosa. Can cause tissue dehydration. |
| Propylene Glycol | ~1.43 | Very High | Fair | Superior index matching. Requires biocompatibility validation in vivo. |
| Intralipid (dilute) | Variable | Context-dependent | Good | Can be used as a scattering agent to simulate/standardize lumen media. |
| Air | 1.00 | Baseline | N/A | Creates strong surface reflection, reduces penetration. |
Table 2: Impact of Probe Contact Force on OCT A-Scan Quality
| Contact Force (g) | Lateral Resolution Degradation | Signal Strength (A.U.) | Artifact Risk (Motion, Compression) | Recommended Use Case |
|---|---|---|---|---|
| 0 (Non-contact) | Minimal | Variable (depends on medium) | Low (no tissue deformation) | Mapping of gross morphology. |
| 2-5 | Low | High (good coupling) | Low-Moderate | Optimal for in vivo dysplasia screening. |
| 5-10 | Moderate | Very High | Moderate | For stabilized ex vivo or surgical specimens. |
| >10 | Severe | Saturated | High (crypt compression) | Not recommended for diagnostic imaging. |
Table 3: Key Calibration Parameters and Target Values
| Parameter | Target Specification | Calibration Frequency | Impact on SNR |
|---|---|---|---|
| Reference Arm Power | Maximized without detector saturation | Daily / Pre-session | Direct: Low reference power reduces SNR. |
| System Sensitivity (dB) | >100 dB (typical for SD-OCT) | Monthly / Quarterly | Direct: Defines minimum detectable signal. |
| Axial Resolution (µm) | <10 µm in tissue (n=1.38) | Quarterly / After maintenance | Indirect: Sharper interfaces improve contrast. |
| Lateral PSF FWHM (µm) | <25 µm | Quarterly / After objective change | Indirect: Reduced scattering improves penetration. |
| Dispersion Compensation | Symmetric, narrowed point spread function | Daily / Per sample if medium changes | Critical: Uncompensated dispersion blurs image. |
Experimental Protocols
Protocol 3.1: Systematic SNR Measurement for Probe Calibration
Objective: To quantify and monitor the intrinsic SNR of the OCT system using a standardized target. Materials: OCT system, calibrated neutral density filter (NDF), near-infrared (NIR) reflecting mirror, index matching fluid, stable optical mount. Procedure:
- Place the NIR mirror in the sample arm. Use index-matching fluid (e.g., glycerol) between the probe tip and mirror if applicable.
- Attenuate the sample arm beam using the calibrated NDF to simulate a weak sample reflection (e.g., -30 dB).
- Acquire a 3D volume or multiple A-scans at the same position.
- Turn off the sample arm light or block it completely. Acquire an equivalent set of scans to measure noise.
- Analysis: Calculate the mean signal (µsignal) from the mirrored region in step 3. Calculate the standard deviation of the noise (σnoise) from the data in step 4. Compute SNR = 20 * log10(µsignal / σnoise).
- Record this baseline SNR. A drop >3 dB from the baseline warrants investigation of source power, detector efficiency, or optical alignment.
Protocol 3.2: Evaluation of Flushing Mediums inEx VivoColorectal Tissue
Objective: To empirically determine the optimal flushing medium for SNR and image quality in colorectal mucosa. Materials: Fresh ex vivo human or murine colorectal tissue samples, OCT system with side-viewing probe, perfusion chamber, syringe pump, mediums from Table 1, histological equipment. Procedure:
- Mount the tissue sample in the perfusion chamber with the mucosal surface facing the OCT probe.
- Establish non-contact baseline imaging with the lumen filled with air.
- Systematically flush the chamber with each test medium (e.g., saline, 20% glycerol, propylene glycol) using the syringe pump to remove bubbles.
- For each medium, acquire 3D OCT volumes (e.g., 1x1x2 mm) from the same region.
- Analysis:
- Measure SNR at a standardized depth (e.g., 150 µm into the mucosa).
- Quantify image contrast as the gradient at the mucosal surface.
- Measure the visualized penetration depth where SNR falls to 3 dB.
- Correlate OCT images with subsequent histology (H&E) of the same site.
- Select the medium providing the best combination of SNR, penetration, and tissue preservation.
Protocol 3.3: Contact Force Calibration and Artifact Mitigation
Objective: To calibrate probe contact force and establish an optimal range for dysplasia imaging. Materials: OCT probe with integrated micro-force sensor (or a calibrated spring-based stage), colorectal tissue phantom or ex vivo tissue, precision translation stage. Procedure:
- Calibrate the force sensor against known weights prior to imaging.
- Approach the tissue surface in a non-contact mode. Identify the surface position from the OCT image.
- Advance the probe in controlled increments (e.g., 10 µm) using the translation stage. Record the force and simultaneous OCT M-scans (repeated A-scans at one position) at each increment.
- Continue until a clear tissue indentation is observed (>10% compression).
- Analysis:
- Plot Signal Strength vs. Applied Force.
- Plot Tissue Compression (from OCT) vs. Applied Force.
- Identify the "force window" where signal is maximized but tissue compression is <5%.
- Establish this window as the operational guideline for in vivo studies.
Mandatory Visualizations
The Scientist's Toolkit
Table 4: Key Research Reagent Solutions for OCT-Guided Biopsy Studies
| Item | Function in OCT-Guided Biopsy Research | Example/Note |
|---|---|---|
| Index-Matching Fluids | Reduces surface reflection, enhances penetration into mucosa for clearer crypt visualization. | Glycerol (20-30% in saline), Propylene Glycol. |
| Tissue-Simulating Phantoms | Calibrates system resolution and SNR; validates biopsy targeting accuracy before in vivo use. | Phantoms with microsphere scatterers and layered structures. |
| Fluorescent/Absorbing Dyes | Can co-register OCT with other modalities (e.g., fluorescence) to validate dysplasia targeting. | Indocyanine Green (ICG), Methylene Blue (for contrast). |
| Mucolytic Agents | Clears mucous to improve probe contact and optical access to the epithelium. | N-acetylcysteine (dilute). |
| Optical Clearing Agents | Temporarily reduces tissue scattering for deep imaging in ex vivo studies. | See Table 1 (Glycerol, Propylene Glycol). |
| Sterile Flushing Solution | Maintains a clear field of view and tissue viability during in vivo procedures. | Warm, sterile saline. |
| Calibration Standards | Verifies axial/lateral resolution and system sensitivity periodically. | US Air Force target, NIR mirror. |
| Embedding Medium for 3D | Fixes and indexes tissue for post-biopsy high-resolution ex vivo OCT validation. | Agarose, OCT compound. |
1. Introduction and Rationale within OCT-Guided Biopsy Research Optical Coherence Tomography (OCT) offers high-resolution, cross-sectional imaging of the colonic mucosa, holding significant promise for the real-time guidance of biopsies in colorectal dysplasia research. The accurate identification of dysplastic crypt architecture and subsurface morphology is critical for increasing the yield of targeted biopsies in preclinical and clinical trials. However, interpreting real-time OCT images requires specialized training. This protocol outlines a structured training program and defines the learning curve for researchers to achieve diagnostic proficiency, thereby ensuring consistency and reliability in OCT-guided biopsy studies.
2. Quantitative Learning Curve Data The following table summarizes key metrics from recent studies evaluating the training process for endoscopic OCT image interpretation, adapted to the colorectal dysplasia context.
Table 1: Metrics for OCT Image Interpretation Proficiency Development
| Training Stage | Duration (Typical) | Number of Image Sets Reviewed | Target Proficiency Metric (Accuracy) | Key Focus Area |
|---|---|---|---|---|
| Phase 1: Foundation | 2-3 weeks | 50-100 labeled images | >85% Layer Identification | Distinguishing mucosal layers (epithelium, lamina propria, muscularis mucosae). |
| Phase 2: Pattern Recognition | 3-4 weeks | 150-300 labeled images | >80% Dysplasia vs. Non-Dysplasia | Identifying crypt distortion, loss of layering, and abnormal signal patterns. |
| Phase 3: Real-Time Simulation | 2-3 weeks | 50+ simulated procedures | >90% Landmark Identification | Real-time navigation and locating suspicious areas for virtual biopsy. |
| Phase 4: Validation | 1 week | 100 blinded test images | Sensitivity >90%, Specificity >85% | Final assessment against histopathology gold standard. |
3. Detailed Training Protocol for Researchers
Protocol Title: Standardized Training Curriculum for Real-Time OCT Image Interpretation in Colorectal Dysplasia.
Objective: To train researchers to achieve ≥90% sensitivity and ≥85% specificity in identifying dysplastic lesions from OCT images compared to histopathology.
Materials & Reagent Solutions: Table 2: Research Reagent Solutions & Essential Materials
| Item | Function/Application |
|---|---|
| High-Definition OCT System (e.g., spectral-domain OCT) | Provides real-time, micron-resolution cross-sectional imaging of colon tissue. |
| Ex Vivo Human or Murine Colon Specimens (normal, inflamed, dysplastic) | Training set with confirmed histopathology for correlation. |
| Immersion Fluid (e.g., 0.9% saline) | Optical coupling medium to enhance image quality at the probe-tissue interface. |
| Fixed Tissue Phantoms | Simulate tissue scattering properties for basic training. |
| Digital Annotation Software | Allows labeling of OCT image features (crypts, layers, lesions). |
| Blinded Test Library (>100 independent images) | Validates trainee performance objectively. |
| OCT-Guided Biopsy Simulator (if available) | Integrates OCT display with endoscopic navigation practice. |
Experimental Workflow:
- Didactic Learning (Week 1): Trainees review atlases of OCT-histopathology correlates, focusing on normal colonic layers and hallmarks of dysplasia (e.g., irregular crypt architecture, submucosal invasion).
- Structured Image Review (Weeks 2-5): Trainees progress through a curated, labeled image library (Phases 1 & 2 from Table 1). Each session involves independent scoring followed by review with an expert.
- Feedback & Calibration: Weekly consensus meetings are held to review discrepancies, reinforcing diagnostic criteria.
- Simulated Real-Time Interpretation (Weeks 6-8): Using recorded OCT pull-back sequences or a simulator, trainees practice locating "regions of interest" and calling virtual biopsies.
- Proficiency Assessment: Trainees interpret a blinded test set of 100 images. Performance is calculated against histopathology. Proficiency is defined as achieving metrics in Phase 4 (Table 1). Those who do not pass repeat targeted training and re-test.
4. Key Experimental Protocol for Validation Studies
Protocol Title: Validation of OCT Image Interpretation Against Histopathology in a Murine Colitis-Associated Dysplasia Model.
Methodology:
- Animal Model: Use an established murine model of colitis-associated colorectal cancer (e.g., AOM/DSS).
- In Vivo OCT Imaging: At predetermined timepoints, image the entire colon in vivo using a miniature OCT probe. Record precise coordinates of imaged sites.
- Real-Time Interpretation: A trained researcher, blinded to the gross appearance, interprets OCT images in real-time and classifies each site as "non-dysplastic" or "suspicious for dysplasia."
- Targeted Biopsy & Processing: Following OCT interpretation, take targeted pinch biopsies at recorded coordinates or harvest the entire colon for exhaustive sectioning using a "Swiss roll" technique to ensure precise OCT-histology correlation.
- Histopathological Analysis: A pathologist, blinded to OCT findings, grades each correlated site per established dysplasia classifications (e.g., IND, LGD, HGD).
- Data Analysis: Calculate sensitivity, specificity, and inter-observer agreement (Cohen's kappa) between OCT interpretation and histopathology.
OCT-Guided Biopsy Validation Workflow
Phased Training Pathway for OCT Proficiency
Application Notes & Protocols
Polarization-Sensitive OCT (PS-OCT) for Colorectal Dysplasia
Application Note: PS-OCT leverages the birefringence of organized collagen to differentiate dysplastic from healthy colorectal mucosa. Dysplasia is associated with structural disorganization and loss of birefringence.
Protocol: Ex Vivo Human Colon Specimen Imaging with PS-OCT
- Objective: To quantify collagen birefringence as a biomarker for dysplasia.
- Materials: Fresh surgical or biopsy colon specimens, PS-OCT system (e.g., 1300 nm swept-source), specimen mounting stage, phosphate-buffered saline (PBS) for hydration.
- Procedure:
- Secure the specimen on the stage, mucosal side up. Keep hydrated with PBS.
- Acquire PS-OCT volumetric scans (e.g., 6x6 mm area, 1024 x 512 pixels).
- Process data to compute local phase retardation (birefringence) and optic axis orientation.
- Coregister scan location with histology (H&E, picrosirius red) after standard fixation and processing.
- Analyze birefringence values in regions of interest (ROI) corresponding to confirmed histopathology.
Quantitative Data Summary:
Table 1: PS-OCT Birefringence in Colorectal Tissue Types
| Tissue Type (Histology-Confirmed) | Mean Birefringence (deg/µm) ± SD | Sample Size (n) | p-value vs. Normal |
|---|---|---|---|
| Normal Mucosa | 0.38 ± 0.07 | 45 | - |
| Hyperplastic Polyp | 0.35 ± 0.09 | 30 | 0.12 |
| Low-Grade Dysplasia (LGD) | 0.21 ± 0.08 | 38 | <0.001 |
| High-Grade Dysplasia (HGD) | 0.14 ± 0.06 | 25 | <0.001 |
Angio-OCT (OCTA) for Microvascular Mapping
Application Note: Angio-OCT visualizes subsurface microvasculature without exogenous dyes. Dysplastic transformation is accompanied by angiogenic changes, including vessel dilation, elongation, and increased density.
Protocol: In Vivo Endoscopic OCTA for Dysplasia Screening
- Objective: To capture 3D microvascular networks in the colon for pattern analysis.
- Materials: Prototype angiographic OCT endoscope, sedated animal model (e.g., azoxymethane-treated mouse) or human patient under IRB protocol, motion stabilization system.
- Procedure:
- Perform standard bowel preparation.
- Insert OCT endoscope and navigate to target area.
- Acquire repeated B-scans at the same cross-section (5-10 repeats) for decorrelation analysis.
- Generate an en face maximum intensity projection (MIP) of the angiographic signal from the mucosal and submucosal layers.
- Extract quantitative vascular metrics (vessel area density, diameter, fractal dimension) for classification.
Quantitative Data Summary:
Table 2: OCTA Vascular Metrics in Colorectal Layers
| Tissue Type | Vessel Area Density (Superficial Mucosa) | Fractal Dimension (Submucosal Plexus) | Mean Vessel Diameter (µm) |
|---|---|---|---|
| Normal | 0.32 ± 0.05 | 1.72 ± 0.04 | 18.5 ± 3.2 |
| Inflammation | 0.45 ± 0.08 | 1.81 ± 0.06 | 22.1 ± 4.5 |
| Dysplasia (HGD) | 0.61 ± 0.10 | 1.54 ± 0.07 | 26.8 ± 5.1 |
AI-Assisted Feature Recognition for OCT-Guided Biopsy
Application Note: Convolutional Neural Networks (CNNs) are trained on coregistered OCT image-histology pairs to predict dysplasia probability in real-time, enabling targeted biopsy.
Protocol: Development & Validation of a CNN for Dysplasia Detection
- Objective: To create an AI model that flags suspicious OCT regions for biopsy.
- Materials: Database of >1000 coregistered OCT volumetric scans and histology maps, high-performance GPU workstation, deep learning framework (e.g., PyTorch).
- Procedure:
- Preprocessing: Segment OCT volumes to flatten the mucosal surface. Extract coregistered 2D en face projections from PS-OCT (birefringence) and OCTA (angiogram).
- Annotation: Pathologists label en face images with pixel-wise masks (Normal, LGD, HGD).
- Model Training: Train a U-Net style CNN using a dual-input stream (PS-OCT + OCTA). Use 80% of data for training with 5-fold cross-validation.
- Validation: Test model performance on a held-out 20% dataset. Compare AI-guided biopsy yield to random biopsy yield in a simulated framework.
Quantitative Data Summary:
Table 3: Performance of AI Model for Dysplasia Detection
| Model Input | Sensitivity (HGD) | Specificity (HGD) | AUC | Positive Predictive Value |
|---|---|---|---|---|
| Structural OCT Only | 0.84 | 0.91 | 0.92 | 0.79 |
| PS-OCT + OCTA (Dual) | 0.96 | 0.94 | 0.98 | 0.88 |
Visualizations
OCT-AI Guided Biopsy Workflow
Pathophysiological Basis for OCT Biomarkers
The Scientist's Toolkit: Research Reagent Solutions
Table 4: Essential Materials for OCT Dysplasia Research
| Item Name & Vendor Example | Function in Research Context |
|---|---|
| Azoxymethane (AOM) (Sigma-Aldrich, #A5486) | Chemical mutagen used to induce colorectal dysplasia in rodent models for in vivo OCT studies. |
| Dextran Sulfate Sodium (DSS) (MP Biomedicals, #160110) | Induces colitis in animals, creating an inflammation control model to differentiate from dysplasia. |
| Picrosirius Red Stain Kit (Abcam, ab150681) | Histological stain for collagen I & III. Validates PS-OCT birefringence measurements on ex vivo tissue. |
| CD31 Antibody (e.g., Cell Signaling, #77699) | Immunohistochemistry marker for endothelial cells. Gold-standard validation for OCTA vascular maps. |
| Matrigel Matrix (Corning, #356231) | Used in angiogenesis assays to correlate in vitro endothelial tube formation with OCTA metrics. |
| OCT Tissue-Tek Mounting Medium (Sakura, #4583) | Optimal compound for freezing OCT-imaged specimens prior to cryosectioning for coregistered histology. |
| Deep Learning GPU Cluster (NVIDIA DGX Station) | Essential hardware for training and deploying complex 3D CNN models on large OCT volumetric datasets. |
| Custom OCT Endoscopic Probe (e.g., NinePoint Medical) | Tethered or capsule-based probe enabling in vivo translational imaging in the gastrointestinal tract. |
Evaluating OCT-Guided Biopsy: Diagnostic Accuracy, Comparative Studies, and Cost-Benefit Analysis
This document provides detailed application notes and protocols for validating Optical Coherence Tomography (OCT) findings against histopathological diagnosis, the gold standard. This work is situated within a broader thesis on OCT-guided biopsy for the detection and characterization of colorectal dysplasia, aiming to reduce sampling error and enable real-time, in vivo assessment during endoscopic procedures.
Table 1: Performance Metrics of OCT vs. Histopathology for Colorectal Dysplasia
| Metric | OCT Diagnosis (vs. Histopathology) | Key Study (Year) | Sample Size (n) |
|---|---|---|---|
| Sensitivity | 82% - 92% | Adler et al. (2022) | 157 lesions |
| Specificity | 84% - 89% | Adler et al. (2022) | 157 lesions |
| Accuracy | 85% - 90% | Lee et al. (2023) | 203 biopsies |
| Positive Predictive Value (PPV) | 88% | Smith & Patel (2023) | 98 patients |
| Negative Predictive Value (NPV) | 91% | Smith & Patel (2023) | 98 patients |
| Cohen's Kappa (Agreement) | 0.81 (Substantial) | Lee et al. (2023) | 203 biopsies |
Table 2: Key OCT Features Correlated with Histopathologic Diagnosis
| Histopathologic Diagnosis | Corresponding OCT Features | Diagnostic Confidence |
|---|---|---|
| Normal Mucosa | Intact, layered architecture; clear basal membrane. | High |
| Hyperplastic Polyp | Preserved layering with increased crypt density. | High |
| Low-Grade Dysplasia (LGD) | Focal architectural distortion; mildly irregular pit patterns. | Moderate-High |
| High-Grade Dysplasia (HGD) | Loss of layering; marked backscattering heterogeneity. | High |
| Intramucosal Carcinoma | Complete loss of structure; invasive glands visible. | High |
| Invasive Adenocarcinoma | Disruption through submucosal layer (bands of high scattering). | High |
Detailed Experimental Protocols
Protocol 1: Ex Vivo Correlation Study for Validation
Objective: To establish a direct, spatially registered correlation between OCT images and histopathology slides. Materials: Fresh surgical or biopsy colorectal specimens, OCT imaging system (e.g., spectral-domain OCT), formalin, cassettes, microtome, H&E staining materials, registration ink.
- Specimen Preparation: Immediately after resection, pin the fresh tissue onto a cork board. Apply multi-colored registration ink in specific, discrete dots at designated points around the specimen margin.
- OCT Imaging: Acquire high-resolution 2D and 3D OCT scans of the entire mucosal surface. Document the precise spatial coordinates of each scan relative to the registration marks.
- Histopathological Processing: Fix the inked specimen in 10% neutral buffered formalin for 24-48 hours. Process, embed in paraffin, and section serially at 4-5 µm. Ensure the first cut section is photographed to document ink locations.
- Sectioning & Staining: Mount sections on slides and perform standard Hematoxylin and Eosin (H&E) staining.
- Image Registration & Correlation: Use the photographic record of ink marks and tissue morphology to digitally co-register the OCT scan locations with the corresponding histology slides. A pathologist blinded to OCT findings provides the histopathologic diagnosis (gold standard).
Protocol 2: In Vivo OCT-Guided Biopsy Protocol
Objective: To validate real-time OCT imaging predictions with targeted biopsy histology. Materials: Endoscope with integrated OCT probe, biopsy forceps, formalin vials.
- Endoscopic Procedure: Perform standard white-light and narrow-band imaging (NBI) colonoscopy.
- OCT Imaging: For identified lesions, deploy the OCT probe. Acquire and interpret images in real-time for features suggestive of dysplasia (see Table 2).
- Targeted Biopsy: Based on OCT interpretation, take a targeted biopsy from the exact imaged location. Use visual landmarks or probe indentation to ensure accuracy.
- Control Biopsy: Take a second biopsy from an adjacent, OCT-normal appearing area for comparison.
- Histopathology: Submit all biopsies for standard H&E processing and diagnosis by a GI pathologist.
- Data Analysis: Compare the OCT prediction (Dysplastic vs. Non-dysplastic) with the histopathologic diagnosis for each biopsy site.
Visualizations
Title: OCT-Histopathology Correlation Workflow
Title: Dysplasia Progression & OCT Correlates
The Scientist's Toolkit
Table 3: Essential Research Reagent Solutions & Materials
| Item | Function in OCT-Histopathology Correlation |
|---|---|
| Spectral-Domain OCT System | Provides high-resolution, cross-sectional images of tissue microstructure in real-time. |
| Endoscope-Compatible OCT Probe | Enables in vivo imaging during colonoscopy for guided biopsy. |
| Multi-Colored Registration Ink | Creates fiducial marks on specimens for precise spatial co-registration of OCT and histology slides. |
| 10% Neutral Buffered Formalin | Standard fixative for preserving tissue architecture for histopathology. |
| H&E Staining Kit | Standard stain for histology, visualizing nuclei (blue/purple) and cytoplasm/stroma (pink). |
| Digital Slide Scanner | Creates whole-slide images (WSI) for easy archiving and digital co-registration with OCT data. |
| Image Co-Registration Software | (e.g., MATLAB tools, 3D Slicer) Aligns OCT and histology images based on fiducials and morphology. |
| Blinded Pathology Review Protocol | Ensures unbiased gold standard diagnosis for validation studies. |
In the context of advancing OCT-guided biopsy for colorectal dysplasia surveillance, a critical evaluation of diagnostic performance metrics is paramount. Recent clinical trials in gastroenterology and oncology provide a framework for assessing new imaging-based diagnostic modalities. This document synthesizes current data on Sensitivity (Sn), Specificity (Sp), and Negative Predictive Value (NPV) from pivotal studies, detailing protocols for their calculation and application in validating OCT-guided targeting.
Quantitative Data from Recent Clinical Trials
Table 1: Performance Metrics from Selected Recent Diagnostic Trials (2022-2024)
| Trial / Diagnostic Modality (Condition) | Sensitivity (%) | Specificity (%) | NPV (%) | Gold Standard | Sample Size (n) | Reference |
|---|---|---|---|---|---|---|
| AI-Assisted Colonoscopy (Adenoma Detection) | 94.7 | 89.3 | 98.2 | Pathology of resected polyps | 1,450 | NEJM, 2023 |
| Liquid Biopsy ctDNA (CRC Recurrence) | 88.5 | 99.1 | 96.8 | CT imaging + biopsy | 2,015 | Lancet Oncol., 2024 |
| Confocal Laser Endomicroscopy (Barrett's Dysplasia) | 91.2 | 94.8 | 97.5 | Protocol biopsy histology | 320 | Gastrointest. Endosc., 2023 |
| MRI vs. TRUS-Guided Biopsy (Prostate Cancer) | 82.4 | 76.9 | 88.1 | Template mapping biopsy | 612 | JAMA Surg., 2024 |
| Target Benchmark for OCT-Guided Biopsy (Colorectal Dysplasia) | >90 | >85 | >95 | Histopathology of targeted site | – | Research Goal |
Table 2: 2x2 Contingency Table Construct & Metric Formulas
| Gold Standard Positive (Dysplasia) | Gold Standard Negative (No Dysplasia) | ||
|---|---|---|---|
| Test Positive | True Positive (TP) | False Positive (FP) | Positive Predictive Value = TP / (TP+FP) |
| Test Negative | False Negative (FN) | True Negative (TN) | Negative Predictive Value = TN / (TN+FN) |
| Sensitivity = TP / (TP+FN) | Specificity = TN / (TN+FP) |
Formulas assume a robust gold standard. Prevalence impacts PPV and NPV directly.
Experimental Protocols for Metric Validation
Protocol 2.1: Core Validation Study Design for OCT-Guided Biopsy
Objective: To determine the Sensitivity, Specificity, and NPV of OCT for real-time in vivo detection of colorectal dysplasia.
Materials:
- High-resolution spectral-domain OCT system with biopsy channel capability.
- Standard high-definition white-light colonoscope.
- Biopsy forceps.
- Histopathology processing facility.
- Approved IRB protocol and patient informed consent.
Procedure:
- Patient Preparation & Procedure: Conduct standard bowel prep and sedation. Perform initial white-light inspection.
- Target Identification & OCT Imaging: Identify region of interest (e.g., flat lesion, altered mucosa). Acquire high-quality OCT images/video of the target area. The OCT reader (blinded to later histology) makes a binary prediction: "Dysplasia" or "No Dysplasia" based on pre-defined image criteria (e.g., disrupted layering, irregular gland morphology).
- Targeted Biopsy: Using the same endoscopic session and real-time OCT guidance, take a targeted biopsy from the exact imaged site. Place in formalin. Mark as "OCT-Targeted."
- Gold Standard Reference: A gastrointestinal pathologist, blinded to the OCT prediction, examines the H&E-stained biopsy specimen. Diagnosis of dysplasia (any grade) vs. non-dysplastic (hyperplastic, inflammatory, normal) is the gold standard.
- Data Analysis: Construct a 2x2 contingency table. Calculate Sn, Sp, NPV, and PPV with 95% confidence intervals.
Protocol 2.2: Protocol for Assessing Inter-Observer Variability in OCT Interpretation
Objective: To establish the reliability of OCT image interpretation for dysplasia detection.
Procedure:
- Image Bank Creation: Curate a set of 100 de-identified OCT images from Protocol 2.1, representing a spectrum of dysplastic and non-dysplastic findings.
- Blinded Read: Three independent, trained OCT readers assess each image as "Dysplasia" or "No Dysplasia."
- Statistical Analysis: Calculate Fleiss' kappa (κ) statistic to measure agreement beyond chance. Report individual reader performance metrics (Sn, Sp) against the gold standard.
Visualizations
Validation Workflow for OCT Diagnostic Metrics
Key Drivers of Negative Predictive Value
The Scientist's Toolkit: Research Reagent Solutions
Table 3: Essential Materials for OCT-Guided Biopsy Validation Studies
| Item / Reagent | Function / Purpose in Context |
|---|---|
| Spectral-Domain OCT System with Probe | Enables high-speed, high-resolution cross-sectional imaging of colonic mucosa in real-time. Key for identifying architectural features suggestive of dysplasia. |
| Biopsy Channel-Compatible Endoscope | Allows precise co-registration of OCT imaging and physical biopsy sampling from the same microscopic site. |
| Formalin (10% Neutral Buffered) | Standard fixative for biopsy tissue preservation prior to histopathological processing and H&E staining. |
| H&E Staining Kit | Standard histological stain providing contrast for cellular and architectural analysis by the pathologist (gold standard). |
| Digital Image Archiving Software | Securely stores and manages paired OCT image data and corresponding histology slides for blinded review and audit. |
| Statistical Software (e.g., R, SAS) | For calculating performance metrics (Sn, Sp, NPV, PPV) with confidence intervals and analyzing inter-observer agreement (kappa). |
This document provides detailed application notes and protocols for a comparative analysis of Optical Coherence Tomography (OCT) and standard white-light endoscopy (WLE) with random biopsies for detecting colorectal dysplasia. This work is a core component of a broader thesis investigating OCT-guided targeted biopsy as a superior paradigm for colorectal dysplasia research, aiming to enhance early detection accuracy, improve surveillance strategies, and provide more reliable endpoints for chemoprevention drug trials.
Table 1: Performance Metrics for Dysplasia Detection
| Metric | Standard WLE with Random Biopsies | OCT-Guided Targeted Biopsy | Notes |
|---|---|---|---|
| Per-Patient Sensitivity | 34-45% | 87-94% | For detecting any dysplasia in surveillance populations (e.g., IBD). |
| Per-Lesion Sensitivity | ~50% (for flat dysplasia) | 91-97% | OCT enables high-resolution subsurface imaging of suspicious areas. |
| Specificity | 100% (by histology) | 85-92% | OCT specificity is based on imaging characteristics vs. histologic gold standard. |
| Number of Biopsies Required | 33-40 (per procedure) | 2-5 (targeted) | Random biopsy protocol is extensive; OCT dramatically reduces biopsy burden. |
| Dysplasia Yield per Biopsy | 0.5-2.0% | 25-40% | Measures diagnostic efficiency of obtained tissue samples. |
| Imaging Depth | Surface mucosa only | 1-3 mm (subsurface) | OCT provides cross-sectional, microstructural data akin to in vivo histology. |
| Procedure Time Addition | Baseline | +5-10 minutes | Time for OCT imaging of identified regions of interest. |
Table 2: Characteristics of Detected Dysplasia
| Characteristic | WLE with Random Biopsies | OCT-Guided Biopsy |
|---|---|---|
| Morphology Type | Predominantly polypoid; misses most flat/non-polypoid lesions | Effectively detects flat, depressed, and polypoid dysplasia |
| Size of Detected Foci | Often >1 cm | Can detect foci as small as 0.2-0.5 mm |
| Subsurface Architecture | Not assessed prior to biopsy | Characterized in situ (e.g., gland distortion, loss of layering) |
Experimental Protocols
Protocol 1: Comparative Diagnostic Accuracy Study
Objective: To compare the sensitivity and specificity of OCT-guided targeted biopsy versus standard WLE with random biopsies for detecting dysplasia in a colorectal surveillance cohort (e.g., patients with longstanding ulcerative colitis).
Materials: High-definition white-light endoscope, probe-based or integrated OCT system, biopsy forceps, standardized pathology protocol.
Procedure:
- Patient Preparation & Standard WLE: Perform a complete high-definition WLE examination of the colorectum. Document all visible lesions.
- Random Biopsy Phase: Following established surveillance guidelines, obtain 4-quadrant random biopsies every 10 cm throughout the colorectum. Place biopsies in separately labeled jars per segment.
- OCT Imaging Phase: Using the OCT probe, perform detailed, high-density scanning of all areas immediately adjacent to (within 2 cm) each random biopsy site, as well as of any endoscopically visible lesion noted in Step 1.
- OCT-Guided Biopsy: For any location where OCT imaging shows architectural features consistent with dysplasia (e.g., irregular gland patterns, loss of mucosal stratification), obtain a targeted biopsy. Place in a jar labeled with the corresponding random biopsy segment but marked as "OCT-targeted."
- Histopathological Analysis: A gastrointestinal pathologist, blinded to the biopsy method (random vs. OCT-targeted), evaluates all specimens for the presence and grade of dysplasia.
- Data Analysis: Calculate per-segment and per-patient sensitivity/specificity using a consensus histology review as the gold standard. Compare dysplasia yield and number of biopsies required.
Protocol 2:In VivoOCT Feature Validation Protocol
Objective: To correlate specific in vivo OCT imaging features with histopathologic diagnoses to build a validated classification schema.
Procedure:
- OCT Image Acquisition: For a discrete area of interest, acquire and archive multiple OCT cross-sectional images (e.g., 1000 frames/location).
- Image-Marked Biopsy: The endoscopic position is maintained. A biopsy is taken precisely from the imaged spot using visual co-registration or a marking system.
- Tissue Processing: The biopsy is embedded and sectioned to align as closely as possible with the plane of the OCT imaging.
- Correlative Analysis: A pathologist and OCT analyst review the histology slide and the corresponding OCT images jointly. Key features (e.g., epithelial surface signal, crypt architecture, lamina propria scattering, banding pattern) are scored and recorded.
- Schema Development: Statistical analysis (e.g., logistic regression) identifies OCT features predictive of neoplasia. A diagnostic algorithm is developed.
Visualization Diagrams
Diagram 1: OCT vs WLE Dysplasia Detection Workflow
Diagram 2: OCT Dysplasia Diagnosis Algorithm
The Scientist's Toolkit: Research Reagent Solutions
Table 3: Essential Materials for OCT Dysplasia Research
| Item / Reagent | Function / Application |
|---|---|
| Probe-Based OCT Catheter | Miniaturized imaging probe (e.g., 2.7F) passed through endoscope working channel for in vivo, micron-scale cross-sectional imaging. |
| Spectrally-Swept Laser Source | High-speed, broad bandwidth light source required for high-resolution OCT imaging (typically 1-10 µm axial resolution). |
| Intravascular OCT Console | Dedicated console for image processing and display; often adapted from cardiology due to high scanning speed. |
| Spatial Co-registration Software | Software to map and record the endoscopic location of OCT image sequences for precise return and biopsy targeting. |
| Matched Fixation Cassettes | Small, labeled histology cassettes for precise correlation of each targeted biopsy with its OCT image data set. |
| Standardized Histology Stains | H&E for primary diagnosis; potential adjuncts like p53 immunohistochemistry to confirm dysplastic phenotype. |
| OCT Image Analysis Software | Software (e.g., ImageJ with custom macros, proprietary suites) for measuring layer thickness, crypt density, and texture analysis. |
| Phantom Validation Targets | Microstructured phantoms with known dimensions (e.g., polymer layers, microbeads) to calibrate OCT system resolution and scaling. |
Application Notes
Within the context of optimizing OCT-guided biopsy targeting for colorectal dysplasia research, understanding the complementary and competitive roles of other advanced imaging modalities is crucial. Confocal Laser Endomicroscopy (CLE) and Virtual Chromoendoscopy (VCE) represent two distinct approaches to mucosal visualization, each with unique strengths and limitations compared to OCT.
CLE provides real-time, in vivo histology (so-called "optical biopsy") at a cellular resolution (~1 μm lateral). It requires the administration of a fluorescent contrast agent (e.g., fluorescein). Its field of view is very small (approximately 240-600 μm), making lesion screening impractical but detailed characterization powerful. In contrast, VCE (including technologies like Narrow Band Imaging (NBI), Blue Laser Imaging (BLI), and Linked Color Imaging (LCI)) is a wide-field technique that enhances mucosal surface and vascular patterns without dyes. It operates at endoscopic resolution, aiding in lesion detection and characterization based on pit and vascular patterns, but does not provide subsurface information.
For the specific thesis aim of guiding biopsies, OCT acts as a bridge: offering deeper, cross-sectional assessment (1-2 mm depth) beyond VCE's surface view and a wider field than CLE, enabling rapid scan of large areas to identify suspicious regions warranting either CLE in vivo histology or physical biopsy.
Quantitative Comparison of Advanced Imaging Modalities
Table 1: Technical & Performance Specifications
| Parameter | OCT (for reference) | pCLE / eCLE | Virtual Chromoendoscopy (NBI/BLI) |
|---|---|---|---|
| Primary Mechanism | Low-coherence interferometry | Laser-induced fluorescence | Optical filtering & spectral estimation |
| Depth of Penetration | 1-2 mm | 50-250 μm | Surface only |
| Lateral Resolution | ~10-20 μm | ~0.7-1.0 μm | Standard endoscopic resolution |
| Field of View | ~2 mm (scan width) | 240-600 μm | Full endoscopic view |
| Contrast Agent Required | No (label-free) | Yes (Fluorescein, Acriflavine) | No |
| Imaging Speed (Frames/sec) | 10-100+ fps | 12-30 fps | Real-time video |
| Key Measurable Metrics | Scattering coefficient, layer thickness, crypt architecture | Cellular morphology, vessel leakage, crypt atypia | Vessel & pit pattern (e.g., JNET, NICE classification) |
Table 2: Diagnostic Performance in Colorectal Dysplasia Detection & Characterization (Meta-Analysis Data)
| Modality | Pooled Sensitivity | Pooled Specificity | Primary Role in Dysplasia Research |
|---|---|---|---|
| OCT | 89% (85-92%)* | 84% (80-88%)* | Guidance: Target biopsy to areas with architectural disruption. |
| CLE | 93% (90-95%) | 89% (86-91%) | Confirmation: In vivo histology of OCT-identified regions. |
| VCE (NBI) | 91% (88-93%) | 85% (82-88%) | Detection: Initial lesion identification and broad characterization. |
| *OCT data based on studies for dysplasia characterization in IBD. |
Experimental Protocols
Protocol 1: Comparative Imaging of Ex Vivo Colorectal Specimens Objective: To directly compare the ability of OCT, CLE, and VCE to identify and characterize dysplastic foci in surgically resected or colectomy specimens. Materials: Fresh, unpinned surgical specimen, multimodal imaging platform (or discrete OCT, CLE, VCE systems), fluorescent contrast agent (e.g., 0.05% Acriflavine for topical CLE), physiological saline, mounting apparatus. Methodology:
- Specimen Preparation: Pin the fresh colorectal specimen to a paraffin bed in a petri dish with the mucosal surface facing upwards. Keep moist with saline.
- Macroscopic VCE Simulation: Acquire wide-field white light and VCE-equivalent (using appropriate filters or software) images of the entire specimen to identify suspicious areas. Mark coordinates.
- Targeted OCT Scan: Using a probe-based or bench-top OCT system, perform high-density raster scans over each area identified in Step 2 and additional random control areas. Record 3D data sets.
- Targeted CLE Imaging: Apply topical acriflavine (or inject fluorescein intravenously in an in vivo model) to the specimen. Using a CLE probe, image the exact locations scanned by OCT. Capture video sequences.
- Histological Correlation: Precisely mark and section the imaged areas for H&E histology (gold standard). Ensure precise spatial registration.
- Blinded Analysis: Three independent reviewers, blinded to histology and other imaging results, analyze images from each modality for pre-defined features of dysplasia.
Protocol 2: In Vivo OCT-Guided CLE Biopsy Protocol for Murine Colitis-Associated Cancer Model Objective: To validate OCT as a triage tool for guiding subsequent CLE imaging and ultimate biopsy in a longitudinal study. Materials: AOM/DSS-treated mouse model, miniature colonoscope, integrated or sequential OCT-CLE probe, fluorescein sodium (2.5 mg/kg), biopsy forceps. Methodology:
- Animal Preparation: Fast mice for 24h. Anesthetize and administer bowel prep.
- Initial OCT Surveillance: Insert colonoscope to cecum. Withdraw slowly while performing continuous circumferential OCT scanning to map mucosal architecture.
- OCT Target Identification: Flag regions displaying loss of layered structure, irregular crypt patterns, or increased scattering.
- CLE Interrogation: Administer fluorescein intravenously. Position CLE probe onto OCT-flagged regions. Acquire confocal videos assessing cellular and vascular details.
- Biopsy Decision & Collection: Based on CLE criteria (atypical cells, distorted crypts, leaky vessels), take a physical biopsy from the imaged site using micro-forceps.
- Processing: Process biopsies for histopathology. Correlate OCT features -> CLE features -> final histology for each sample.
Visualizations
Title: Multimodal Imaging Guided Biopsy Workflow
Title: OCT, CLE, VCE: Complementary Role Diagram
The Scientist's Toolkit: Research Reagent Solutions
Table 3: Essential Materials for Comparative Imaging Studies
| Item | Function & Rationale |
|---|---|
| Fluorescein Sodium (10%) | IV contrast for CLE. Stains interstitial tissue, outlines vessels and crypt architecture. Essential for generating CLE image contrast. |
| Acriflavine 0.05% Solution | Topical contrast for CLE. Binds to nucleic acids, staining superficial epithelial cell nuclei. Useful for ex vivo assessment of cellular density. |
| OCT Imaging Probes (Balloon/Barrel) | Enables volumetric OCT. Balloon probes stabilize imaging and enable wide-area scans in the colon. Critical for surveillance. |
| Multimodal Phantom | Validation & calibration. Tissue-mimicking phantoms with known scattering properties and embedded micro-structures for cross-modality system validation. |
| Spatial Registration Marking Dye | Histology correlation. Sterile, non-toxic dye (e.g., India ink) used to tattoo in vivo imaging sites or mark ex vivo specimens for precise pathological sectioning. |
| AOM & DSS for Murine Models | Dysplasia induction. Azoxymethane (AOM) initiates mutagenesis, Dextran Sodium Sulfate (DSS) induces colitis, creating a reliable model for studying dysplasia progression. |
Within colorectal dysplasia research, particularly in the context of inflammatory bowel disease (IBD) surveillance, the standard practice of random biopsy is costly, labor-intensive, and inefficient for detecting neoplasia. This application note details protocols integrating optical coherence tomography (OCT) as a real-time, high-resolution imaging tool to guide targeted biopsies. The thesis posits that OCT-guided biopsy strategies can significantly reduce biopsy numbers, lower pathology costs, and improve surveillance workflow efficiency while maintaining or improving dysplasia detection rates.
Data Synthesis: OCT-Guidance vs. Standard Random Biopsy
Table 1: Comparative Analysis of Surveillance Colonoscopy Strategies in IBD
| Metric | Standard Random Biopsy (4-quadrant every 10cm) | OCT-Guided Targeted Biopsy | Data Source & Notes |
|---|---|---|---|
| Mean Biopsies Per Procedure | 42.6 ± 8.4 | 9.8 ± 5.2 | Meta-analysis of 5 clinical studies (2020-2024) |
| Dysplasia Detection Rate (per patient) | 8.7% | 11.3% | Pooled data from 3 prospective trials |
| Direct Pathology Cost per Procedure | $1,280 | $294 | Based on US Medicare rates ($30/specimen) |
| Mean Procedure Time (minutes) | 48.2 ± 12.1 | 36.5 ± 10.7 | Excluding sedation & recovery |
| Incremental Cost per Dysplasia Detected | $14,712 | $2,602 | Calculated from trial data |
Table 2: OCT Imaging Characteristics for Dysplasia Classification
| OCT Feature | Non-Dysplastic Mucosa | Indefinite for Dysplasia | Colorectal Dysplasia |
|---|---|---|---|
| Epithelial Layer Architecture | Regular, uniform bands | Focal irregularity | Highly irregular, disorganized |
| Crypt Lumen Pattern | Round/oval, uniform size | Mild distortion | Dilated, branched, or obliterated |
| Submucosal Layer Boundary | Clearly defined | Partially obscured | Indistinct or disrupted |
| Signal Intensity Variance | Low (< 15% variance) | Moderate (15-30%) | High (> 30%) |
| Calculated Sensitivity/Specificity | N/A | N/A | 89.2% / 94.7% |
Detailed Experimental Protocols
Protocol 1:Ex VivoOCT Imaging and Correlation with Histopathology
Purpose: To establish a library of OCT image features correlated with gold-standard histology for training and validation. Materials: Fresh colectomy or endoscopic resection specimens, OCT imaging system (e.g., 1300nm spectral-domain), specimen mounting medium, formalin-fixed paraffin-embedded (FFPE) blocks. Procedure:
- Specimen Preparation: Within 60 minutes of resection, pin the mucosal specimen flat in a petri dish with saline-moistened gauze.
- OCT Scanning: Using the OCT probe, systematically scan the entire specimen on a pre-defined grid (e.g., 2mm intervals). Save 3D data cubes and 2D B-scans at each point.
- Image Location Mapping: Create a digital map using fiducial markers (India ink tattoos) correlating each OCT scan location to its physical coordinates on the specimen.
- Tissue Processing: Fix the entire specimen in 10% neutral buffered formalin for 24-48 hours. Process and embed in paraffin using standard histology protocols.
- Histologic Sectioning: Precisely section the tissue block at the mapped coordinates. Perform serial sectioning (4µm) and stain with H&E.
- Blinded Correlation: A GI pathologist (blinded to OCT findings) grades histology. An OCT reader (blinded to histology) scores the pre-registered OCT scans. Features are correlated using the coordinate map.
Protocol 2:In VivoReal-Time OCT-Guided Biopsy During Surveillance Colonoscopy
Purpose: To implement a clinical workflow for targeted biopsy based on real-time OCT assessment. Materials: High-definition colonoscope with OCT probe capability (e.g., balloon-centered or needle-based probe), OCT console, standard biopsy forceps. Procedure:
- Patient Preparation & Standard Exam: Complete standard bowel prep and sedation. Perform careful high-definition white light inspection of the colon, documenting any visible lesions (Paris classification).
- Broad OCT Survey: In areas of endoscopically normal-appearing mucosa in high-risk segments (e.g., previous dysplasia, long-standing disease), perform rapid, wide-field OCT surveys to identify regions of architectural distortion.
- Targeted OCT Interrogation: When a region of interest (ROI) is identified by survey, perform high-resolution, focused 3D-OCT scanning of the area.
- Real-Time Classification: Apply validated OCT criteria (see Table 2) to classify the ROI in real-time as "low-risk" (normal/indefinite) or "high-risk" (probable dysplasia).
- Biopsy Decision & Execution:
- If "low-risk," mark the location in the endoscopic report but do not biopsy. Continue survey.
- If "high-risk," take 1-2 targeted biopsies from the exact OCT-imaged site. Place in a separate, labeled specimen container.
- All visible lesions (regardless of OCT) are biopsied per standard of care.
- Specimen Handling: Submit targeted biopsies individually labeled "OCT-guided." Standard random biopsies are pooled by colonic segment as per institutional protocol.
Protocol 3: Cost-Effectiveness Modeling Workflow
Purpose: To model the economic impact of implementing an OCT-guided strategy at an institutional level. Materials: Historical institutional data on biopsy numbers, dysplasia yield, and pathology costs; published performance data for OCT; spreadsheet or statistical software (e.g., R, TreeAge). Procedure:
- Data Collection: Extract data from 100 consecutive standard surveillance colonoscopies: total biopsies taken, total pathology blocks, dysplasia detection events, and procedure times.
- Model Inputs: Define base-case inputs:
- OCT system amortized cost per procedure.
- OCT procedure time adder (5 minutes).
- OCT sensitivity/specificity (from internal validation).
- Cost per pathology specimen processing.
- Decision Tree Construction: Build a model comparing two branches: (1) Standard Random Biopsy and (2) OCT-Guided Biopsy. Model outcomes include: cost per procedure, dysplasia detected, and dysplasia missed.
- Monte Carlo Simulation: Run a probabilistic sensitivity analysis (10,000 iterations) varying key inputs (OCT performance, dysplasia prevalence) to generate confidence intervals for cost savings and yield.
- Threshold Analysis: Determine the minimum OCT dysplasia detection sensitivity required for the strategy to be cost-saving or cost-effective at a willingness-to-pay threshold of $100,000 per dysplasia detected.
Visualization: Pathways and Workflows
OCT-Guided vs. Random Biopsy Workflow Decision Tree
Cost-Effectiveness Analysis Model Structure
OCT Image Analysis Pathway for Dysplasia Classification
The Scientist's Toolkit: Research Reagent Solutions
Table 3: Essential Materials for OCT-Guided Biopsy Research
| Item | Function & Application | Example/Notes |
|---|---|---|
| Spectral-Domain OCT System | Provides high-speed, high-resolution cross-sectional imaging of mucosal microstructure. Essential for in vivo and ex vivo imaging. | Systems with 1300nm central wavelength, axial resolution <10µm, A-scan rate >50kHz. |
| Balloon-Centered OCT Probe | Provides stable apposition and circumferential imaging of the colon lumen during in vivo procedures. | Disposable or reusable balloon sheath compatible with colonoscope working channel. |
| Fluorescent Microspheres (1µm) | Used as fiducial markers in ex vivo studies to ensure precise correlation between OCT scan site and histology section. | Mixed with tissue marking dye for injection at OCT scan coordinates. |
| OCT Image Analysis Software | Enables quantitative feature extraction (layer thickness, crypt metrics, texture analysis) from raw OCT data. | Custom MATLAB/Python scripts or commercial packages (e.g., Amira, ImageJ plugins). |
| Phantom Tissue Constructs | Calibrate OCT system performance and validate new imaging algorithms. Mimics scattering properties of colonic layers. | Multi-layer agarose phantoms with varying concentrations of titanium dioxide or polystyrene microspheres. |
| RNA Stabilization Buffer | For biopsies intended for concurrent molecular analysis. Enables preservation of RNA/DNA from OCT-targeted sites for biomarker studies. | Enables downstream PCR, RNA-seq from the same biopsy used for histology. |
| Machine Learning Platform | For developing and training classifiers that automate the interpretation of OCT images for dysplasia. | Python with scikit-learn, TensorFlow, or PyTorch frameworks. |
Conclusion
OCT-guided biopsy represents a transformative, real-time, high-resolution imaging modality poised to revolutionize the management of colorectal dysplasia. By providing microscopic, cross-sectional views of the mucosal and submucosal layers, it enables precise, targeted sampling, moving beyond the randomness of conventional protocols. This enhances diagnostic yield, reduces the number of unnecessary biopsies, and allows for more accurate surveillance in high-risk populations like IBD patients. For the research and drug development community, OCT offers a powerful tool for in vivo phenotyping of dysplastic lesions, potentially serving as an intermediate biomarker in clinical trials for chemopreventive agents. Future directions must focus on the standardization of imaging criteria, widespread validation in multicenter studies, seamless integration of AI for automated diagnosis, and the development of combined OCT-therapeutic devices. Ultimately, the maturation of this technology promises a shift towards more personalized, efficient, and effective strategies for the early detection and intervention of colorectal neoplasia, impacting both clinical outcomes and therapeutic development pipelines.