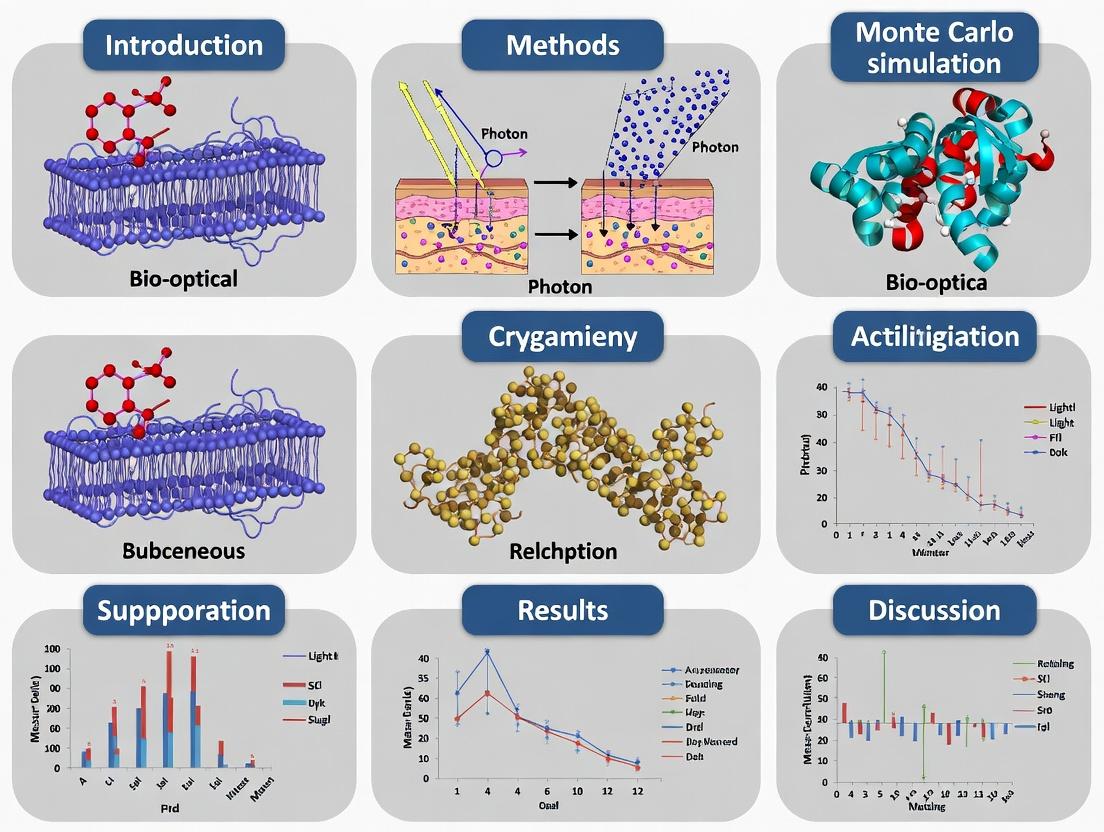
Mastering Subcutaneous Fat Measurement: A Comprehensive Guide to Monte Carlo Simulation for Biomedical Research
This article provides a complete technical and methodological guide to applying Monte Carlo simulation for subcutaneous adipose tissue (SAT) measurement.
Mastering Subcutaneous Fat Measurement: A Comprehensive Guide to Monte Carlo Simulation for Biomedical Research
Abstract
This article provides a complete technical and methodological guide to applying Monte Carlo simulation for subcutaneous adipose tissue (SAT) measurement. Targeting researchers, scientists, and drug development professionals, we cover foundational principles of light-tissue interaction and photon transport modeling. We detail practical implementation steps, from constructing 3D anatomical models to simulating NIR, optical coherence tomography (OCT), or ultrasound signals. The guide addresses common pitfalls, parameter optimization for accuracy, and advanced techniques like variance reduction. Finally, we present frameworks for validating simulations against clinical gold standards (e.g., MRI, CT) and critically compare Monte Carlo methods with analytical models and machine learning approaches. The synthesis offers actionable insights for enhancing non-invasive body composition analysis in metabolic disease research and pharmaceutical development.
What is Monte Carlo Simulation and Why is it Crucial for Subcutaneous Fat Analysis?
1. Introduction: The SAT Quantification Imperative and the Role of Simulation Accurate quantification of Subcutaneous Adipose Tissue (SAT) is critical in metabolic disease research, drug development for obesity, and body composition analysis. Direct, invasive methods are impractical for longitudinal studies, creating a reliance on non-invasive imaging. However, these techniques face significant challenges, including inconsistent segmentation protocols, poor soft-tissue contrast, and photon scattering effects that degrade accuracy. This context frames the imperative for Monte Carlo (MC) simulation as a foundational research tool. MC methods model the stochastic interaction of photons (or other signals) with biological tissues, providing a virtual laboratory to dissect and overcome the physical limitations of real-world imaging devices, thereby guiding the development of more accurate quantification protocols.
2. Current Landscape & Comparative Analysis of SAT Imaging Modalities The primary non-invasive modalities for SAT assessment are summarized in the table below. Each faces distinct challenges that MC simulation can help elucidate and mitigate.
Table 1: Comparative Analysis of Non-Invasive SAT Imaging Modalities
| Modality | Underlying Principle | Key Challenges for SAT Quantification | Typical SAT Volume Error Range |
|---|---|---|---|
| MRI (Gold Standard) | Nuclear magnetic resonance of protons in water/fat molecules. | High cost, long scan time, susceptibility to motion artifacts. Requires complex water-fat separation algorithms. | 2-5% (vs. anatomical reference) |
| CT | X-ray attenuation measured in Hounsfield Units (HU). | Ionizing radiation. Poor soft-tissue contrast between SAT and muscle at standard doses. Thresholding is operator-dependent. | 5-10% (vs. MRI) |
| Ultrasound (A-mode/B-mode) | Reflection of high-frequency sound waves at tissue interfaces. | Operator-dependent, limited field-of-view, difficult 3D volumetric analysis. Accuracy depends on assumed sound speed. | 10-20% (high variability) |
| Bioelectrical Impedance (BIA) | Resistance/Reactance to alternating current through body tissues. | Relies on population-specific equations. Cannot differentiate VAT from SAT. Highly sensitive to hydration status. | 15-25% (vs. DXA/MRI) |
| Near-Infrared Spectroscopy (NIRS) | Absorption and scattering of near-infrared light by chromophores (e.g., lipid, water). | Extreme sensitivity to photon scattering, shallow penetration depth (~2-3 cm), requires complex models for depth-resolved data. | Not yet standardized for volume |
3. Core Experimental Protocols for SAT Imaging Validation
Protocol 1: MRI-Based SAT Segmentation (Reference Standard Protocol)
- Objective: To establish a high-accuracy reference SAT volume from T1-weighted DIXON MRI sequences.
- Materials: 3T MRI Scanner, phantoms with known lipid content, image analysis software (e.g., 3D Slicer, SliceOmatic).
- Procedure:
- Subject Positioning & Acquisition: Position subject supine. Acquire axial T1-weighted DIXON (in-phase, out-phase, water-only, fat-only) images from the femoral head to the knee (for thigh SAT) or L1 to L5 (for abdominal SAT).
- Image Pre-processing: Apply bias field correction to correct for intensity inhomogeneity.
- Initial Segmentation: On the fat-only series, use semi-automatic region-growing to separate the body from the background.
- SAT-VAT Separation: Manually draw a contour along the internal boundary of the abdominal wall musculature (for abdominal scans) to separate SAT from visceral adipose tissue (VAT).
- Volume Calculation: Software computes SAT volume by summing the voxel areas multiplied by slice thickness.
- Quality Control: Two independent analysts segment each scan; inter-rater reliability (ICC >0.98) must be achieved.
Protocol 2: Multi-Distance NIRS System Calibration Using Phantom Models
- Objective: To calibrate a multi-distance NIRS system for SAT thickness estimation using tissue-simulating phantoms.
- Materials: Multi-distance NIRS probe (source-detector distances: 1.5, 2.5, 3.5, 4.5 cm), lipid emulsion phantoms with known absorption (μa) and reduced scattering (μs') coefficients, black rubber mat for total absorption reference.
- Procedure:
- Phantom Characterization: Measure μa and μs' of each phantom using a frequency-domain or spatially-resolved reference instrument.
- NIRS Data Acquisition: Place the NIRS probe flush against each phantom. Acquire diffuse reflectance intensity (Rd) at each source-detector distance. Repeat on the black rubber mat to obtain the "zero" reflectance signal.
- Monte Carlo Simulation: Run an MC simulation (e.g., using
mcxyz) with the phantom's known optical properties and the exact probe geometry to generate a lookup table (LUT) of expected Rd values. - Calibration Curve: Fit the measured Rd values (corrected for instrument response) to the MC-simulated LUT via an inverse model (e.g., diffusion theory approximation) to calibrate the system's response function.
- Inverse Problem: For in vivo measurements, use the calibrated model to inversely estimate the μa and μs' of the SAT layer, from which thickness can be inferred via specialized algorithms.
4. Visualization of Methodological Relationships & Workflows
Diagram 1: MC Simulation Addresses Key SAT Imaging Challenges
Diagram 2: Monte Carlo Simulation Workflow for NIRS
5. The Scientist's Toolkit: Key Research Reagent Solutions
Table 2: Essential Materials for SAT Quantification Research
| Item / Reagent | Function / Role in Research |
|---|---|
| Tissue-Simulating Optical Phantoms | Stable, reproducible materials with known absorption (μa) and scattering (μs') coefficients to calibrate and validate optical devices (NIRS, diffuse optical tomography). |
| Lipid Emulsion Standards | Chemical standards (e.g., Intralipid) used as scattering components in phantoms or in assays to quantify lipid content in biological samples. |
| Gadolinium-Based MRI Contrast Agents | Used in dynamic contrast-enhanced (DCE) MRI studies to assess adipose tissue vascularity and perfusion, relevant in metabolic syndrome research. |
| Dedicated Adipose Tissue Segmentation Software | Software packages (e.g., TomoVision's SliceOmatic, Philips' QLAB) with semi-automated algorithms for consistent segmentation of SAT from MRI/CT datasets. |
| Open-Source Monte Carlo Simulation Platforms | Software tools (e.g, mcxyz, TIM-OS, Monte Carlo eXtreme (MCX)) that enable researchers to model light transport in multi-layered tissues for device optimization. |
| 3D Anatomical Adipose Tissue Atlases | Probabilistic maps of SAT distribution derived from population imaging data, used as spatial priors to improve segmentation algorithms and for comparative analysis. |
Within the broader thesis on advancing non-invasive subcutaneous adipose tissue (SAT) measurement, the selection of a computational photon transport model is critical. This document establishes Monte Carlo (MC) methods as the indispensable gold standard for simulating light propagation in turbid, multi-layered biological tissues like skin and fat. Its stochastic approach, which tracks millions of individual photon packets through scattering and absorption events, provides unparalleled accuracy for modeling complex geometries and heterogeneities inherent to SAT, against which all faster, simplified models must be validated.
Quantitative Data: Key Parameters for MC Simulation of Subcutaneous Fat
The following tables summarize essential optical and geometric parameters required for accurate MC modeling of photon transport in the skin-SAT-muscle system.
Table 1: Representative Optical Properties of Tissues in the Near-Infrared (NIR) Range (e.g., 800-1000 nm)
| Tissue Layer | Absorption Coefficient (μa, cm⁻¹) | Reduced Scattering Coefficient (μs', cm⁻¹) | Refractive Index (n) | Anisotropy Factor (g) |
|---|---|---|---|---|
| Epidermis/Dermis | 0.1 - 0.3 | 15 - 25 | 1.37 - 1.4 | 0.8 - 0.95 |
| Subcutaneous Fat (SAT) | 0.05 - 0.15 | 8 - 15 | 1.44 | 0.7 - 0.9 |
| Muscle | 0.2 - 0.5 | 8 - 12 | 1.38 | 0.9 - 0.95 |
Note: Values are wavelength-dependent. SAT is characterized by lower absorption and scattering compared to dermis, a key contrast exploited for measurement.
Table 2: Common MC Simulation Parameters for SAT Studies
| Parameter | Typical Value/Range | Function/Impact |
|---|---|---|
| Number of Photon Packets | 10⁷ - 10⁹ | Determines statistical noise; higher counts improve accuracy. |
| Voxel/Grid Resolution | 0.01 - 0.1 mm | Spatial resolution for recording photon absorption (3D map). |
| SAT Layer Thickness | 2 - 30 mm | Primary variable of interest in SAT measurement studies. |
| Source-Detector Separation | 10 - 30 mm | Critical for probing different tissue depths; sensitivity to SAT varies with distance. |
| Light Source Type | Pencil beam, Gaussian, Diffuse | Defines initial photon injection conditions. |
Experimental Protocols
Protocol 1: Validating a Simplified Algorithm Using MC as Ground Truth Objective: To calibrate and validate a rapid, analytical diffusion theory model for SAT thickness estimation against the gold-standard MC method. Materials: High-performance computing cluster, validated MC code (e.g., MCML, tMCimg, or custom C++/CUDA), post-processing software (MATLAB, Python). Procedure:
- MC Ground Truth Generation: Using parameters from Tables 1 & 2, run a series of MC simulations where SAT thickness is systematically varied (e.g., 2, 5, 10, 15, 20 mm). All other optical properties and geometry are held constant. Record the spatially resolved diffuse reflectance profile for each simulation.
- Data Extraction: For each simulation, extract the diffuse reflectance at specific source-detector separations (e.g., 15, 20, 25 mm) known to be sensitive to the fat layer.
- Analytical Model Fitting: Input the same optical properties and source-detector separations into the simplified diffusion model. Adjust any empirical scaling factors in the analytical model to minimize the difference between its predicted reflectance and the MC-generated reflectance across all thicknesses.
- Validation: Use the fitted analytical model to predict SAT thickness from a new set of MC-simulated reflectance data (not used in fitting). Calculate the root-mean-square error (RMSE) and correlation coefficient (R²) between predicted and true (simulated) SAT thickness. Outcome: A calibrated, rapid model whose accuracy bounds and limitations are explicitly defined by comparison to the MC gold standard.
Protocol 2: Optimizing Source-Detector Geometry for Maximum SAT Sensitivity Objective: To use MC simulation to determine the optimal light source and detector placement on the skin surface for maximizing measurement sensitivity to SAT layer changes. Materials: GPU-accelerated MC simulation software, parameter sweep automation script. Procedure:
- Model Definition: Construct a three-layer MC model (Skin/SAT/Muscle) with baseline properties from Table 1 and a mid-range SAT thickness (e.g., 10 mm).
- Parameter Sweep:
- Run simulations with a single source and a single detector at increasing lateral distances (source-detector separation from 5 mm to 40 mm in 1 mm steps).
- For a multi-detector probe design, simulate one source and an array of detectors at different distances simultaneously.
- Sensitivity Analysis: For each detector distance, run two additional simulations: one with SAT thickness increased by 10% (11 mm) and one decreased by 10% (9 mm). Calculate the normalized sensitivity:
S = (ΔSignal / Signal_baseline) / (ΔThickness / Thickness_baseline). - Optimization: Plot sensitivity versus source-detector separation. The separation(s) yielding the highest sensitivity indicate the optimal geometry for detecting SAT thickness variations. Outcome: Data-driven design of probe hardware for in-vivo SAT measurement devices.
Visualization
Title: Monte Carlo Photon Packet Lifecycle in Tissue
Title: MC Simulation Workflow for Fat Measurement R&D
The Scientist's Toolkit: Research Reagent Solutions
| Item/Category | Function in MC-Based SAT Research |
|---|---|
| GPU-Accelerated MC Code (e.g., gMCml, CUDAMC) | Drastically reduces computation time (from hours to minutes) for simulating the billions of photon packets required for high-fidelity, voxelated tissue models and sensitivity analyses. |
| Validated Tissue Optical Property Database | A curated repository of measured μa and μs' for skin, fat, and muscle across relevant wavelengths. Essential for defining accurate simulation input parameters. |
| Multi-Layer Skin-Fat Phantom Kits | Physical phantoms with tunable optical properties and layer thicknesses. Used for experimental validation of MC simulation predictions in a controlled, benchtop setting. |
| Automated Parameter Sweep & Analysis Scripts (Python/MATLAB) | Custom scripts to systematically vary input parameters (e.g., SAT thickness, source-detector distance), launch batch simulations, and post-process output data into sensitivity metrics. |
| High-Performance Computing (HPC) or Cloud Compute Credits | Access to computational resources necessary for large-scale simulation studies, parameter optimizations, and generating comprehensive training datasets for machine learning models. |
1. Introduction & Thesis Context This document provides detailed application notes and experimental protocols for characterizing the biophysical properties of skin layers, framed within a broader thesis on developing accurate Monte Carlo (MC) simulation models for non-invasive subcutaneous fat measurement. Precise optical and acoustic property inputs are critical for MC simulations to predict photon or sound wave propagation, enabling the differentiation of subcutaneous adipose tissue from the dermis and muscle.
2. Optical Properties: Quantitative Data & Significance Optical properties govern light-tissue interaction. Key parameters include the absorption coefficient (μa), reduced scattering coefficient (μs'), and anisotropy factor (g). These are wavelength-dependent.
Table 1: Representative Optical Properties at Key Wavelengths (Approximate Values from Literature)
| Tissue Layer | Wavelength (nm) | μa (cm⁻¹) | μs' (cm⁻¹) | g | Refractive Index (n) | Primary Chromophores |
|---|---|---|---|---|---|---|
| Epidermis | 500 | 20-40 | 30-50 | 0.85-0.95 | ~1.38 | Melanin, Hemoglobin |
| 660 | 2-5 | 20-30 | 0.85-0.95 | ~1.38 | Hemoglobin, Water | |
| 940 | 0.5-2 | 15-25 | 0.85-0.95 | ~1.38 | Water, Lipids | |
| Dermis | 500 | 2-5 | 20-30 | 0.85-0.95 | ~1.39 | Hemoglobin (Oxy/Deoxy) |
| 660 | 0.3-0.8 | 15-25 | 0.85-0.95 | ~1.39 | Water, Hemoglobin | |
| 940 | 0.2-0.5 | 10-20 | 0.85-0.95 | ~1.39 | Water, Collagen | |
| Subcutaneous Fat | 500 | 0.5-2 | 10-20 | 0.85-0.95 | ~1.44 | Carotenoids, Minor Blood |
| 660 | 0.2-0.5 | 8-15 | 0.85-0.95 | ~1.44 | Water, Lipids | |
| 940 | 0.5-1.5 | 5-12 | 0.85-0.95 | ~1.44 | Lipids (C-H bonds) | |
| Muscle | 660 | 0.3-0.7 | 10-20 | 0.85-0.95 | ~1.41 | Myoglobin, Water |
| 940 | 0.3-0.6 | 8-15 | 0.85-0.95 | ~1.41 | Water, Proteins |
Note: Values are highly subject-specific; these ranges serve as inputs for baseline MC models.
Protocol 2.1: Inverse Adding-Doubling (IAD) Method for Ex Vivo Optical Property Determination Objective: To measure μa and μs' of thin tissue samples (e.g., from biopsy). Materials: Dual-beam spectrophotometer with integrating sphere, cryotome, sample holder, index-matching fluid (glycerol/saline). Procedure:
- Prepare ex vivo tissue samples (<2mm thickness) using a cryotome.
- Mount sample between glass slides with index-matching fluid.
- Place sample at the entrance port of the integrating sphere.
- Measure total reflectance (Rₜ) and total transmittance (Tₜ) across desired wavelength range (e.g., 400-1000 nm).
- Measure collimated transmittance (T꜀) to determine the scattering coefficient.
- Input Rₜ, Tₜ, and sample thickness into IAD software to compute μa and μs'. Anisotropy factor (g) is typically assumed (~0.9) or derived from Mie theory.
3. Acoustic Properties: Quantitative Data & Significance Acoustic properties determine ultrasound interaction, including speed of sound (SoS), acoustic impedance (Z), and attenuation coefficient (α). These are frequency-dependent.
Table 2: Representative Acoustic Properties at 5 MHz (Approximate Values)
| Tissue Layer | Speed of Sound (m/s) | Acoustic Impedance (MRayl) | Attenuation Coefficient @ 5 MHz (dB/cm) | Density (kg/m³) |
|---|---|---|---|---|
| Dermis | 1550 - 1650 | 1.6 - 1.7 | 2 - 5 | 1050 - 1150 |
| Subcutaneous Fat | 1430 - 1480 | 1.3 - 1.4 | 0.5 - 1.2 | 900 - 950 |
| Muscle (parallel) | 1580 - 1630 | 1.6 - 1.7 | 2 - 4 | 1050 - 1100 |
Protocol 3.1: Pulse-Echo Ultrasound for SoS & Attenuation Measurement Objective: To determine speed of sound and attenuation in tissue samples. Materials: Pulse-echo ultrasound system, transducer (e.g., 5 MHz), reference reflector (steel plate), temperature-controlled water tank, sample holder. Procedure:
- Calibrate system by measuring echo time from reflector in water at known temperature (SoS in water is known).
- Immerse tissue sample of known thickness (d) in the path between transducer and reflector.
- Record the time delay (Δt) of the reflected pulse with and without the sample.
- Calculate SoS in tissue (cₜ): 1/cₜ = (1/cw) - (Δt / 2d), where cw is SoS in water.
- Measure the amplitude reduction of the reflected pulse with the sample in place.
- Calculate attenuation coefficient: α = (20/d) * log₁₀(Aref / Asample) - α_water, where A are amplitudes.
4. The Scientist's Toolkit: Key Research Reagents & Materials
| Item | Function & Application |
|---|---|
| Integrating Sphere | Collects all diffusely reflected/transmitted light for accurate optical property measurement. |
| Index-Matching Fluid | Reduces surface scattering at tissue-glass interfaces during optical measurements. |
| Broadband Light Source | E.g., Tungsten halogen or laser diodes, to probe optical properties across wavelengths. |
| High-Frequency Ultrasound Transducer | Provides axial/lateral resolution suitable for resolving skin layers (e.g., 20-50 MHz). |
| Tissue-Mimicking Phantoms | Gelatin or silicone-based phantoms with known optical/acoustic properties for system validation. |
| Spectrometer/Photodetector Array | Measures wavelength-resolved light intensity for spectroscopy. |
| Temperature Controller | Critical for acoustic measurements, as SoS is temperature-sensitive. |
| MC Simulation Software | E.g., MCML, TIM-OS, or custom code, to model photon transport using measured properties. |
5. Monte Carlo Simulation Integration Workflow
Diagram 1: MC Simulation & Property Integration Workflow (99 chars)
6. Experimental Protocol: Integrated Optical-Acoustic Phantom Study
Protocol 6.1: Multi-Modal Phantom Validation for MC Calibration Objective: To create and characterize a tissue-mimicking phantom that replicates the optical and acoustic properties of a skin-fat-muscle structure for MC model validation. Materials:
- Base: Gelatin or polyvinyl chloride plastisol (PVCP).
- Optical Scatterer: Titanium dioxide (TiO₂) or polystyrene microspheres.
- Optical Absorber: India ink or nigrosin.
- Acoustic Scatterer: Silica or glass beads (≤ 50 μm).
- Lipid Emulsion: Intralipid or olive oil (to mimic fat layer properties).
- Molds, heaters, stirrers.
- Optical and ultrasound measurement systems (as per Protocols 2.1 & 3.1). Procedure:
- Design a three-layer phantom mold corresponding to typical dermis, fat, and muscle thicknesses.
- Dermis Layer: Prepare a gel mixture with scatterers and absorbers to match Table 1 (e.g., at 660 nm). Pour into mold, let set.
- Fat Layer: Prepare a separate gel mixture with lipid emulsion and low scatterer concentration to match low μs' and SoS of fat (Tables 1 & 2). Pour on top of dermis layer.
- Muscle Layer: Prepare a gel with properties matching muscle (higher attenuation, intermediate SoS). Pour on top.
- Let phantom solidify fully at 4°C.
- Characterize each layer optically (using IAD on samples from batch material) and acoustically (using pulse-echo).
- Perform in situ measurements on the layered phantom using diffuse optical spectroscopy and ultrasound imaging.
- Input the measured phantom properties into the MC simulation. Compare the simulation output (e.g., spatially resolved reflectance, ultrasound A-line) directly with the experimental data from the phantom.
- Iteratively refine simulation parameters until agreement is within 5%. This validated model is then used for in vivo research.
Within the broader thesis on Monte Carlo (MC) simulation for subcutaneous adipose tissue (SAT) measurement research, the transition from stochastic theory to reliable in vivo outcomes is paramount. This application note details how MC modeling, grounded in probability distributions of photon transport, translates into predictable results for clinical and drug development applications, such as monitoring adiposity changes in metabolic disease trials.
Core Principles: Stochastic Modeling of Light-Tissue Interaction
MC simulations model photon packets as they propagate, scatter, and absorb in turbid media like SAT. Key stochastic events include:
- Scattering: Determined by the scattering coefficient (µs) and anisotropy factor (g), following a Henyey-Greenstein phase function.
- Absorption: Governed by the absorption coefficient (µa) of chromophores (e.g., lipids, water, hemoglobin).
- Pathlength: The distance between interactions is sampled from an exponential probability distribution.
The aggregate of billions of such random walks predicts measurable quantities like diffuse reflectance, enabling the design of optimal optical measurement systems.
Application Notes: From Simulation to Validation
Note 1: Optimizing Source-Detector Separation for SAT Oximetry
Objective: Determine the optimal source-detector separation (SDS) in a near-infrared spectroscopy (NIRS) probe to maximize sensitivity to SAT while minimizing contamination from underlying muscle. MC Simulation Protocol:
- Model Construction: Create a 3-layer geometry (epidermis/dermis, SAT, muscle) with literature-based optical properties (µa, µs', g) at 735 nm & 850 nm.
- Parameter Sweep: Simulate photon transport (1e7 packets) across SDS from 5 mm to 30 mm in 1 mm increments.
- Output Metric: Calculate the partial pathlength in the SAT layer for each SDS.
- Analysis: Identify SDS where SAT partial pathlength is maximized and the ratio of SAT-to-muscle pathlength is >3.
Quantitative Findings: Table 1: MC-Predicted Optimal SDS for SAT Sensitivity
| Wavelength (nm) | SAT Thickness (mm) | Optimal SDS (mm) | SAT Pathlength Fraction (%) |
|---|---|---|---|
| 735 | 15 | 18 | 68 |
| 735 | 25 | 22 | 72 |
| 850 | 15 | 20 | 65 |
| 850 | 25 | 24 | 70 |
Note 2: Predicting Accuracy of Fat Fraction Measurement
Objective: Quantify the expected error in lipid concentration estimation using spatially resolved spectroscopy (SRS) under varying skin melanin content. MC Simulation & Validation Protocol:
- Forward MC: Generate a lookup table of diffuse reflectance profiles (R(ρ)) for combinations of lipid (0-90%), water (10-70%), and melanin (1-10%) volumes.
- Inverse Algorithm: Apply a Levenberg-Marquardt algorithm to extract parameters from simulated "measurements" with added Gaussian noise.
- Error Analysis: Compare extracted vs. true lipid concentrations across 1000 noise instances for each melanin level.
Quantitative Findings: Table 2: Predicted Lipid Measurement Error vs. Skin Pigmentation
| Melanin Volume (%) | Mean Absolute Error (Lipid %) | Error Increase vs. Baseline |
|---|---|---|
| 2 (Baseline) | 1.8 | - |
| 5 | 3.1 | 72% |
| 8 | 5.7 | 217% |
| 10 | 8.9 | 394% |
Detailed Experimental Validation Protocol
Title: In Vivo Validation of MC-Optimized NIRS for SAT Measurement
Objective: To validate MC-derived predictions of SAT oximetry accuracy using a controlled venous occlusion test on human tissue.
Materials:
- MC-optimized multi-wavelength NIRS system (e.g., 735, 810, 850 nm).
- Pressure cuff and regulator.
- Anatomical imaging system (Ultrasound or MRI) for SAT thickness measurement.
- Phantoms with known optical properties for system calibration.
Procedure:
- Subject Positioning & Characterization: Position subject supine. Measure SAT thickness at probe site using ultrasound. Record skin melanin index via spectrophotometer.
- Probe Placement & Baseline: Place the NIRS probe at the MC-predicted optimal SDS for the measured SAT thickness. Acquire 5 minutes of baseline data.
- Venous Occlusion: Inflate pressure cuff on the proximal limb to 50 mmHg to impede venous return. Record NIRS data for 3 minutes.
- Recovery: Release cuff and record 5 minutes of recovery data.
- Data Analysis: Calculate the rate of change in deoxygenated hemoglobin (HHb) in the SAT compartment during occlusion. Compare the absolute HHb change to MC-predicted sensitivity.
Expected Outcome: A strong linear correlation (R² > 0.85) between MC-predicted measurement sensitivity and the experimentally observed HHb rate of change across subjects with varying SAT thickness.
The Scientist's Toolkit
Table 3: Key Research Reagent Solutions & Materials
| Item | Function in SAT Measurement Research |
|---|---|
| Tissue-Simulating Phantoms (Lipid-based, e.g., Intralipid suspensions) | Provide stable, known optical properties (µa, µs') for calibrating NIRS systems and validating MC simulation accuracy. |
| MC Simulation Software (e.g., MCX, tMCimg, Custom MATLAB/Python code) | Implements the stochastic photon transport model to simulate measurements, optimize probe design, and generate training data for inverse models. |
| Multi-Wavelength NIRS System (e.g., continuous wave or frequency domain) | The primary hardware for in vivo data acquisition, measuring spatially or time-resolved diffuse reflectance. |
| Inverse Problem Solver Toolkit (e.g., Levenberg-Marquardt, Neural Network libraries) | Extracts physiological parameters (lipid fraction, oxygenation) from measured NIRS data using MC-generated models. |
| Co-registration Tools (Ultrasound, MRI) | Provides ground-truth anatomical data (SAT thickness) for probe positioning and model validation. |
Visualized Workflows & Relationships
Diagram Title: Translation from Stochastic Model to Tissue Measurement
Diagram Title: Monte Carlo Simulation Workflow for SAT
This document, framed within a thesis on advancing Monte Carlo (MC) simulation for subcutaneous adipose tissue (SAT) measurement, details the essential software tools and computational prerequisites for photon migration research. Accurate SAT quantification is critical for metabolic disease research and drug development. MC simulations are the gold standard for modeling light-tissue interactions, informing optical device design, and validating inverse algorithms for fat layer measurement.
A live search for current MC simulation software in biomedical optics reveals a core set of established and emerging tools.
Table 1: Key Monte Carlo Simulation Software for Photon Migration in Tissue
| Software Tool | Primary Language/Platform | Key Features/Strengths | Typical Use Case in SAT Research | License/Model |
|---|---|---|---|---|
| MCML (Monte Carlo for Multi-Layered media) | C, Standalone executable | Standard for planar layered tissues; fast, highly validated. | Modeling light penetration into skin-fat-muscle layers. | Public Domain |
| TIM-OS (Total Integrated Model of Optical Spectroscopy) | C++, MATLAB API | Complex 3D voxel-based geometry; extensive source/detector models. | Simulating heterogeneous fat distribution & optical probe geometry. | Open Source (CPOL) |
| MMC (Mesh-based Monte Carlo) | C/C++, MATLAB/Octave | Handles arbitrary shapes using tetrahedral meshes (e.g., from MRI/CT). | Simulating light transport in anatomically accurate SAT regions. | GPLv3 |
| CUDAMCML | CUDA C (GPU) | GPU-accelerated version of MCML; extreme speedup (>100x). | High-throughput parameter sweeps for inverse model training. | Free for research |
| MCX (Monte Carlo eXtreme) | CUDA C (GPU) | GPU-based for 3D heterogeneous volumes; real-time visualization potential. | Complex 3D simulations of near-infrared spectroscopy (NIRS) of SAT. | GPLv3 |
Computational Needs Analysis
The computational demand scales with simulation complexity, governed by photon count, tissue geometry, and optical property variance.
Table 2: Computational Resource Requirements
| Simulation Scenario | Typical Photon Count | Estimated Runtime (CPU) | Recommended Hardware | Key Bottleneck |
|---|---|---|---|---|
| MCML: Single 4-layer simulation | 10^7 | 2-5 minutes | Modern laptop (4+ cores) | Single-thread CPU speed |
| Parameter Sweep (1000 runs) | 10^7 per run | ~3 days | Workstation (16+ cores) or Cluster | Multi-core CPU throughput |
| TIM-OS/MMC: Complex 3D geometry | 10^8 | Several hours to days | High RAM Workstation (32+ GB RAM) | Memory & CPU |
| GPU-accelerated (CUDAMCML/MCX) | 10^8 | Minutes | NVIDIA GPU (8+ GB VRAM) | GPU memory & cores |
Application Notes & Protocols
Protocol 1: Standardized Simulation of NIRS for SAT Layer Thickness
Objective: To simulate the diffuse reflectance spectrum (600-1000 nm) for a 4-layer skin model (epidermis, dermis, SAT, muscle) and assess sensitivity to SAT thickness variations.
- Software: MCML or CUDAMCML for speed.
- Model Definition:
- Layer thicknesses (initial): Epidermis=0.1 mm, Dermis=1.5 mm, SAT=Variable (5-25 mm), Muscle=Semi-infinite.
- Optical Properties (µa, µs', g, n): Compile from literature (e.g., Jacques 2013) for each wavelength and tissue type into an input file.
- Execution Script:
- Write a batch script (Bash/Python) to loop SAT thickness from 5 to 25 mm in 1 mm increments.
- For each thickness, generate an MCML input file, execute the simulation with 10^7 photons, and parse the output diffuse reflectance (R_d).
- Data Analysis:
- Plot Rd vs. wavelength for different SAT thicknesses.
- Calculate sensitivity: ΔRd / Δ(SAT Thickness) at key wavelengths (e.g., 930 nm, lipid absorption peak).
Protocol 2: Validating a Probe Design with TIM-OS
Objective: To model the photon sampling volume of a multi-distance, fiber-based optical probe on a curved skin surface over SAT.
- Geometry Construction:
- Define a 3D voxel space in TIM-OS (e.g., 50x50x50 mm).
- Assign tissue types: Create a curved surface layer for skin, followed by a homogeneous SAT layer, then muscle.
- Source & Detector Configuration:
- Define point sources at 1.5, 2.5, and 3.5 mm from the probe center.
- Define circular detector areas (matching fiber diameter) co-localized with each source.
- Simulation & Output:
- Run simulation with 10^8 photons.
- Extract the spatial sensitivity profile (banana-shaped regions) and detector photon weights.
- TIM-OS outputs the Jacobian (∂R/∂µa) for each source-detector pair, critical for inverse problem solving.
The Scientist's Toolkit: Research Reagent Solutions
Table 3: Essential Materials for Experimental Validation of MC Simulations
| Item | Function in SAT Research | Example/Note |
|---|---|---|
| Tissue-simulating Phantoms | Calibrate simulation optical properties; validate models. | Liquid phantoms with Intralipid (scatterer) & India Ink (absorber). Lipid emulsions for SAT absorption. |
| Structured Layer Phantom | Validate layered MC models (e.g., MCML). | Fabricated slabs of silicone or polyurethane with precise thickness & optical properties. |
| Near-Infrared Spectrometer | Acquire experimental diffuse reflectance/transmittance spectra. | Systems from companies like Ocean Insight or Teledyne Princeton Instruments (900-1700 nm range). |
| Source & Detector Fibers | Implement probe designs in vitro/in vivo. | Multimode optical fibers (e.g., 400 µm core). |
| Reference Standard (Spectralon) | Provide >99% diffuse reflectance reference for spectrometer calibration. | Essential for quantitative measurement. |
| 3D Imaging Data (MRI/CT) | Provide anatomical geometry for mesh-based (MMC) simulations. | DICOM datasets of abdominal wall used to segment SAT layer. |
Visualizations
MC Simulation Workflow for SAT Research
Multi-Layer Skin & SAT Model for MCML
Step-by-Step Guide: Building and Running Your SAT Measurement Simulation
This Application Note details the first critical step in a Monte Carlo simulation (MCS) pipeline for subcutaneous adipose tissue (SAT) measurement research. The anatomical model's definition, comprising layer thickness, geometry, and heterogeneity, establishes the simulation domain and directly governs photon transport physics. A meticulously defined model is foundational for generating accurate, clinically relevant simulations of light-tissue interaction, which is essential for developing and validating optical techniques like diffuse reflectance spectroscopy or spatially resolved spectroscopy for SAT quantification.
Core Anatomical Parameters & Quantitative Data
The following tables summarize key quantitative parameters required to define a representative, multi-layered anatomical model of the abdominal wall for SAT-focused MCS.
Table 1: Representative Layer Thickness & Optical Properties (at 940 nm) Note: Optical properties are given as: μa (absorption coefficient, cm⁻¹), μs' (reduced scattering coefficient, cm⁻¹), g (anisotropy factor), n (refractive index). Values are population-averaged estimates. Individual variability is high.
| Tissue Layer | Typical Thickness Range (mm) | μa (cm⁻¹) | μs' (cm⁻¹) | g | n | Source / Key Reference |
|---|---|---|---|---|---|---|
| Stratum Corneum | 0.01 - 0.02 | 0.1 - 0.5 | 15 - 25 | 0.90 | 1.55 | Sandberg et al., 2021 |
| Viable Epidermis | 0.05 - 0.10 | 0.4 - 1.0 | 20 - 30 | 0.85 | 1.34 | Jacques, 2013 |
| Papillary Dermis | 0.2 - 0.4 | 0.5 - 1.5 | 18 - 28 | 0.85 | 1.40 | Tseng et al., 2023 |
| Reticular Dermis | 1.0 - 2.0 | 0.5 - 1.8 | 16 - 24 | 0.85 | 1.40 | Tseng et al., 2023 |
| Subcutaneous Fat (SAT) | 5.0 - 30.0+ | 0.1 - 0.3 | 8 - 14 | 0.85 - 0.90 | 1.44 | Ash et al., 2022 |
| Muscle | Semi-infinite | 0.2 - 0.5 | 10 - 15 | 0.90 | 1.41 | Simpson et al., 2023 |
Table 2: Sources of Geometrical & Structural Heterogeneity in SAT
| Heterogeneity Type | Description | Impact on Photon Transport | Modeling Approach |
|---|---|---|---|
| Fascial Septa | Collagen-rich fibrous bands traversing SAT, connecting dermis to deeper fascia. | High scattering regions; create optical "barriers" and compartments. | Incorporate as thin, high-μs' planes or mesh structures within the fat layer. |
| Adipocyte Lobules | Polygonal clusters of adipocytes (50-200 μm diameter) bounded by septa. | Creates a composite medium with varying scatterer density. | Model as voxelized regions with slightly varying μs' or use effective bulk properties. |
| Vascularization | Arterioles, venules, and capillaries within septa and between lobules. | Localized high absorption (μa) from hemoglobin. | Include as absorbing cylindrical structures or statistical blood volume fraction. |
Experimental Protocols for Parameterization
Protocol 3.1: High-Frequency Ultrasound (HFUS) for Layer Thickness & Geometry
Objective: To obtain in vivo, subject-specific measurements of epidermal+dermal thickness and SAT layer thickness and gross morphology. Materials: See "The Scientist's Toolkit" below. Procedure:
- Subject Positioning & Site Marking: Position subject supine. Mark a 4x4 cm grid on the abdominal site (e.g., peri-umbilical).
- Acoustic Coupling: Apply a generous amount of ultrasound gel to the transducer head and the marked site.
- Image Acquisition: Place transducer perpendicular to skin surface. Acquire B-mode images at each grid intersection.
- Calibration: Use built-in software calipers calibrated against known distance standards in the image.
- Measurement: In each image, measure (a) distance from skin surface to dermal-hypodermal junction, and (b) distance from dermal-hypodermal junction to the superficial fascia/muscle interface (SAT thickness).
- Geometric Reconstruction: Compile thickness measurements across the grid to create a 2D thickness map. Calculate average, minimum, maximum, and standard deviation of SAT thickness for the site.
Protocol 3.2: Ex Vivo Histology for Heterogeneity Characterization
Objective: To quantify the scale and density of fascial septa and adipocyte lobules for realistic heterogeneity modeling. Materials: See "The Scientist's Toolkit" below. Procedure:
- Tissue Biopsy & Fixation: Obtain human SAT biopsy (e.g., from elective surgery). Immediately fix in 10% neutral buffered formalin for 48 hours.
- Processing & Sectioning: Process tissue through graded ethanol and xylene, embed in paraffin. Cut 5 μm thick sections using a microtome.
- Staining: Stain with Masson's Trichrome (collagen: blue; adipocytes: red).
- Digital Imaging: Scan slides using a whole-slide scanner at 20x magnification.
- Image Analysis (Using e.g., ImageJ/FIJI): a. Septa Analysis: Apply a color deconvolution plugin to isolate collagen (blue) signal. Threshold to create a binary mask. Measure total septa area fraction and septa width distribution. b. Lobule Analysis: Isolate adipocyte (red) signal. Use "Analyze Particles" to measure lobule equivalent diameter and area.
Model Definition Workflow Diagram
Diagram Title: Workflow for Defining the Anatomical Model for SAT MCS
The Scientist's Toolkit: Research Reagent Solutions & Essential Materials
Table 3: Essential Materials for Anatomical Model Parameterization
| Item / Reagent | Function in Protocols | Specification / Note |
|---|---|---|
| High-Frequency Ultrasound System | In vivo measurement of skin and SAT layer thickness and architecture. | Linear array transducer, ≥20 MHz center frequency. e.g., Vevo MD (Fujifilm), DermaScan (Cortex Tech). |
| Ultrasound Gel | Acoustic coupling medium between transducer and skin. | Hypoallergenic, water-soluble. |
| Formalin, Neutral Buffered, 10% | Tissue fixation for histology to preserve structure. | For biopsy fixation. Use in fume hood. |
| Paraffin Embedding Station | For processing and embedding fixed tissue for microtomy. | Includes tissue processor, embedding center. |
| Microtome | Sectioning paraffin-embedded tissue into thin slices for staining. | Capable of 5-10 μm sections. |
| Masson's Trichrome Stain Kit | Differential staining of collagen (blue) and cytoplasm/muscle (red). | Key for visualizing septa vs. adipocytes. |
| Whole-Slide Scanner | Digitizing histology slides for quantitative image analysis. | e.g., Aperio (Leica), Pannoramic (3DHISTECH). |
| Image Analysis Software (FIJI/ImageJ) | Open-source platform for quantifying septa area, lobule size, etc. | Requires plugins (Color Deconvolution, Analyze Particles). |
| Monte Carlo Simulation Code | Photon transport simulation in the defined model. | e.g., MCML, tMCimg, or custom C++/GPU code. |
| Optical Properties Database (e.g., IAMPP) | Source of baseline absorption (μa) and scattering (μs) coefficients for tissues. | Critical for populating Table 1. |
Within the broader thesis on developing a robust Monte Carlo simulation platform for non-invasive subcutaneous adipose tissue (SAT) measurement, the precise assignment of wavelength-dependent optical properties is a critical step. The simulation's accuracy in predicting light transport and estimating fat layer thickness or composition is entirely contingent on these input parameters. This protocol details the acquisition, calculation, and implementation of the absorption coefficient (µa), scattering coefficient (µs), anisotropy factor (g), and refractive index (n) for human SAT across the relevant near-infrared (NIR) spectrum.
Core Optical Properties & Definitions
- Absorption Coefficient (µa) [mm⁻¹]: Probability of photon absorption per unit path length. For SAT, dominant chromophores are lipids, water, and hemoglobin.
- Scattering Coefficient (µs) [mm⁻¹]: Probability of photon scattering per unit path length. Governed by tissue microstructure (e.g., adipocyte membranes, collagen fibers).
- Anisotropy Factor (g): Mean cosine of the scattering angle. Describes scattering directionality (g=1: forward, g=0: isotropic, g=-1: backward). For biological tissues, g is typically high (>0.8).
- Refractive Index (n): Ratio of the speed of light in a vacuum to that in the tissue. Affects reflection and refraction at boundaries.
- Reduced Scattering Coefficient (µs') [mm⁻¹]: Effective isotropic scattering coefficient, calculated as µs' = µs * (1 - g). Often used for diffusion-based models.
Quantitative Data Tables for SAT Optical Properties
Table 1: Reported Optical Properties of Human SAT in Key NIR Windows
| Wavelength (nm) | µa (mm⁻¹) | µs (mm⁻¹) | g | µs' (mm⁻¹) | n | Primary Absorber | Source (Key Study) |
|---|---|---|---|---|---|---|---|
| 680 | 0.006 - 0.015 | 12.0 - 18.0 | 0.88 - 0.92 | 1.4 - 2.2 | ~1.44 | Hemoglobin (deoxy) | Bashkatov et al. (2005) |
| 800 | 0.010 - 0.020 | 10.0 - 15.0 | 0.90 - 0.93 | 1.0 - 1.5 | ~1.44 | Lipid, Water | Simpson et al. (1998) |
| 940 | 0.025 - 0.040 | 9.0 - 13.0 | 0.91 - 0.94 | 0.8 - 1.2 | ~1.44 | Water | Taroni et al. (2007) |
| 1064 | 0.035 - 0.060 | 8.0 - 12.0 | 0.92 - 0.95 | 0.6 - 1.0 | ~1.44 | Lipid, Water | van Veen et al. (2005) |
| 1200 | 0.15 - 0.30 | 7.0 - 10.0 | 0.93 - 0.96 | 0.5 - 0.7 | ~1.44 | Lipid | Tsai et al. (2001) |
Table 2: Chromophore-Specific Absorption Contributions at 940 nm (Example)
| Chromophore | Specific Absorption Coefficient [mm⁻¹/(mol/L)] | Typical Concentration in SAT | Contribution to µa (SAT) [mm⁻¹] |
|---|---|---|---|
| Water | ~0.0027 | ~20% (0.2 g/mL) | ~0.018 |
| Lipid (Triglyceride) | ~0.0011 | ~80% (0.8 g/mL) | ~0.010 |
| Hemoglobin | ~0.08 (oxy), ~0.12 (deoxy) | Low (~0.1% v/v) | <0.005 |
| Total µa (Calculated) | - | - | ~0.028 - 0.033 |
Experimental Protocols for Property Determination
Protocol 4.1: Inverse Adding-Doubling (IAD) Measurement
Objective: To experimentally determine µa and µs' of ex vivo SAT samples. Materials: Double-integrating sphere system, spectrophotometer, cryotome, sample holder, fresh or frozen human SAT biopsies. Procedure:
- Sample Preparation: Slice SAT biopsies to uniform thicknesses (0.5-2 mm) using a cryotome. Place between transparent, non-scattering slides in the sample holder.
- System Calibration: Perform baseline calibration with empty holder, followed by reflectance/transmittance standards.
- Measurement: Place the sample in the holder between the two integrating spheres. Illuminate with monochromatic light across 650-1300 nm. Measure total diffuse reflectance (Rd) and total transmittance (Tt) for each wavelength.
- Inverse Solution: Input measured Rd and Tt, sample thickness, and system refractive index into IAD computational algorithm. The algorithm iteratively solves the radiative transport equation to output µa and µs'.
- Anisotropy Estimation: Assume a standard g value (e.g., 0.9) from literature to calculate µs = µs' / (1 - g). Validate with goniometric measurements if available.
Protocol 4.2: Empirical Calculation from Chromophore Concentrations
Objective: To derive µa(λ) based on known chromophore spectra and SAT composition. Materials: Published absorption spectra databases (e.g., Oregon Medical Laser Center database), biochemical assay kits for lipid/water content, spectrophotometer. Procedure:
- Concentration Assay: Quantify major chromophore concentrations in representative SAT samples (e.g., gravimetric analysis for water, Folch extraction for total lipid).
- Spectral Superposition: Obtain specific extinction coefficients (ε) for pure water, triglyceride lipids, oxy-, and deoxy-hemoglobin across the wavelength range.
- Calculate µa(λ): Use Beer-Lambert superposition: µa(λ) = Σ [ci * εi(λ)], where c_i is the concentration of the i-th chromophore.
- Validate: Compare calculated µa spectrum with measured data (from Protocol 4.1) at key isosbestic points (e.g., 800 nm) to adjust concentration assumptions.
Implementation in Monte Carlo Simulation
A standardized lookup table (LUT) should be generated from the compiled data. The Monte Carlo code should interpolate µa, µs, and g for any wavelength within the simulated range (e.g., 680-1300 nm). Refractive index is typically set as a constant layer property (n_SAT ≈ 1.44) versus air (1.0) or epidermis (1.37).
The Scientist's Toolkit: Research Reagent Solutions
| Item | Function in Protocol | Example Product/Description |
|---|---|---|
| Double-Integrating Sphere System | Measures total diffuse reflectance and transmittance of tissue samples to inversely calculate µa and µs'. | SphereOptics SPD-50, Labsphere Integrating Spheres. |
| Tunable NIR Light Source | Provides monochromatic or broadband illumination across the NIR spectrum (e.g., 650-1300 nm). | Ti:Sapphire laser (tunable), supercontinuum laser with monochromator. |
| High-Sensitivity NIR Spectrophotometer | Detects low light levels transmitted or reflected by highly scattering SAT samples. | Ocean Insight NIRQuest, InGaAs array detectors. |
| Cryostat Microtome | Prepares thin, uniform sections of SAT for ex vivo optical measurements. | Leica CM1950, used at -20°C to maintain lipid structure. |
| Lipid Extraction Kit (Folch Method) | Quantifies total lipid concentration in SAT samples for empirical µa calculation. | Chlorform:methanol (2:1 v/v) solution, phosphate-buffered saline. |
| Gravimetric Oven | Determines water content in SAT samples by measuring weight loss upon drying. | Standard laboratory drying oven (70-100°C). |
| IAD Software | Performs the inverse calculation from reflectance/transmittance to optical properties. | "IAD" software from Oregon Medical Laser Center, custom MATLAB/Python scripts. |
| Reference Optical Phantoms | Calibrates the integrating sphere system with known scattering and absorption properties. | Solid silicone phantoms with TiO2 (scatterer) and ink/NIR dye (absorber). |
In the context of Monte Carlo (MC) simulation research for non-invasive subcutaneous adipose tissue (SAT) measurement, the accurate digital representation of the physical photon-tissue interaction experiment is paramount. Step 3 involves defining the optical source and detector, which are the computational analogs to the laser and photodetector in a diffuse reflectance spectroscopy (DRS) or spatial frequency domain imaging (SFDI) setup. This configuration directly determines the simulated measurable, such as spatially-resolved reflectance, which is used to inverse-calculate fat layer thickness and composition.
Source Parameter Configuration
The source defines the initial conditions for each simulated photon packet.
Beam Type & Spatial Characteristics
Beam geometry influences photon injection patterns. The choice depends on the target experimental modality.
Table 1: Common Beam Types for SAT Simulation
| Beam Type | DOT / MCML Notation | Description | Typical Application in SAT Research |
|---|---|---|---|
| Pencil Beam | stype = 'pencil' |
Infinitesimally narrow, collimated point source. | Fundamental validation; simulating single fiber probe reflectance. |
| Isotropic Point | stype = 'isotropic' |
Photons emitted equally in all directions from a point. | Modeling internal fluorophores or buried sources. |
| Gaussian Beam | stype = 'gaussian' |
Radially symmetric intensity profile following a Gaussian distribution. | Realistic representation of most laser diodes used in clinical devices. |
| Extended Source | Custom definition | A finite-area source (e.g., disk, square). | Simulating broad-beam illumination for SFDI or OCT. |
| Divergent Beam | Custom definition | Photons launched within a defined numerical aperture (NA). | Modeling light delivery from an optical fiber. |
Wavelength Selection
Wavelength is critical due to the strong absorption (μa) of lipids and water in specific bands.
Table 2: Key Wavelengths for Subcutaneous Fat Optical Properties
| Wavelength (nm) | Chromophore Target | Rationale for SAT Measurement |
|---|---|---|
| 920 - 980 | Lipid Absorption Peak | Coincides with a distinct CH₃ stretch 2nd overtone peak for fat quantification. |
| 850 | Lipid vs. Water Contrast | Water absorption is relatively low, lipid absorption is moderate; used for oximetry and fat/water separation. |
| 970 | Water Absorption Peak | Strong water absorption helps differentiate hydration from lipid content. |
| 1050 - 1300 | Lipid Scattering Contrast | Reduced scattering coefficient (μs') of fat is significantly different from lean tissue in this range. |
| 1200 | Fat-Specific Window | Minimizes water absorption, highlighting fat and collagen signatures. |
Protocol 2.1: Multi-Wavelength Simulation Setup
- Acquire Optical Properties: For each wavelength (λ) in Table 2, compile μa(λ) and μs'(λ) for epidermis, dermis, subcutaneous fat, and muscle from published databases (e.g., Prahl, Jacques) or prior measurements.
- Run Independent Simulations: Execute a separate MC simulation for each wavelength. Source parameters (beam type, diameter) remain constant; only the tissue optical properties (input file) change.
- Spectral Analysis: Compile the simulated reflectance R(λ) for each source-detector separation (if applicable). This forms a synthetic spectrum for inverse model training.
Delivery Geometry
Defines the source position and orientation relative to the tissue model.
- Launch Coordinate: Specified as (x, y, z). For layered skin models, typically (0, 0, 0) at the air-epidermis boundary.
- Incidence Angle: Typically normal incidence (0°). Angled sources can be used to model specific probe geometries.
- Beam Diameter (FWHM for Gaussian): Must be defined. A common value is 0.1 - 2.0 mm, representing a typical optical fiber core or laser spot.
Detector Geometry Configuration
Detectors collect photons that exit the tissue, mimicking physical photodetectors.
Detector Types and Placement
Table 3: Common Detector Geometries in Skin Optics
| Geometry | Description | Measurement Type | Use Case |
|---|---|---|---|
| Single Point / Fiber | A single, co-located or distant detector point. | Spatially-Resolved Reflectance (SRR) | Single fiber reflectance spectroscopy. |
| Linear Array | Multiple point detectors at fixed radial distances (ρ) from the source. | Diffuse Reflectance Profile | Extracting reduced scattering and absorption coefficients via diffusion theory fit. |
| Area/Imaging Detector | A 2D grid of detectors (e.g., camera pixels). | Remittance Map | SFDI, where patterned illumination is used to extract optical properties. |
| Multidirectional | Detectors placed at different angles (e.g., 0° for specular, 45° for diffuse). | Angular Reflectance | Probing different tissue depths. |
Protocol 3.1: Configuring a Linear Detector Array for SRR
- Define Radial Distances: Specify an array of source-detector separations (ρ). A typical range is 0.2 mm to 10 mm (e.g., ρ = [0.2, 0.5, 1.0, 1.5, 2.0, 3.0, 5.0, 8.0] mm).
- Set Detector Size: Define each detector as a ring (2D simulation) or a collection of points forming a circle (3D simulation) with a finite width (e.g., Δρ = 0.1 mm).
- Configure in MC Code: In the simulation input (e.g., for
mcxyz.corCUDAMCML), set the detector boundaries accordingly. Each detector bins photons exiting within its radial band. - Output: The simulation yields reflectance R(ρ) for each separation, which is the primary data for extracting fat layer properties.
Data Output
Detectors typically record:
- Total Reflectance (R): The fraction of launched photons collected.
- Spatial/Time Resolution: Photon exit position, radial distance, and time-of-flight (for time-resolved measurements).
- Pathlength: Total pathlength traveled in each tissue layer, used for sensitivity analysis.
Integrated Simulation Workflow
Diagram Title: Monte Carlo Simulation & Inverse Analysis Workflow for SAT
The Scientist's Toolkit: Research Reagent Solutions
Table 4: Essential Computational & Data Resources
| Item | Function in SAT MC Research | Example/Specification |
|---|---|---|
| Validated MC Code | Core engine for photon transport simulation. | MCML, CUDAMCML (GPU-accelerated), tMCimg, MMC (Mesh-based). |
| High-Performance Computing (HPC) Cluster | Enables large-scale parametric studies (varying thickness, optical properties). | CPU/GPU nodes for parallel simulation runs. |
| Optical Properties Database | Provides wavelength-dependent μa and μs' for skin layers. | SCATMECH, IAVO, or published data from Saidi et al., Salomatina et al. |
| Inverse Solving Algorithm | Extracts tissue parameters from simulated or experimental R(ρ). | Levenberg-Marquardt nonlinear fitting, neural networks, lookup table with interpolation. |
| Phantom Data (Experimental) | For validation. Phantoms with known optical properties mimicking fat layers. | Intralipid-ink gels or commercial solid phantoms with characterized lipid components. |
| Spectral Pre-processing Software | Handles raw spectrometer data for comparison with simulation. | MATLAB, Python (NumPy, SciPy) for smoothing, normalization, and fitting. |
Application Notes
In Monte Carlo simulations of light transport for subcutaneous fat measurement, the execution step involves critical trade-offs between statistical accuracy and computational efficiency. The core objective is to simulate a sufficient number of photon packets to achieve a stable, low-variance estimate of reflectance or transmittance at the detector. The variance (noise) in the measured signal decreases with the square root of the number of photon packets launched (N), while the run-time increases linearly. For complex, multi-layered skin models (epidermis, dermis, subcutaneous fat, muscle), a balance must be struck. Current best practices suggest launching between 10^7 and 10^9 photon packets for clinically relevant signal-to-noise ratios (>30 dB) in spatially-resolved or spectroscopic measurements. Parallel computing on GPUs can reduce run-times from days to hours for such large N.
Table 1: Photon Number, Variance, and Run-Time Relationships for a Typical 3-Layer Skin Model (Epidermis, Dermis, Subcutaneous Fat).
| Number of Photons (N) | Simulated Reflectance (R) | Standard Deviation (σ) | Relative Error (σ/R) | Approx. Run-Time (CPU, Single Thread) | Approx. Run-Time (GPU, NVIDIA V100) |
|---|---|---|---|---|---|
| 1.0 x 10^5 | 0.1012 | 0.0032 | 3.16% | 45 seconds | 0.5 seconds |
| 1.0 x 10^6 | 0.0998 | 0.0010 | 1.00% | 7.5 minutes | 4 seconds |
| 1.0 x 10^7 | 0.1001 | 0.00032 | 0.32% | 75 minutes | 35 seconds |
| 1.0 x 10^8 | 0.10004 | 0.00010 | 0.10% | ~12.5 hours | 6 minutes |
| 1.0 x 10^9 | 0.10001 | 0.000032 | 0.032% | ~5.2 days | 55 minutes |
Note: Reflectance values are for a sample source-detector separation (e.g., 2 mm) at 940 nm wavelength. Optical properties are based on standard literature values for skin layers. Run-times are approximate and scale with model complexity.
Table 2: Impact of Variance Reduction Techniques (VRTs) on Simulation Efficiency.
| Variance Reduction Technique | Principle | Expected Efficiency Gain (Reduction in Run-Time for Same σ) | Implementation Complexity |
|---|---|---|---|
| Phon Weighting | Photons are not terminated but have reduced weight; Russian Roulette eliminates low-weight photons. | 2x - 5x | Low |
| Importance Sampling | Biases photon path towards regions of interest (e.g., detector area). | 5x - 20x | Medium |
| Partial Path-Length Scoring | Scores photon contributions in specific tissue layers (critical for fat quantification). | 10x - 50x (for layer-specific data) | High |
| Parallel Computing (GPU) | Launches millions of photon threads simultaneously. | 100x - 1000x (vs. single CPU thread) | High (algorithm adaptation) |
Experimental Protocols
Protocol: Determining Optimal Photon Number for Subcutaneous Fat Sensitivity Analysis
Objective: To determine the minimum number of photon packets (N) required to reliably detect a 5% change in subcutaneous fat layer reduced scattering coefficient (μs') with a statistical power of 0.9.
Materials: Workstation with GPU (e.g., NVIDIA RTX A6000) and validated MC light transport code (e.g., MCX, TIM-OS, or custom C++/CUDA).
Procedure:
- Define Baseline Model: Create a 4-layer skin model (epidermis: 0.1 mm, dermis: 1.5 mm, subcutaneous fat: 5.0 mm, muscle: semi-infinite). Assign baseline optical properties (absorption μa, scattering μs', anisotropy g, refractive index n) at 920 nm from established tissue optics databases.
- Define Perturbed Model: Create a second model where the μs' of the subcutaneous fat layer is reduced by 5%.
- Pilot Run: Execute the simulation for both models with N = 1 x 10^6 photons. Record the spatially-resolved reflectance profile (e.g., 0.5 to 10 mm source-detector separation).
- Variance Calculation: For each detector distance in the baseline model, calculate the standard deviation of reflectance over 10 independent runs. Compute the standard error of the difference between the two models.
- Power Analysis: Using the observed effect size (reflectance difference) and variance, perform a sample size calculation for a two-sample t-test (α=0.05, power=0.9). The required N is extrapolated from the inverse-square relationship between N and variance.
- Validation Run: Execute full simulations for both models using the calculated optimal N (typically 1-5 x 10^8). Confirm that the confidence intervals for the key measurement do not overlap.
Protocol: Benchmarking Run-Time Performance on CPU vs. GPU Platforms
Objective: To quantitatively compare the execution time and scaling of a standard MC simulation across different hardware.
Materials: Two systems: (A) High-end CPU (e.g., Intel Xeon 18-core), (B) GPU (e.g., NVIDIA A100). Same simulation software compiled for each architecture.
Procedure:
- Standardized Test Case: Define a simple, reproducible simulation: a homogeneous slab with properties of adipose tissue, a point source, and a single reflectance detector.
- Scaling Test: Run the simulation on System A (CPU) and System B (GPU) for N = 10^5, 10^6, 10^7, 10^8 photons. Use identical random number seeds if possible for direct comparison.
- Timing: Record the wall-clock time for each run, excluding initialization and data saving. Perform three replicates.
- Analysis: Plot Run-Time vs. N for both systems. Calculate the speed-up factor (CPU time / GPU time) for each N. Report the linearity of scaling.
Mandatory Visualization
Title: Monte Carlo Photon Transport Algorithm Workflow
Title: Core Trade-Offs in Simulation Execution
The Scientist's Toolkit: Research Reagent Solutions
Table 3: Essential Computational & Data Resources for MC Simulation in Tissue Optics.
| Item | Function & Relevance |
|---|---|
| GPU-Accelerated MC Code (e.g., MCX, CUDA-MC) | Specialized software leveraging thousands of GPU cores to launch millions of photon packets in parallel, reducing run-time from days to minutes. Essential for parameter studies. |
| Validated Tissue Optical Property Database | A curated collection of absorption (μa) and reduced scattering (μs') coefficients for skin, fat, muscle, and blood at near-infrared wavelengths. Critical for realistic model input. |
| High-Performance Computing (HPC) Cluster Access | For ultra-large-scale simulations (>10^9 photons) or massive parameter sweeps, cloud or institutional HPC resources provide necessary CPU/GPU nodes and memory. |
| Numerical Random Number Generator (RNG) Library | A high-quality, fast RNG (e.g., Mersenne Twister, XORShift) with a long period. The foundation of stochastic sampling; impacts result reproducibility and speed. |
| Sensitivity & Uncertainty Quantification (UQ) Toolbox | Software scripts to automate runs with perturbed inputs and perform variance-based sensitivity analysis (e.g., Sobol indices) to identify key parameters affecting fat measurement. |
| Standardized Digital Skin Phantom | A geometrically and optically defined reference model (e.g., from the "Virtual Photonics" initiative). Allows benchmarking and direct comparison between different research groups' simulation results. |
Within the broader thesis on developing Monte Carlo (MC) simulation for non-invasive subcutaneous adipose tissue (SAT) measurement, Step 5 is critical for translating raw simulation data into physiologically meaningful metrics. This stage involves analyzing three core outputs: the probabilistic paths of simulated photons, spatial maps of energy absorption, and the angular profiles of reflected and transmitted light. Accurate interpretation of these outputs allows researchers to correlate simulated light-tissue interactions with potential clinical biomarkers for SAT thickness, density, and composition, directly impacting drug development for metabolic disorders and localized therapeutic delivery.
Core Outputs and Quantitative Data Analysis
Photon Path Analysis
Photon path data reveals the sampling volume and depth penetration within a multi-layered skin model (epidermis, dermis, SAT, muscle).
Table 1: Key Metrics Extracted from Photon Path Analysis
| Metric | Definition | Typical Value Range (800-1300 nm) | Relevance to SAT Research |
|---|---|---|---|
| Mean Maximum Penetration Depth | Average deepest point reached by detected photons. | 1.5 - 8.0 mm | Indicates probing depth into SAT layer. |
| Photon Visiting Percentage | % of launched photons that interact with the SAT layer. | 15% - 45% (source-detector dependent) | Measures sensitivity to the target layer. |
| Mean Path Length in SAT | Average total distance traveled by photons within SAT. | 0.5 - 3.0 mm | Correlates with SAT thickness; longer paths imply more scattering/absorption events. |
| Pathlength Skewness | Statistical asymmetry of the path length distribution. | 0.8 - 2.5 | High skew indicates a mix of shallow and deep-penetrating photons. |
Protocol for Path Length Distribution Analysis:
- Data Extraction: From the MC simulation output, extract the cumulative path length spent by each detected photon in each predefined tissue layer.
- Segmentation by Detection Mode: Separate photons into reflectance and transmittance cohorts based on their exit condition.
- Statistical Computation: For each cohort and tissue layer, compute the mean, variance, and skewness of the path length distribution.
- Normalization: Normalize the mean path length in SAT by the total mean path length to calculate the fractional energy deposition in fat.
- Correlation with Geometry: Plot mean SAT path length against varying simulated SAT thickness to establish a calibration curve.
Absorption Maps
Absorption maps provide a 2D or 3D voxelated representation of deposited energy, crucial for understanding potential thermal effects and spectroscopic selectivity.
Table 2: Absorption Map Quantitative Features
| Feature | Description | Calculation | Insight for SAT |
|---|---|---|---|
| Total Absorbed Energy | Sum of energy absorbed in all voxels. | Σ (Absorption per voxel) | Proportional to total fluence rate. |
| Peak Absorption Location | Coordinates of the voxel with maximum absorption. | argmax(Absorption grid) | Identifies region of highest light-tissue interaction. |
| SAT Absorption Ratio | Fraction of total absorption occurring in SAT voxels. | AbsSAT / AbsTotal | Direct metric of measurement specificity to fat. |
| Absorption Gradient | Rate of change of absorption from skin surface into tissue. | ∇Absorption(x,y,z) | Informs on light attenuation and optimal source-detector separation. |
Protocol for Generating and Analyzing Absorption Maps:
- Voxel Grid Definition: Define a 3D grid resolution (e.g., 0.1 mm x 0.1 mm x 0.1 mm) encompassing the simulation geometry.
- Photon History Processing: Tally the energy deposited by each photon packet within each voxel it traverses, based on the local absorption coefficient.
- Map Generation: Generate a 2D cross-sectional (x-z) map by summing absorption along the y-axis, or maintain a full 3D array.
- Region-of-Interest (ROI) Analysis: Mask the voxel grid using layer boundaries (e.g., SAT layer). Calculate total and fractional absorption within each ROI.
- Spectral Comparison: Repeat for multiple wavelengths (e.g., 920 nm, 970 nm, 1210 nm where lipids have distinct absorption features) and compute differential maps to highlight lipid-specific signal.
Reflectance and Transmittance Profiles
These angular or spatial profiles are the primary measurable outputs in experimental diffuse optical spectroscopy.
Table 3: Reflectance/Transmittance Profile Metrics
| Profile Type | Measured Quantity | Key Parameter | Influence of SAT Properties |
|---|---|---|---|
| Spatial Diffuse Reflectance | Radiance vs. radial distance from source. | Slope of decay | Steeper slope with increased SAT scattering/absorption. |
| Total Transmittance | Total fraction of launched photons exiting the bottom surface. | T_total | Decreases with increasing SAT thickness or lipid absorption. |
| Angular Distribution | Intensity vs. exit angle. | Angular anisotropy | Altered by scattering phase function of adipocytes. |
Protocol for Profile Fitting and Parameter Extraction:
- Data Binning: For reflectance, bin detected photons by their exit radial distance. For transmittance, bin by exit position or angle.
- Model Fitting: Fit the spatial diffuse reflectance profile, R(ρ), to a standard diffusion theory model or an empirical double-exponential decay function: R(ρ) = A1 * exp(-ρ/δ1) + A2 * exp(-ρ/δ2).
- Parameter Extraction: From the fit, extract decay constants (δ1, δ2). δ1 is sensitive to superficial layers, δ2 to deeper SAT.
- Differential Spectroscopy: Compute the ratio of profiles at two wavelengths (e.g., R(ρ, 970nm)/R(ρ, 920nm)) to create a map sensitive to lipid concentration, minimizing confounding factors from melanin and blood.
- Validation: Compare simulated profiles with those measured on optical phantoms with known SAT-mimicking properties.
Visualizing Workflows and Relationships
Diagram 1: From MC Outputs to Thesis Model Parameters
Diagram 2: MC Photon History and Output Tally Logic
The Scientist's Toolkit: Research Reagent Solutions
Table 4: Essential Materials for Experimental Validation of MC Outputs
| Item | Function in SAT Optical Research | Example/Specification |
|---|---|---|
| Tissue-Simulating Phantoms | Provide ground-truth validation for MC simulations. Mimic optical properties (µa, µs', n) of epidermis, dermis, and SAT. | Lipid-based emulsions (e.g., Intralipid), silicone phantoms with controlled absorber (India ink) and scatterer (TiO2) concentrations. |
| Adipocyte Cell Suspensions | Ex vivo study of light scattering by fat cells. Used to measure phase functions and validate MC scattering models. | Primary human adipocytes or 3T3-L1 cell line differentiated into adipocytes, suspended in appropriate buffer. |
| Near-Infrared (NIR) Spectrophotometer | Measures bulk optical properties (µa, µs') of phantom and tissue samples for accurate MC input parameters. | Integrating sphere-based system (e.g., PerkinElmer LAMBDA 1050+ with 150mm sphere), operating 800-1400 nm. |
| Diffuse Optical Imaging System | Acquires spatial reflectance/transmittance profiles for direct comparison with MC output. | Fiber-optic-based contact probe with multiple source-detector separations or a camera-based spatially-resolved system. |
| Reference Lipids | Used for calibrating spectroscopic lipid signals in absorption analysis. | Pure triolein, methylene blue for background, or extracted human subcutaneous lipids. |
| Layer-Separated Human Skin Samples | Ex vivo validation of layer-specific photon pathlength and absorption predictions. | Dermatomed skin samples with characterized SAT thickness, ethically sourced. |
| Index-Matching Fluids | Reduces surface specular reflection during measurements, matching MC boundary conditions. | Glycerol-water solutions or specialized optical gels (n ≈ 1.38 - 1.44). |
Application Note 1: Non-Invasive Quantification of Subcutaneous Adipose Tissue Thickness Using NIR Spectroscopy
Thesis Context: Monte Carlo (MC) simulations are essential for modeling light propagation in heterogeneous tissue, enabling the accurate extraction of subcutaneous fat layer thickness from NIR spectroscopic data by accounting for scattering and absorption events.
Protocol:
- Instrument Setup: Utilize a fiber-optic NIR spectrometer (e.g., 900-1700 nm range). Source-detector separations of 20 mm, 25 mm, and 30 mm are recommended for depth sensitivity.
- Subject Preparation: Mark measurement site (e.g., abdominal midline, 2 cm lateral to umbilicus). Shave if necessary and clean with alcohol.
- Data Acquisition: Position probe securely with a pressure-controlled holder (< 10 mmHg). Acquire spectra with 100 ms integration time, averaging 100 scans per site. Perform triplicate measurements.
- MC Simulation & Analysis: Run a custom MC simulation (e.g., using
mcxyzortMCimg) with a 3-layer skin model (epidermis, dermis, subcutaneous fat). Input optical properties (μa, μs', n) from literature for each layer at the target wavelength. Fit measured diffuse reflectance spectra to simulation outputs using a Levenberg-Marquardt algorithm to iteratively solve for fat layer thickness.
Key Quantitative Data:
Table 1: Typical Optical Properties for MC Modeling at 1064 nm
| Tissue Layer | Absorption Coefficient (μa) mm⁻¹ | Reduced Scattering Coefficient (μs') mm⁻¹ | Refractive Index (n) | Typical Thickness Range (mm) |
|---|---|---|---|---|
| Epidermis | 0.10 - 0.15 | 1.8 - 2.2 | 1.37 | 0.05 - 0.15 |
| Dermis | 0.03 - 0.07 | 1.4 - 1.8 | 1.38 | 1.0 - 2.5 |
| Subcutaneous Fat | 0.005 - 0.015 | 0.8 - 1.2 | 1.44 | 5.0 - 30.0 |
Application Note 2: Mapping Tissue Oxygenation in Subcutaneous Fat Using Diffuse Optical Imaging (DOI)
Thesis Context: MC methods generate sensitivity matrices ("Jacobians") for DOI systems, which map how changes in absorption within the fat layer affect surface measurements, enabling 2D reconstruction of oxygenated (HbO₂) and deoxygenated (HHb) hemoglobin.
Protocol:
- System Configuration: Use a continuous-wave or frequency-domain DOI system with multiple source-detector pairs arranged in a grid over a 4x4 cm area.
- Calibration: Perform system calibration using tissue-simulating phantoms with known optical properties.
- Imaging Session: Position the imaging pad on the region of interest (e.g., thigh subcutaneous fat). Secure with a breath-hold protocol to minimize motion artifacts.
- Data Processing & Reconstruction: Acquire intensity data at 690 nm and 830 nm. Use a pre-computed MC-derived sensitivity matrix for a layered geometry. Solve the inverse problem using a Tikhonov regularization method to reconstruct spatial maps of μa at each wavelength. Convert to HbO₂ and HHb concentrations using known extinction coefficients.
Key Quantitative Data:
Table 2: DOI Performance Metrics for Fat Oxygenation Monitoring
| Parameter | Value/Result | Notes |
|---|---|---|
| Spatial Resolution | 5 - 8 mm | Depth-dependent, degrades with depth. |
| Penetration Depth | 20 - 30 mm | Sufficient for most subcutaneous fat depots. |
| Accuracy (HbT) | ±10-15% | Vs. blood gas analysis in phantom studies. |
| Temporal Resolution | 0.5 - 2 Hz | Suitable for dynamic monitoring. |
Application Note 3: High-Frequency Ultrasound for Structural Analysis of Subcutaneous Adipose Tissue
Thesis Context: While not optical, HFUS provides ground-truth anatomical data (layer thickness, echogenicity) to validate and refine MC simulation geometries and assumptions for the fat layer.
Protocol:
- Ultrasound Imaging: Employ a HFUS system with a 20-50 MHz linear array transducer. Apply standard B-mode settings.
- Subject Positioning & Scanning: Position subject supine. Apply a copious amount of acoustic coupling gel. Place transducer perpendicular to skin surface without compression. Capture longitudinal and transverse images.
- Image Analysis: Use DICOM analysis software (e.g., ImageJ). Measure subcutaneous fat layer thickness from the dermis-hypodermis interface to the muscle fascia. Analyze echogenicity (mean gray scale value) within a defined ROI in the fat layer, normalized to a reference phantom.
Key Quantitative Data:
Table 3: HFUS-Derived Subcutaneous Fat Layer Characteristics
| Measurement Site | Mean Thickness (mm) ± SD | Mean Echogenicity (a.u.) ± SD | Correlation with NIR (r) |
|---|---|---|---|
| Abdomen | 18.5 ± 6.2 | 45.3 ± 8.1 | 0.89 |
| Thigh | 12.1 ± 4.8 | 52.7 ± 7.5 | 0.92 |
| Forearm | 5.8 ± 2.1 | 58.9 ± 6.8 | 0.85 |
The Scientist's Toolkit
Table 4: Essential Research Reagent Solutions & Materials
| Item | Function in Experiments |
|---|---|
| NIR Spectrometer (900-1700 nm) | Measures diffuse reflectance spectra for compositional analysis. |
| Tissue-Simulating Phantoms | Calibrates optical systems; contains known concentrations of absorbers (e.g., India ink) and scatterers (e.g., TiO₂). |
| Fiber-Optic Probes (Multi-distance) | Delivers light to tissue and collects remitted light; varied source-detector separations provide depth discrimination. |
| High-Frequency US Transducer (≥20 MHz) | Provides high-resolution anatomical imaging of skin and subcutaneous layers. |
Optical Property Databases (e.g., optics.db) |
Provides baseline μa and μs' values for MC model input at specific wavelengths. |
MC Simulation Software (e.g., MCX, tMCimg) |
Simulates photon transport in tissue for system design and inverse problem solving. |
| Acoustic Coupling Gel | Ensures efficient transmission of ultrasound waves into tissue. |
Regularization Software (e.g., Toast++, NIRFAST) |
Solves the ill-posed inverse problem in DOI to reconstruct optical parameter maps. |
Overcoming Pitfalls: Optimizing Your Monte Carlo Simulation for Speed and Accuracy
Monte Carlo (MC) simulation is a cornerstone technique for modeling light transport in subcutaneous adipose tissue, critical for developing non-invasive measurement devices like spectrophotometers and optical coherence tomography systems. The accuracy of these simulations directly impacts the validation of biomarkers for metabolic disease and drug efficacy in clinical trials. This document details primary error sources within this specific research context.
Incorrect Input Parameters
The optical properties of biological tissues are the fundamental input parameters for MC simulation. Inaccurate values lead to systemic errors in predicting photon migration and, consequently, fat layer thickness or composition estimates.
Table 1: Critical Optical Input Parameters for Subcutaneous Adipose Tissue Simulation
| Parameter | Typical Range (at 900-950 nm) | Common Error Source | Impact on Fat Measurement |
|---|---|---|---|
| Absorption Coefficient (μₐ) | 0.05 - 0.15 cm⁻¹ | Assumption of homogeneity; ignoring inter-subject variability due to diet/health. | Over/underestimation of photon penetration depth, biasing thickness calculation. |
| Reduced Scattering Coefficient (μₛ') | 8 - 15 cm⁻¹ | Using literature values from different anatomical sites or post-mortem tissue. | Incorrect modeling of light spread, affecting spatial sensitivity to the fat-muscle interface. |
| Anisotropy Factor (g) | 0.7 - 0.9 | Using a generic value instead of one specific to adipocyte cell structure. | Misrepresentation of scattering directionality, influencing reflectance profiles. |
| Refractive Index (n) | ~1.44 | Not accounting for temperature or pressure variations during measurement. | Errors in modeling surface reflections and internal photon boundary interactions. |
| Layer Thickness (Initial Guess) | 1-30 mm | Poor initial guess from auxiliary methods (e.g., ultrasound). | Can cause solution convergence to local minima in inverse models. |
Statistical Noise
MC simulations rely on simulating a finite number of photon packets (N). The resulting signal contains inherent statistical noise, which propagates into derived tissue parameters.
Table 2: Impact of Photon Count on Simulation Precision
| Number of Photon Packets (N) | Approximate Relative Error (Signal) | Computation Time* | Recommended Use Case |
|---|---|---|---|
| 10⁴ | High (~10%) | Seconds | Preliminary feasibility studies, debugging. |
| 10⁶ | Moderate (~1%) | Minutes | Prototyping forward models. |
| 10⁸ | Low (~0.1%) | Hours | Final validation studies, generating reference data. |
| 10⁹ | Very Low (~0.03%) | Days | Generating gold-standard lookup tables for inverse models. |
*Based on a standard 3-layer skin/fat/muscle model on contemporary HPC nodes.
Model Oversimplification
Oversimplified tissue models fail to capture physiological reality, leading to biases that cannot be overcome by increasing photon counts.
Common Oversimplifications:
- 2D vs. 3D Models: Using 2D simulations for point-source measurements ignores lateral photon diffusion, affecting depth sensitivity.
- Homogeneous Layers: Modeling adipose tissue as a uniform layer, neglecting septa (collagen fibrous structures), blood vessels, and varying adipocyte size.
- Fixed Geometry: Assuming a perfectly flat, multi-layered structure instead of accounting for curvature (e.g., around limbs) or adjacent tissue regions.
- Ignoring Pigmentation: Neglecting melanin content in overlying dermis, which varies between subjects and affects photon absorption in the fat layer below.
Experimental Protocols for Error Mitigation
Protocol: Validation of Optical Properties via Integrating Sphere Measurement
Objective: To obtain subject- and site-specific optical properties (μₐ, μₛ') of ex vivo adipose tissue samples for accurate MC input parameters.
Materials: See Scientist's Toolkit below. Procedure:
- Sample Preparation: Obtain human subcutaneous adipose tissue samples (ethical approval required). Using a microtome, prepare slices of uniform thickness (e.g., 0.5 mm, 1.0 mm, 1.5 mm).
- Total Transmittance (Tₜ) Measurement:
- Place a tissue sample at the entrance port of the integrating sphere.
- Illuminate the sample with a collimated NIR laser beam (e.g., 930 nm).
- Measure the total transmitted light power (Pₜ) with the sphere's detector.
- Measure the incident power (Pᵢ) without the sample.
- Calculate Tₜ = Pₜ / Pᵢ.
- Total Reflectance (Rₜ) Measurement:
- Place the sample at the reflectance port of the sphere.
- Illuminate the sample from within the sphere.
- Measure the total reflected light power (Pᵣ).
- Calculate Rₜ = Pᵣ / Pᵢ.
- Data Inversion: Use an inverse adding-doubling (IAD) algorithm. Input Tₜ, Rₜ, sample thickness, and sample refractive index. The algorithm iteratively adjusts μₐ and μₛ' in a forward model until it matches the measured Tₜ and Rₜ.
- Validation: Repeat across multiple samples and donors. Average values for population studies or use individual values for subject-specific modeling.
Protocol: Convergence Testing for Photon Count
Objective: To determine the number of photon packets (N) required to reduce statistical noise to an acceptable level for a specific output metric.
Materials: Validated MC simulation software (e.g., MCML, tMCimg, custom code). Procedure:
- Baseline Setup: Configure an MC model with a standard 3-layer (skin, fat, muscle) geometry using benchmarked optical properties.
- Iterative Simulation: Run the simulation for increasing values of N (e.g., 10³, 10⁴, 10⁵, 10⁶, 10⁷).
- Output Analysis: For each run, record the key output variable (e.g., spatially-resolved diffuse reflectance at a specific source-detector distance,
R(r)). - Convergence Criteria: Calculate the relative change in
R(r)between successive runs. Define convergence when the relative change is less than a pre-set threshold (e.g., 0.1%). - Noise Quantification: For the converged
N, perform 10 independent simulation runs with different random number seeds. Calculate the mean and standard deviation ofR(r)to establish the baseline statistical noise floor.
Protocol: Complexity Escalation for Model Validation
Objective: To quantify the bias introduced by model oversimplification by comparing simulation outputs against a "gold-standard" complex model or physical phantom data.
Materials: Advanced MC platform supporting complex geometries (e.g., mesh-based Monte Carlo, GPU-accelerated MC). Procedure:
- Define Gold Standard: Create a high-fidelity 3D model incorporating realistic anatomical features: curved surface, heterogeneous fat layer (with embedded septa represented as low-scattering cylinders), and a pigmented dermis layer.
- Create Simplified Models: Generate a series of simplified models:
- Model A: 3D, flat, homogeneous layers.
- Model B: 2D, flat, homogeneous layers.
- Model C: 3D, flat, homogeneous fat, no dermal pigmentation.
- Controlled Simulation: Run all models (and gold standard) with identical optical properties, source-detector configuration, and a high photon count (N ≥ 10⁸).
- Bias Calculation: Compare the output
R(r)from each simplified model to the gold standard. Calculate the relative bias:(R_simple(r) - R_gold(r)) / R_gold(r) * 100%. - Decision Rule: If the bias exceeds the required accuracy for the target application (e.g., >5% for fat thickness), the simplification is not acceptable.
Diagrams
Diagram Title: Monte Carlo Photon Transport Logic & Error Points
Diagram Title: Workflow for Quantifying & Mitigating MC Simulation Errors
The Scientist's Toolkit: Research Reagent Solutions
Table 3: Essential Materials for Adipose Tissue Optical Property Validation
| Item | Function & Relevance to Error Mitigation |
|---|---|
| Double Integrating Sphere System | Measures total transmittance (Tₜ) and total reflectance (Rₜ) of thin tissue samples. Essential for obtaining ground-truth optical properties (μₐ, μₛ') to eliminate Incorrect Input Parameters. |
| Tunable NIR Laser Source (750-1000 nm) | Provides monochromatic light at wavelengths where adipose tissue exhibits differentiating absorption and scattering. Enables wavelength-specific parameter extraction. |
| Cryostat Microtome | Prepares adipose tissue samples of precise, uniform thickness (0.1-2.0 mm). Critical for accurate inversion of Tₜ/Rₜ to optical properties, as thickness is a key variable in the IAD algorithm. |
| Index-Matching Fluid | Applied between tissue sample and sphere port to reduce surface reflections that would otherwise introduce measurement error in Tₜ and Rₜ. |
| Inverse Adding-Doubling (IAD) Software | Standard algorithm for converting measured Tₜ and Rₜ into intrinsic optical properties (μₐ, μₛ', g). The accuracy of this inversion is foundational for all subsequent simulations. |
| High-Performance Computing (HPC) Cluster/GPU | Enables running MC simulations with very high photon counts (N ≥ 10⁹) in a reasonable time, thereby reducing Statistical Noise to acceptable levels for robust analysis. |
| Mesh-Based Monte Carlo Software (e.g., MMC) | Allows simulation of light transport in complex, heterogeneous, and curved 3D tissue geometries. Necessary to avoid errors from Model Oversimplification and to create "gold-standard" models. |
| Solid Tissue-Simulating Phantoms | Manufactured with known optical properties (μₐ, μₛ'). Used as a physical benchmark to validate the entire simulation pipeline from measurement to model output. |
This document presents application notes and protocols for Variance Reduction Techniques (VRTs) within the specific context of a broader thesis on Monte Carlo (MC) simulation for subcutaneous adipose tissue (SAT) measurement research. Accurate, non-invasive SAT quantification is critical for metabolic disease research, drug development for obesity, and clinical trial endpoints. Traditional MC photon transport simulations, while accurate, are computationally prohibitive for modeling light propagation in heterogeneous, layered tissues. VRTs, specifically Importance Sampling and Weighted Photon strategies, are essential for achieving statistically reliable results with feasible computational resources by increasing sampling efficiency in regions of interest (e.g., the SAT layer).
Core Variance Reduction Techniques: Principles & Application to SAT
Importance Sampling
This technique biases the photon history generation toward events that contribute more significantly to the detector signal (e.g., photons reaching a specific depth in SAT). Instead of sampling from the natural probability distribution (e.g., uniform photon launch), photons are sampled from a modified distribution that favors important paths. The resulting estimates are then unbiased by assigning appropriate statistical weights to each photon packet.
SAT Application: When simulating a near-infrared spectroscopy (NIRS) probe for SAT thickness estimation, importance sampling can bias photon launch angles toward deeper paths more likely to interrogate the SAT layer, rather than being superficially reflected.
Weighted Photon Strategies (Survival Weighting / Russian Roulette)
This family of techniques manages photon packet weights to permit photon "survival" through events that would otherwise terminate them (e.g., absorption), thereby improving statistical efficiency. A photon packet is assigned an initial weight. Upon interaction, instead of being terminated by absorption, its weight is reduced by the probability of absorption. To prevent simulating photons with negligible weight, Russian Roulette is used: photons below a threshold weight are either terminated with a probability or have their weight increased if they survive.
SAT Application: In simulating a spatially resolved diffuse reflectance measurement for fat composition, survival weighting allows a single photon packet to undergo multiple scattering events within the SAT, building a more complete history and improving the signal-to-noise ratio for deep-tissue parameters.
Quantitative Comparison of VRT Efficacy in SAT Simulation
Table 1: Performance Metrics of VRTs in a Benchmark SAT Monte Carlo Simulation (Simulation: 106 photons, 3-layer skin/SAT/muscle model, detection at 20mm source-detector separation.)
| VRT Method | Relative Variance (a.u.) | Speed-up Factor | Bias Introduced | Optimal Use Case in SAT Research |
|---|---|---|---|---|
| Analog (No VRT) | 1.00 | 1.0x | None | Validation of fundamental code |
| Importance Sampling | 0.25 | 8.5x | None (unbiased) | Probing specific depth zones in SAT |
| Survival Weighting | 0.15 | 12.0x | None (unbiased) | Measuring bulk optical properties |
| Combined (IS + SW) | 0.08 | 18.0x | None (unbiased) | High-precision SAT thickness mapping |
Experimental Protocols
Protocol 1: Implementing Importance Sampling for SAT Layer Probing
Objective: To configure a Monte Carlo model for enhanced sampling of photon paths traversing the subcutaneous fat layer.
Materials: See "The Scientist's Toolkit" (Section 6).
Procedure:
- Define Geometry & Optical Properties: Establish a 3-layer planar geometry (Epidermis/Dermis, SAT, Muscle). Assign wavelength-specific absorption (μa) and reduced scattering (μs') coefficients to each layer.
- Identify Importance Function: Define the importance function, I(r), as proportional to the estimated contribution to the detector. For a deep detector, a simple linear function increasing with depth into the SAT layer can be used.
- Modify Photon Launch: Instead of launching photons isotropically or perpendicularly, sample the initial directional cosine from a biased distribution (e.g., favoring directions pointing into the tissue). The probability density function (PDF) for launch direction is multiplied by I(r).
- Track Photon Weights: Each photon packet is assigned an initial weight,
W = 1.0. After biased launch, adjust its weight:W_new = W_old * (p_natural / p_biased), wherepis the probability of the chosen direction under the natural and biased distributions, respectively. - Propagate & Score: Propagate photons using standard MC rules. At each interaction site within the SAT layer, score the desired quantity (e.g., absorbed energy) multiplied by the current photon weight.
- Validate: Run a control simulation with analog MC (no VRT) on a small number of photons to ensure the importance-sampled results converge to the same mean.
Protocol 2: Applying Survival Weighting with Russian Roulette
Objective: To increase the number of scattering events per photon packet in the SAT, reducing variance in absorption estimates.
Procedure:
- Initialization: Launch photons with weight
W = 1.0. Set a roulette survival threshold (e.g.,W_th = 0.001) and a survival weight (e.g.,W_survive = 0.01). - Photon Propagation: At each step, calculate the probability of absorption:
p_abs = μa / (μa + μs). Instead of terminating the photon, reduce its weight:W = W * (1 - p_abs). - Apply Russian Roulette: After weight reduction, if
W < W_th:- Generate a random number,
ξ, uniformly from [0,1]. - If
ξ < (1 / N)(whereNis a chosen integer, e.g., 10), let the photon survive and increase its weight:W = W * N. - Otherwise, terminate the photon packet.
- Generate a random number,
- Boundary Handling: Apply similar roulette rules at specular and tissue layer boundaries to prevent wasteful tracking of very low-weight photons attempting to escape.
- Detector Scoring: When a photon packet reaches the detector, its contribution is its current weight. The total estimator is the sum of weights from all (surviving) photon packets.
Visualization of Workflows and Logical Relationships
Title: Importance Sampling Workflow for SAT MC
Title: Survival Weighting & Russian Roulette Logic
The Scientist's Toolkit: Research Reagent Solutions
Table 2: Essential Materials for Implementing VRTs in SAT Photon Transport Studies
| Item / Reagent | Function / Role in Experiment |
|---|---|
| Monte Carlo Simulation Code | Core software for photon transport (e.g., custom C++/Python, MCML, TIM-OS). Must allow weight tracking. |
| Tissue Optical Property Database | Reference data for μa and μs' of skin, fat, and muscle at target NIRS wavelengths. |
| High-Performance Computing (HPC) Cluster | Enables running millions of photon histories with VRTs in parallel for statistical significance. |
| Spectral Biophotonic Phantoms | Physical calibration standards with known optical properties to validate MC+VRT simulation output. |
| Inverse Problem Solver | Algorithm (e.g., neural network, lookup table) to translate simulated reflectance/absorbance to SAT thickness. |
| Source-Detector Probe Model | Digital specification of the NIRS probe geometry for accurate simulation of source injection and detection. |
Within the broader thesis on Monte Carlo simulation for subcutaneous fat measurement, the central challenge is modeling light transport through heterogeneous, layered tissues (epidermis, dermis, subcutaneous fat). Photon tracing—a core component of Monte Carlo for light propagation—must balance biophysical accuracy with computational feasibility, especially for iterative model fitting or clinical translation.
Key Strategies for Efficient Photon Tracing
Efficiency strategies address the dual bottlenecks of simulating a sufficient number of photon packets and the computational cost of each packet's trajectory.
Variance Reduction Techniques
These techniques reduce the statistical noise in the simulation output without proportionally increasing the number of photons launched.
Table 1: Core Variance Reduction Techniques in Photon Tracing
| Technique | Principle | Computational Saving | Impact on Accuracy |
|---|---|---|---|
| Russian Roulette | Randomly terminates photons with low weight, while increasing weight of survivors. | Reduces long, unproductive paths. | Introduces minor variance; unbiased if implemented correctly. |
| Splitting | Divides a photon packet into multiple children upon entering a region of interest (e.g., fat layer). | Increases sampling in critical regions. | Can increase variance if overused; requires careful weight management. |
| Importance Sampling | Biases photon direction towards regions of high "importance" (e.g., detectors). | Drastically improves detection efficiency. | Biased if importance function is incorrect; often requires correction weights. |
| Weighted Photons | Uses photon packet weight instead of binary absorption/scattering. | Every photon contributes to the result, increasing efficiency. | Standard in modern Monte Carlo; unbiased. |
Hybrid & Accelerated Methods
These methods combine Monte Carlo with deterministic techniques or leverage hardware acceleration.
Table 2: Hybrid and Accelerated Photon Tracing Methods
| Method | Description | Typical Speed-Up Factor | Best Suited For |
|---|---|---|---|
| Scaled Monte Carlo | Uses a scaled scattering coefficient (μs') and adjusted phase function (e.g., Henyey-Greenstein). | 2-10x | Homogeneous tissues or initial rapid simulations. |
| Photon Beam/Sheet Tracing | Traces cylindrical beams or sheets of light instead of discrete packets. | 10-100x | Simulating broad-beam sources (e.g., LEDs). |
| GPU Parallelization | Launches millions of photon threads concurrently on GPU cores. | 100-1000x vs. CPU | Any large-scale simulation where photon histories are independent. |
| Hybrid Monte Carlo-Diffusion | Uses MC near sources/ boundaries, diffusion theory in deeper, scattering-dominated regions. | 50-200x | Deep tissue penetration (>5 mm) in highly scattering media. |
Experimental Protocols for Subcutaneous Fat Measurement
The following protocols are derived from recent research on optimizing photon tracing for optical fat sensing.
Protocol 3.1: Validating Efficiency Strategies in a Layered Skin-Fat Model
Objective: To compare the accuracy and computational cost of variance reduction techniques in simulating a diffuse reflectance signal from subcutaneous fat.
Materials: (See "Research Reagent Solutions" below) Software: Custom Monte Carlo code (e.g., in C++/CUDA) or platform like MCX (GPU-accelerated).
Procedure:
- Define Geometry: Create a 3-layer model: Epidermis (0.1 mm, melanin variable), Dermis (1.5 mm, blood volume variable), Subcutaneous Fat (5.0 mm, lipid concentration variable).
- Set Optical Properties: At a target wavelength (e.g., 930 nm for lipid absorption), assign absorption (μa) and reduced scattering (μs') coefficients from published literature for each layer.
- Baseline Simulation: Run a "gold standard" simulation with 10^8 photon packets, using weighted photons but no other variance reduction. Record diffuse reflectance at a radial distance of 5 mm and the total runtime.
- Test Condition Simulation: Run simulations with identical properties and 10^7 photons, each implementing one strategy: a. Russian Roulette with a weight threshold of 0.001. b. Splitting upon entry into the fat layer (split factor = 10). c. Importance sampling biased towards the detector area.
- Analysis: For each condition, calculate the relative error (%) in reflectance vs. the baseline and the relative speed-up (baseline runtime / condition runtime). Record the variance (noise) in the result.
Protocol 3.2: GPU-Accelerated Parameter Fitting for Lipid Concentration
Objective: To inversely determine subcutaneous fat lipid concentration from simulated diffuse reflectance spectra using GPU-accelerated photon tracing.
Procedure:
- Forward Model Setup: Develop a GPU Monte Carlo model (using CUDA or OpenCL) of the layered skin structure. The model input is a set of optical properties (including fat μa as a function of lipid/water ratio).
- Generate Look-up Table (LUT): Run the GPU model across a pre-defined parameter space: fat layer thickness (2-10 mm), fat μa (corresponding to 50%-95% lipid), and dermis scattering. Store the resulting reflectance spectrum (600-1000 nm) for each combination.
- Inverse Search: Acquire a measured diffuse reflectance spectrum from a tissue site.
- Fitting: Use a gradient-descent or neural network algorithm to find the LUT entry that minimizes the difference between the measured and simulated spectra.
- Validation: Compare the fitted lipid concentration and fat thickness against values obtained by MRI or ultrasound on the same subject cohort.
Visualizations
Diagram Title: Photon Tracing in a 3-Layer Skin-Fat Model
Diagram Title: Photon Path with Russian Roulette Logic
The Scientist's Toolkit: Research Reagent Solutions
Table 3: Essential Materials for Photon Tracing in Fat Measurement Research
| Item | Function in Research | Example/Notes |
|---|---|---|
| GPU Computing Cluster | Provides massive parallel processing for tracing billions of photon packets. | NVIDIA A100 or V100 GPUs; Essential for Protocol 3.2. |
| Validated Tissue Optics Database | Provides reference absorption (μa) and scattering (μs) coefficients for skin layers at key wavelengths. | IAVO website data; Critical for setting accurate simulation parameters. |
| Open-Source MC Software (MCX, TIM-OS) | Accelerates development by providing optimized, peer-reviewed photon tracing kernels. | MCX (GPU) or TIM-OS (MATLAB); Allows focus on geometry and inverse model. |
| Spectral Diffuse Reflectance System | Validates simulation outputs with empirical data. | System with fiber probes and spectrometer (600-1000 nm). |
| Co-Registration Imaging (MRI/U/S) | Provides ground truth for subcutaneous fat layer thickness and composition. | Used for final validation of inverse model predictions (Protocol 3.2). |
1. Introduction & Context within Monte Carlo Simulation Thesis
Accurate Monte Carlo (MC) simulation of light transport for subcutaneous adipose tissue (SAT) measurement is critically dependent on the anatomical fidelity of the computational model. A core thesis challenge is that standard geometric models (e.g., homogeneous layers, simple cylinders) fail to capture the high inter-subject variability in fat distribution patterns—visceral vs. subcutaneous, trunk vs. limb, and superficial vs. deep. This application note details protocols for validating and refining model geometry against empirical data to improve the biological relevance and predictive power of MC simulations in metabolic research and drug development.
2. Key Quantitative Data on Fat Distribution Variability
Table 1: Subject-Specific Variability in Abdominal Adipose Tissue Depots (Representative Cohort Data)
| Demographic Cohort | Avg. Total Adipose Tissue Volume (L) | Avg. SAT Volume (L) | Avg. VAT Volume (L) | SAT/VAT Ratio | Primary Distribution Pattern |
|---|---|---|---|---|---|
| Healthy BMI (20-25) | 12.5 ± 3.2 | 9.8 ± 2.5 | 2.7 ± 1.1 | 3.6 | Peripheral, Gluteofemoral |
| Obesity, Male (BMI >30) | 38.2 ± 5.7 | 22.4 ± 4.1 | 15.8 ± 3.8 | 1.4 | Central, Abdominal (Visceral) |
| Obesity, Female (BMI >30) | 42.5 ± 6.1 | 30.5 ± 5.2 | 12.0 ± 3.5 | 2.5 | Central, Abdominal (Subcutaneous) |
| Type 2 Diabetes | 34.8 ± 4.9 | 18.9 ± 3.8 | 15.9 ± 3.2 | 1.2 | High Visceral, Intra-abdominal |
Table 2: Optical Properties of Adipose Tissue at Common NIR Wavelengths (Mean ± SD)
| Tissue Type | Wavelength (nm) | Absorption Coefficient μa (cm⁻¹) | Reduced Scattering Coefficient μs' (cm⁻¹) | Anisotropy Factor (g) |
|---|---|---|---|---|
| Superficial SAT | 850 | 0.08 ± 0.02 | 8.5 ± 1.2 | 0.9 |
| Deep SAT | 850 | 0.06 ± 0.01 | 9.2 ± 1.0 | 0.9 |
| VAT | 850 | 0.12 ± 0.03 | 7.8 ± 1.5 | 0.87 |
| Superficial SAT | 940 | 0.15 ± 0.03 | 7.8 ± 1.0 | 0.89 |
| Deep SAT | 940 | 0.10 ± 0.02 | 8.5 ± 1.1 | 0.89 |
3. Experimental Protocols for Geometry Validation
Protocol 3.1: Multi-Modal Imaging for 3D Geometry Acquisition Objective: To acquire subject-specific anatomical data for constructing and validating MC simulation geometry. Materials: MRI/CT scanner, DXA scanner, 3D optical scanner, segmentation software (e.g., 3D Slicer, Mimics). Procedure:
- Recruit & Consent: Enroll subjects under IRB-approved protocols. Stratify by BMI, sex, and metabolic health.
- Multi-Modal Scan:
- Perform whole-body or abdominal DXA scan to quantify fat mass and lean mass distribution.
- Acquire T1-weighted MRI (or CT) scans with specific fat/water separation sequences (e.g., Dixon MRI) at 1-2 mm slice thickness.
- For surface topography, perform 3D optical scanning of the region of interest (e.g., abdomen).
- Image Co-registration: Use rigid or non-rigid registration algorithms to align DXA, MRI, and 3D surface data into a common coordinate system.
- Tissue Segmentation: Manually or semi-automatically segment MRI/CT images to label voxels as skin, SAT, VAT, muscle, and organ tissues. Export as a labeled 3D volume (e.g., NRRD or DICOM format).
- Mesh Generation: Convert the segmented volume into a 3D tetrahedral or hexahedral mesh suitable for MC simulation (e.g., using iso2mesh). Assign optical properties from Table 2 to each tissue type.
Protocol 3.2: Spatial Frequency Domain Imaging (SFDI) for Surface & Subsurface Validation Objective: To measure spatially-resolved optical properties in vivo for direct comparison with MC simulation output. Materials: SFDI system (projector, CCD/CMOS camera, tunable NIR light source), calibration phantoms, subject positioning bed. Procedure:
- System Calibration: Characterize projector modulation transfer function and camera response using tissue-simulating phantoms with known μa and μs'.
- Subject Measurement: Position the subject's scanned anatomical region under the SFDI system. Ensure congruence with MRI coordinate system using fiduciary markers.
- Data Acquisition: Project sinusoidal patterns at multiple spatial frequencies (e.g., 0, 0.05, 0.1, 0.2 mm⁻¹) and wavelengths (e.g., 850, 940 nm). Capture reflected light.
- Data Processing: Extract diffuse reflectance maps for each frequency. Fit data to a light transport model (e.g., diffusion approximation or MC look-up table) to generate pixel-by-pixel maps of μa and μs'.
- Simulation Comparison: Run MC simulation on the subject-specific mesh, using the same source-detector geometry as the SFDI setup. Compare the simulated spatial frequency response and extracted optical property maps with experimental SFDI results. Iteratively refine mesh geometry (e.g., layer thickness, VAT inclusions) to minimize error.
Protocol 3.3: MC Simulation Discrepancy Analysis Objective: To quantify the error introduced by using generic vs. subject-specific geometry. Materials: High-performance computing cluster, MC simulation software (e.g., MCX, tMCimg, custom code), segmented meshes from Protocol 3.1. Procedure:
- Simulation Set-up:
- Model A (Generic): Use a simple layered slab model with population-average SAT thickness and homogeneous optical properties.
- Model B (Subject-Specific): Use the mesh derived from Protocol 3.1.
- Photon Launch: Simulate 10⁸-10⁹ photons for each model using identical source characteristics (position, direction, beam profile) matching a point spectroscopy or SFDI measurement.
- Output Metrics: Record spatially-resolved diffuse reflectance, photon pathlength in SAT/VAT, and fractional energy absorption per tissue layer.
- Discrepancy Calculation: Compute the relative error for each metric: Error (%) = [(Model A Result - Model B Result) / Model B Result] * 100. Aggregate results across a subject cohort.
4. Diagrams
Title: Subject-Specific Model Validation Workflow
Title: Geometry Discrepancy Analysis Protocol
5. The Scientist's Toolkit: Research Reagent Solutions
Table 3: Essential Materials for Geometry Validation Studies
| Item / Reagent | Function / Application | Key Considerations |
|---|---|---|
| Dixon MRI Sequences | Provides robust fat/water separation for precise segmentation of SAT and VAT depots. | Prefer 6-echo sequences for improved B0 field inhomogeneity correction. |
| Tissue-Simulating Optical Phantoms | Calibration of SFDI systems and validation of MC code. Require known, stable μa and μs'. | Use phantoms with lipid-mimicking absorbers (e.g., Intralipid, India Ink, synthetic fats). |
| 3D Segmentation Software (e.g., 3D Slicer) | Converts medical images into 3D labeled volumes for mesh generation. | Look for AI-assisted segmentation tools to handle large cohort studies efficiently. |
| Mesh Generation Library (e.g., iso2mesh) | Converts segmented volumes into tetrahedral/hexahedral meshes compatible with MC solvers. | Must preserve tissue boundaries and allow assignment of optical properties. |
| GPU-Accelerated MC Code (e.g., MCX) | Enables rapid simulation of photon transport in complex, subject-specific 3D geometries. | Essential for running the high photon counts needed for low-noise validation. |
| Spatial Frequency Domain Imaging (SFDI) System | Provides in vivo maps of optical properties for direct experimental validation of simulations. | Custom systems allow flexibility; commercial systems offer turn-key operation. |
This application note details protocols for a sensitivity analysis, embedded within a broader doctoral thesis employing Monte Carlo simulation for subcutaneous adipose tissue (SAT) measurement research. The primary objective is to systematically identify and rank optical and acoustic parameters—relevant to photoacoustic and optical coherence tomography techniques—based on their influence on SAT measurement accuracy. This guides instrument design and data interpretation for researchers and drug development professionals assessing metabolic health or therapeutic efficacy.
Key Parameters & Quantitative Data
The following parameters are considered for sensitivity analysis. Ranges are derived from literature and biological variability.
Table 1: Optical Parameters for SAT Sensitivity Analysis
| Parameter | Symbol | Typical Range in SAT | Primary Impact |
|---|---|---|---|
| Absorption Coefficient (Lipids) | μa,lipid | 0.05 – 0.15 mm⁻¹ @ 920 nm | Directly affects signal generation in PA. |
| Absorption Coefficient (Water) | μa,water | 0.002 – 0.02 mm⁻¹ @ 920 nm | Influences light penetration and contrast. |
| Scattering Coefficient | μs | 15 – 30 mm⁻¹ @ 920 nm | Governs light distribution and sampling depth. |
| Anisotropy Factor | g | 0.7 – 0.9 | Determines scattering directionality. |
| Reduced Scattering Coefficient | μs' | 1.5 – 7 mm⁻¹ | Effective scattering for diffusion models. |
| Refractive Index | n | ~1.44 – 1.46 | Affects boundary conditions and OCT signal. |
Table 2: Acoustic & System Parameters for SAT Sensitivity Analysis
| Parameter | Symbol | Typical Range | Primary Impact |
|---|---|---|---|
| Speed of Sound | c | 1450 – 1550 m/s in fat | Critical for accurate spatial reconstruction. |
| Acoustic Attenuation | μac | 0.3 – 0.8 dB/cm/MHz | Determines PA signal strength at detector. |
| Ultrasonic Detector Bandwidth | BW | 10 – 50 MHz | Affects axial resolution and frequency content. |
| Laser Pulse Width | τ | 5 – 100 ns | Influences thermal confinement for PA. |
| Central Optical Wavelength | λ | 800 – 1300 nm (NIR window) | Determines penetration depth and chromophore selectivity. |
Experimental Protocols
Protocol: Monte Carlo-Based Global Sensitivity Analysis
Objective: To quantify the relative influence of each parameter in Table 1 & 2 on simulated SAT measurement outputs (e.g., photoacoustic amplitude, OCT reflectance).
Materials: High-performance computing cluster, Monte Carlo simulation software (e.g., MCX, NIRFAST), Python/MATLAB for statistical analysis.
Procedure:
- Define Input Distributions: For each of the N parameters (Pi), assign a probability distribution (e.g., uniform ±20% around nominal value) covering its biological/technical range.
- Generate Parameter Sets: Using a Latin Hypercube Sampling (LHS) scheme, generate M (e.g., M=1000) unique combinations of all N parameters.
- Run Forward Simulations: For each parameter set
j, execute the Monte Carlo model of light transport (and acoustic propagation, if coupled) to compute the output metric of interest (Yj), such as the simulated photoacoustic pressure at the SAT-fascia interface. - Calculate Sensitivity Indices: Perform variance-based sensitivity analysis (Sobol method). Compute first-order (Si) and total-order (STi) sensitivity indices for each parameter Pi.
- Si: Fraction of output variance attributable solely to Pi.
- STi: Fraction of variance due to Pi and all its interactions with other parameters.
- Rank Parameters: Rank parameters by descending STi. Parameters with STi > 0.1 are considered highly influential.
Protocol: Experimental Validation Using Tissue Phantoms
Objective: To empirically validate the sensitivity ranking for the top three identified parameters.
Materials: See "Scientist's Toolkit" below.
Procedure:
- Phantom Fabrication: Create a base lipid-gelatin phantom mimicking SAT optical properties (μa, μs', c).
- One-Factor-at-a-Time (OFAT) Experiment: Systematically vary one high-sensitivity parameter (e.g., μs') across 5 levels, holding others constant. Repeat for other top parameters.
- Data Acquisition: For each phantom, acquire photoacoustic signals at 920 nm and 1210 nm using a calibrated imaging system.
- Response Measurement: Calculate the metric "Ratio of PA Amplitudes (R920/1210)" as a proxy for lipid content.
- Analysis: Perform linear regression of R920/1210 against the varied parameter. The slope quantifies empirical sensitivity.
Visualizations
Diagram 1: Global Sensitivity Analysis Workflow (88 chars)
Diagram 2: Key Parameters in PA Signal Chain (67 chars)
The Scientist's Toolkit
Table 3: Essential Research Reagents & Materials
| Item | Function/Explanation | Example Vendor/Product |
|---|---|---|
| Lipid Phantoms | Mimic SAT optical scattering & absorption for controlled experiments. | Homebrew (Intralipid, Agar, Ink) or commercial (Biomimic, INO). |
| Optical Spectrometer | Measures μa and μs' of tissue/phatom samples via integrating sphere. | Ocean Insight, PerkinElmer. |
| Ultrasound Gel Phantoms | Mimic acoustic properties (speed of sound, attenuation) of SAT for calibration. | CIRS, ATS Laboratories. |
| Tunable Pulsed Laser | Provides wavelength-selectable light pulses for multi-spectral PA excitation. | NTK Photonics, Opotek. |
| High-Frequency US Transducer | Detects broadband photoacoustic waves; center frequency & bandwidth are key parameters. | Verasonics, Olympus. |
| Monte Carlo Simulation Software | Computes light transport for complex geometries; essential for in-silico sensitivity analysis. | MCX (http://mcx.space), NIRFAST. |
| Sensitivity Analysis Library | Computes Sobol indices from input/output data. | SALib (Python), Sensitivity MATLAB Toolbox. |
Benchmarking Success: Validating Simulations and Comparing Against Alternative Methods
Within the broader thesis on advancing Monte Carlo (MC) simulation for quantitative subcutaneous adipose tissue (SAT) measurement, this document details the critical validation pipeline. The accuracy of novel optical or bioimpedance simulation models for SAT assessment must be rigorously validated against physical phantoms and established clinical imaging gold standards, specifically Magnetic Resonance Imaging (MRI) and Computed Tomography (CT). This application note provides structured protocols and comparative data frameworks for researchers and drug development professionals to execute this validation.
Research Reagent Solutions & Essential Materials
Table 1: Scientist's Toolkit for Validation Experiments
| Item | Function in Validation Pipeline |
|---|---|
| Multi-layered Tissue Phantoms | Physically mimic optical (scattering, absorption) and dielectric properties of skin, SAT, and muscle layers. Serve as a controlled, ground-truth system for simulation calibration. |
| Adipose Equivalent Materials | Hydrogel or silicone-based materials with calibrated fat-mimicking properties (e.g., specific lipid fractions, conductivity, reduced scattering coefficient μs'). |
| Clinical 3T MRI Scanner | Gold standard for soft-tissue differentiation. Provides high-resolution water-fat separation imaging (e.g., Dixon sequences) for quantifying SAT volume. |
| Quantitative CT (QCT) Scanner | Gold standard for tissue density measurement. Provides Hounsfield Unit (HU) values that directly correlate with adipose tissue density. |
| Reference Electrodes & Optical Probes | Interface hardware to collect experimental bioimpedance or diffuse optical data from phantoms/participants for comparison with simulated signals. |
| DICOM Viewers & Analysis Software | (e.g., 3D Slicer, Horos) For segmentation of SAT from MRI/CT images to establish ground truth volumes and geometries. |
| MC Simulation Software | (e.g., GPU-accelerated MCX, NIRFAST, or custom code) Platform for modeling light transport or electric field distribution in simulated tissue geometries. |
| Digital Reference Phantoms | 3D voxelated or mesh geometries (e.g., from Visible Human Project or MRI scans) used as input for simulation, enabling direct comparison with clinical image-derived data. |
Experimental Protocols
Protocol 3.1: Phantom-Based Validation of Optical/Bioimpedance Simulations
Objective: To calibrate and validate MC simulation predictions of signal response (e.g., reflectance, phase shift) against measurements from fabricated physical phantoms with known SAT-like properties.
Materials:
- Fabricated two-layer phantom (Layer 1: "dermis," Layer 2: "SAT" with variable known thickness).
- Optical spectrometer or Bioimpedance analyzer with probe.
- MC simulation software.
- Calipers, ruler.
Methodology:
- Phantom Characterization: Measure the optical (μa, μs', n) or dielectric (conductivity σ, permittivity ε) properties of each phantom layer using independent reference techniques (e.g., integrating sphere, impedance analyzer).
- Experimental Data Acquisition: For a range of source-detector distances (optical) or electrode configurations (bioimpedance), acquire the measured signal (e.g., diffuse reflectance, magnitude/phase).
- Simulation Setup: Construct a digital twin of the phantom in the simulation environment. Precisely input the measured geometry (layer thicknesses) and characterized material properties from Step 1.
- Simulation Execution: Run the MC simulation using an identical source-detector configuration as the physical experiment. Record the simulated signal output.
- Comparison & Calibration: Compare simulated vs. measured data. Calculate metrics like normalized root mean square error (NRMSE). Iteratively adjust unverified model parameters (e.g., anisotropy factor g) within physical limits to minimize error, thereby calibrating the simulation.
Protocol 3.2: Validation Against Clinical MRI (Dixon Sequence)
Objective: To validate MC-simulated SAT segmentation or property estimation against SAT volume quantified from clinical water-fat MRI.
Materials:
- Cohort of participant MRI scans (3D Dixon sequence).
- MC simulation platform.
- DICOM segmentation software (e.g., 3D Slicer).
Methodology:
- MRI Acquisition & SAT Segmentation: Acquire axial 3D Dixon MRI scans of the abdominal region. Use the in-phase, out-of-phase, water-only, and fat-only image series in segmentation software to manually or semi-automatically segment the SAT compartment. Export the precise SAT volume (in cm³) and a 3D mask of its geometry.
- Subject-Specific Digital Phantom Creation: Convert the participant's water/fat MRI data into a 3D digital phantom. Assign each voxel a tissue type (skin, SAT, muscle, viscera) based on signal intensity and known anatomy. Assign corresponding simulation properties to each tissue type from literature.
- Simulation Execution: Run the MC simulation (e.g., modeling a diffuse optical tomography scan or a bioimpedance sweep) on the subject-specific digital phantom.
- Inverse Parameter Estimation: Use the simulation's forward model in an inverse algorithm to estimate a bulk SAT property (e.g., average lipid concentration) or total SAT volume from the simulated measurement.
- Direct Comparison: Compare the simulation-inferred SAT volume or property map to the MRI-segmented ground-truth volume. Perform spatial correlation analysis if property maps are generated.
Protocol 3.3: Validation Against Quantitative CT (QCT)
Objective: To correlate MC-simulated parameters with adipose tissue density information provided by QCT Hounsfield Units (HU).
Materials:
- Cohort of participant abdominal CT scans.
- MC simulation platform.
- DICOM analysis software with ROI tools.
Methodology:
- CT Acquisition & ROI Analysis: Obtain calibrated QCT scans. Identify a standardized region of interest (ROI) within the SAT layer. Record the mean and standard deviation of Hounsfield Units (HU) within this ROI. Use established HU ranges for adipose tissue (typically -190 to -30 HU).
- HU to Property Conversion: Use published relationships to convert the mean HU value in the SAT ROI to an estimated physical property relevant to the simulation (e.g., density in g/cm³, which can inform lipid concentration or dielectric property).
- Simulation & Inverse Estimation: As in Protocol 3.2, create a digital phantom from the CT data (using tissue segmentation based on HU thresholds). Run the simulation and inverse algorithm to estimate the SAT property (e.g., lipid content).
- Correlation Analysis: Perform a linear regression analysis between the simulation-inferred SAT property and the CT-derived HU value or density across all subjects in the cohort.
Data Presentation
Table 2: Summary of Validation Metrics and Comparative Data from a Hypothetical Study
| Validation Target | Primary Quantitative Metric | Typical Gold Standard Value Range | Simulated/Inferred Result | Agreement/Error |
|---|---|---|---|---|
| Phantom SAT Layer Thickness | Normalized RMSE (NRMSE) | 5 mm, 10 mm, 15 mm (known) | 5.1 mm, 9.8 mm, 14.7 mm | NRMSE = 2.3% |
| MRI-Derived SAT Volume | Pearson Correlation Coefficient (r) | 1500 - 4500 cm³ (from Dixon MRI) | Strong linear correlation (r = 0.98, p<0.001) | Bias: -45 cm³ (simulation underestimation) |
| CT-Derived Adipose Density | Linear Regression Slope/R² | -100 ± 20 HU (QCT ROI) | Lipid conc. vs. HU: R² = 0.94 | Slope: -0.08 %lipid/HU |
| Simulation Runtime Performance | Time per Simulation | N/A (Benchmark) | 120 sec (GPU accelerated) vs. 4800 sec (CPU) | 40x speedup |
Mandatory Visualizations
Validation Pipeline Workflow for SAT Simulation Models
Digital Phantom Creation from Clinical Images
Application Notes and Protocols
1. Introduction and Thesis Context Within a broader thesis investigating Monte Carlo (MC) simulation for subcutaneous adipose tissue (SAT) measurement, predicting SAT volume or distribution is a critical computational task. MC simulations model photon migration through heterogeneous tissues, generating synthetic data used to train and validate SAT prediction algorithms (e.g., machine learning models linking optical signals to SAT metrics). Quantifying the performance of these predictive models is paramount. This document outlines standardized metrics and protocols for evaluating Accuracy, Precision, and Robustness in the specific context of SAT prediction research, ensuring reliable translation to preclinical and clinical drug development.
2. Core Performance Metrics: Definitions and Quantitative Frameworks Performance is evaluated against a ground truth, typically high-resolution MRI or CT-derived SAT volumetry. The following metrics are mandated.
Table 1: Primary Metrics for SAT Prediction Accuracy & Precision
| Metric | Formula | Interpretation in SAT Context | Ideal Value |
|---|---|---|---|
| Mean Absolute Error (MAE) | MAE = (1/n) * Σ |yi - ŷi| |
Average absolute deviation of predicted SAT volume from true volume. Reported in cm³ or mm³. | 0 |
| Mean Absolute Percentage Error (MAPE) | MAPE = (100%/n) * Σ |(yi - ŷi)/y_i| |
Average percentage error. Useful for relative error assessment across subjects. | 0% |
| Root Mean Square Error (RMSE) | RMSE = √[ (1/n) * Σ (yi - ŷi)² ] |
Penalizes larger errors more heavily than MAE. Sensitive to outliers. | 0 |
| Coefficient of Determination (R²) | R² = 1 - [Σ (yi - ŷi)² / Σ (y_i - ȳ)²] |
Proportion of variance in true SAT explained by the model. | 1 |
| Precision (Repeatability) | Std. Dev. of predictions across repeated MC trials under identical conditions. | Measures model's output stability given stochastic MC input noise. Low Std. Dev. is key. | → 0 |
Table 2: Metrics for SAT Prediction Robustness
| Metric | Assessment Method | Interpretation in SAT Context |
|---|---|---|
| Sensitivity to MC Photon Count | Vary input photon count (e.g., 10⁶ to 10⁹), plot MAE/R² vs. count. | Determines computational cost vs. performance trade-off for clinical feasibility. |
| Sensitivity to Tissue Optical Properties | Perturb MC inputs (scattering, absorption coefficients) within physiological bounds. | Evaluates model reliability against inter-subject physiological variability. |
| Cross-Validation Performance | Use k-fold cross-validation; report mean ± std. dev. of MAE/R² across folds. | Estimates generalizability to new, unseen subject data. |
| Bland-Altman Analysis | Plot difference (Predicted - True) vs. average of both for all subjects. | Visualizes bias and limits of agreement, identifying systematic over/under-prediction. |
3. Experimental Protocols
Protocol 3.1: Benchmarking SAT Prediction Accuracy & Precision Objective: To quantify the baseline accuracy and precision of a candidate SAT prediction model. Materials: Ground truth SAT volumes (from MRI/CT for N≥50 subjects), corresponding MC-simulated data (e.g., photon depth distributions, time-resolved signals). Procedure:
- Data Partition: Randomly split subject data into training (70%) and held-out test (30%) sets.
- Model Training: Train the prediction algorithm (e.g., neural network, linear regression) using the training set and associated MC-derived features.
- Prediction: Generate SAT volume predictions (ŷ_i) for the held-out test set.
- Metric Calculation: Compute MAE, MAPE, RMSE, and R² as defined in Table 1 using the ground truth (yi) and predictions (ŷi).
- Precision Assessment: For a subset (e.g., n=5 subjects), run the forward MC simulation 20 times with different random seeds. Process each through the trained model. Calculate the standard deviation of the 20 predicted SAT volumes per subject. Report the average standard deviation.
Protocol 3.2: Assessing Robustness to MC Simulation Parameters Objective: To evaluate the model's susceptibility to variations in MC simulation inputs. Materials: Trained model from Protocol 3.1. MC simulation software. Procedure:
- Phon Count Sensitivity: Select 10 representative subjects. For each, generate 5 new MC datasets with photon counts varying logarithmically (e.g., 10⁶, 10⁷, 10⁸, 10⁹). Hold all other optical properties constant.
- Run Predictions: Process all new MC datasets through the trained model.
- Analyze: Plot R² and MAE of predictions (against the fixed ground truth) as a function of photon count. The plateau point indicates the count-sufficient for stable predictions.
- Optical Property Perturbation: For the same 10 subjects, generate MC data using baseline optical properties. Then, create perturbed datasets by varying absorption (µa) and reduced scattering (µs') coefficients by ±10% and ±20% within realistic SAT ranges (e.g., µa ~0.002-0.01 mm⁻¹, µs' ~0.5-1.5 mm⁻¹ at near-infrared wavelengths).
- Analyze: Compute the percentage change in predicted SAT volume for each perturbation relative to the baseline prediction. Report the maximum deviation observed.
4. Signaling and Workflow Visualizations
Title: SAT Prediction & Validation Workflow
Title: Core Monte Carlo Photon Steps for SAT
5. The Scientist's Toolkit: Research Reagent Solutions
Table 3: Essential Materials for SAT Prediction Research
| Item | Function in SAT Prediction Research |
|---|---|
| Monte Carlo Simulation Software (e.g., MCML, GPU-based MCX, TIM-OS) | Generates the fundamental synthetic dataset modeling light-tissue interaction for varied SAT geometries and optical properties. |
| High-Resolution 3D Imaging Data (MRI/CT DICOM files) | Provides the anatomical ground truth for SAT volume and spatial distribution, essential for model training and validation. |
| Optical Property Database (Literature values for µa, µs', g of skin, fat, muscle) | Informs realistic simulation parameters for MC, ensuring biological relevance of synthetic data. |
| Machine Learning Framework (Python: TensorFlow/PyTorch, scikit-learn) | Platform for developing and training the predictive algorithms that map MC features to SAT metrics. |
| Numerical Phantom Repository (e.g., virtual patient models) | Enables controlled, scalable testing of the MC-prediction pipeline against known truths before clinical data use. |
| Benchmarking Dataset (Public or in-house paired optical/MRI data) | Serves as the ultimate test set for comparing different SAT prediction algorithms under standardized conditions. |
Within the broader thesis on advancing Monte Carlo (MC) simulation for non-invasive subcutaneous adipose tissue (SAT) measurement, a critical methodological review is required. Accurate SAT quantification is vital for metabolic disease research, drug development for obesity, and body composition studies. This necessitates evaluating the primary computational photon transport models: stochastic Monte Carlo and deterministic Analytical Models based on Diffusion Theory. Their performance in simulating light interaction with the stratified structure of skin and subcutaneous fat is paramount for developing robust optical devices.
Foundational Principles
Monte Carlo Simulation: A stochastic numerical technique that tracks individual photon packets as they undergo random absorption and scattering events within a defined tissue geometry. It is considered the "gold standard" for accuracy in complex, layered media.
Analytical Models (Diffusion Theory): A deterministic approach that solves a simplified differential equation derived from the radiative transfer equation, assuming isotropic scattering and a photon fluence rate that is almost diffuse. It is computationally efficient but relies on approximations.
Quantitative Comparison: Strengths and Limitations
Table 1: Core Comparison of MC and Analytical Models for Layered Tissues
| Aspect | Monte Carlo Method | Analytical Models (Diffusion Theory) |
|---|---|---|
| Fundamental Approach | Stochastic, particle-based. Tracks photon packets. | Deterministic, continuum-based. Solves PDEs. |
| Computational Demand | Very High (Hours to days). Scales with photon count and geometry complexity. | Very Low (Milliseconds to seconds). |
| Geometric Flexibility | High. Can model complex, multi-layered structures, finite beams, and heterogeneities precisely. | Low. Best for simple, semi-infinite or slab geometries. Layer transitions are challenging. |
| Accuracy in SAT Context | High, especially for short source-detector separations, superficial layers (epidermis, dermis), and low-scattering regions like fat. | Limited. Often inaccurate for superficial layers, small geometries, and tissues with low scattering or high absorption. |
| Output Detail | Provides full photon history, enabling detailed sensitivity analysis (e.g., partial pathlength in each layer). | Provides bulk measures like total reflectance/transmittance. Layer-resolved data is inferential. |
| Key Strength | Accuracy and flexibility. Gold standard for validating other models and designing complex probes. | Speed and simplicity. Enables real-time inverse fitting for parameter extraction in simple cases. |
| Primary Limitation | Computational cost prohibitive for real-time inversion or parameter optimization. | Accuracy compromises in layered tissue, particularly for near-surface and low-scattering layers. |
Table 2: Performance in Simulating Key SAT Measurement Parameters
| Parameter/Scenario | Monte Carlo Performance | Diffusion Theory Performance | Implication for SAT Research |
|---|---|---|---|
| Spatially-Resolved Reflectance | Excellent accuracy across all source-detector separations (SDS). | Poor accuracy at short SDS (<~1 transport mean free path). Fails to model sub-diffusive regime. | Critical for probe design; MC is essential for modeling small, clinically viable probe geometries. |
| Time-/Frequency-Domain Signals | Can directly simulate pulse propagation or modulated light. | Provides analytical solutions for simple cases. | MC validates diffusion results in time-resolved SAT spectroscopy. |
| Sensitivity to Fat Layer Thickness | High. Can precisely map detected photon partial pathlength in fat layer. | Low. Diffuse nature blunts sensitivity to specific thin layer changes. | MC is superior for developing calibration curves relating signal to SAT thickness. |
| Influence of Dermal Plexus (Blood) | Can explicitly model discrete blood vessels or chromophore layers. | Typically models blood as a homogeneous absorber within a layer. | MC provides more realistic assessment of confounding signals from dermal blood flow. |
Experimental Protocols & Application Notes
Protocol 1: Validating a Novel Optical Probe Design Using Monte Carlo
Aim: To simulate the spatially-resolved reflectance from a 3-layer skin model (epidermis, dermis, subcutaneous fat) for a proposed multi-SDS fiber-optic probe.
Workflow:
- Geometry Definition: Use MCML or GPU-accelerated code (e.g.,
mcxyz) to define a three-layer slab. Set thicknesses: Epidermis=0.1 mm, Dermis=1.5 mm, variable SAT (5-30 mm). Set optical properties (µa, µs, g, n) for each layer at the target wavelength (e.g., 930 nm for fat lipid peak). - Photon Launch: Define a point source or Gaussian beam at the surface. Launch 10^7 - 10^9 photon packets.
- Detection: Implement ring detectors at multiple SDS (e.g., 0.5, 1.0, 1.5, 2.0, 2.5 mm) to collect escaping reflectance.
- Output Analysis: Extract diffuse reflectance R(d) for each SDS. Calculate the partial pathlength spent in the fat layer for photons collected at each SDS.
- Validation: Compare R(d) curves against controlled phantom experiments or published benchmark data.
Protocol 2: Rapid Inverse Extraction of Optical Properties Using a Hybrid Approach
Aim: To estimate bulk tissue optical properties from a clinical measurement in near real-time.
Workflow:
- Forward Model Library: Use MC simulation offline to generate a vast lookup table (LUT) of reflectance spectra/time-resolved curves for a wide range of plausible optical properties in a layered model.
- Clinical Measurement: Acquire spatially- or time-resolved reflectance from the subject's skin using the calibrated instrument.
- Inverse Solution: Use a fast, deterministic algorithm (e.g., Levenberg-Marquardt) to fit the analytical diffusion model (or an MC-derived empirical model) to the measured data. The diffusion model provides rapid iteration.
- Result Refinement: The initial estimates from the analytical fit can be used to narrow the search within the pre-computed MC LUT for a final, more accurate estimation of properties like fat µa and µs'.
Visualizations
(Model Selection Workflow for Layered Tissue)
(MC Simulation of Light in Skin & Fat Layers)
The Scientist's Toolkit: Research Reagent Solutions
Table 3: Essential Resources for Photon Transport Modeling in Tissue Optics
| Resource Category | Specific Tool / Solution | Function & Relevance to SAT Research |
|---|---|---|
| MC Simulation Software | MCML / CUDAMC / mcxyz |
Standard CPU/GPU codes for modeling light in multi-layered tissues. Essential for generating accurate forward data. |
| Analytical Model Solvers | Diffusion Equation Solvers (e.g., in MATLAB, Python pydiffusion) |
Provide fast forward models for inverse fitting of optical properties from reflectance data. |
| Optical Property Database | ioptt.org / Published tables (e.g., Bashkatov et al.) |
Reference data for absorption (µa) and scattering (µs) coefficients of epidermis, dermis, and fat at key wavelengths. |
| Validation Phantoms | Liquid Phantoms (Intralipid, India Ink) / Solid Layered Phantoms | Tissue-simulating materials with known optical properties to experimentally validate simulation results. |
| Inverse Optimization Algorithms | Levenberg-Marquardt, Genetic Algorithms (in scipy.optimize) |
Algorithms to fit model outputs to measured data, extracting parameters like fat layer thickness and composition. |
| High-Performance Computing (HPC) | GPU Clusters / Cloud Computing (AWS, GCP) | Necessary to run large-scale MC simulations (10^9 photons) or generate extensive lookup tables in feasible time. |
Application Notes on Monte Carlo Simulation in Subcutaneous Adipose Tissue (SAT) Research
Monte Carlo (MC) simulation remains a cornerstone for modeling photon transport in tissue, a critical component for developing and validating non-invasive subcutaneous fat measurement techniques like near-infrared spectroscopy (NIRS) and optical coherence tomography (OCT). Its stochastic nature provides a gold standard for solving the radiative transfer equation in complex, heterogeneous biological structures. In the era of hybrid and AI-assisted models, MC’s role is evolving from a standalone validator to an integrated data generator and physical law anchor for data-driven approaches.
Table 1: Comparative Analysis of Modeling Approaches for SAT Optical Measurement
| Model Type | Core Principle | Typical Application in SAT Research | Computational Cost | Key Limitation |
|---|---|---|---|---|
| Pure Monte Carlo | Stochastic photon packet tracking through simulated tissue layers. | Gold-standard validation of simpler models; investigating photon-tissue interaction fundamentals. | Very High (10^6-10^9 photons) | Prohibitively slow for real-time inversion or large datasets. |
| Analytical Models (e.g., Diffusion Approximation) | Simplified analytical solutions to light transport. | Quick, approximate inverse models for bulk tissue properties. | Low | Fails in low-scattering regions, near sources/ boundaries (critical for shallow SAT). |
| Hybrid MC-AI Models | MC generates training data; AI (e.g., DNN) learns inverse mapping. | Rapid, accurate prediction of SAT thickness/adipocyte size from spectral or image data. | High (initial training), Low (deployment) | Performance bound by quality/scope of MC training data. |
| Physics-Informed Neural Networks (PINNs) | Neural network constrained by physical laws (e.g., RTE terms) during training. | Reconstructing SAT optical properties from sparse measurements without massive MC datasets. | Medium-High | Complex implementation; sensitive to hyperparameters and loss weighting. |
The integration path is clear: MC simulations generate the accurate, ground-truth-labeled data (e.g., input optical properties -> output reflectance spectra) needed to train robust AI models that can perform inverse estimations in milliseconds, bridging the gap between physical accuracy and clinical feasibility.
Detailed Experimental Protocols
Protocol 1: Generating a Labeled Dataset for AI Model Training via Monte Carlo Simulation
Objective: To create a dataset linking simulated SAT optical properties to simulated measurement outcomes (e.g., spatially-resolved reflectance) for training a convolutional neural network (CNN).
Materials & Software:
- High-performance computing cluster or workstation.
- Validated MC simulation software (e.g., MCX, TIM-OS, or custom code).
- Python/R for data orchestration and post-processing.
Procedure:
- Define Parameter Space: Based on published literature, define physiologically relevant ranges for:
mua_sat, mua_lean: Absorption coefficients of SAT and underlying lean muscle (1/cm).mus_sat, mus_lean: Reduced scattering coefficients (1/cm).thickness_sat: SAT layer thickness (0.5 mm to 30 mm).g: Anisotropy factor (typically ~0.9 for tissue).n: Refractive index of each layer.
Automated Simulation Execution:
- Script a loop to run 50,000-500,000 individual MC simulations, each with a unique, randomly sampled combination of parameters from Step 1.
- Each simulation models a two-layer tissue geometry (SAT over muscle) with a point source at the surface and a detector array.
- Per simulation, launch
10^7photon packets to ensure low variance.
Data Extraction and Labeling:
- For each run, record the spatially-resolved diffuse reflectance profile
R(r)at the surface as the input feature. - Record the set of optical properties and thickness used for that run as the ground-truth label.
- Store each
[R(r), (mua_sat, mus_sat, thickness_sat,...)]pair in a structured database (e.g., HDF5).
- For each run, record the spatially-resolved diffuse reflectance profile
Dataset Curation: Split the final dataset into training (70%), validation (15%), and test (15%) sets, ensuring no parameter distribution bias between sets.
Protocol 2: Validating a Hybrid MC-AI Pipeline for Adipose Thickness Prediction
Objective: To test the accuracy of a CNN trained on MC data against independent, in silico and phantom benchmarks.
Materials:
- Trained CNN model from Protocol 1.
- Independent MC test dataset (not used in training).
- Experimental phantom data (layered silicone with known optical properties and thickness).
Procedure:
- Benchmarking on In Silico Test Set:
- Feed the
R(r)profiles from the held-out MC test set into the trained CNN. - Record the CNN's predicted SAT thickness and optical properties.
- Calculate mean absolute error (MAE) and root mean square error (RMSE) against the known MC ground truth.
- Feed the
Benchmarking on Experimental Phantom Data:
- Acquire spatially-resolved reflectance measurements from fabricated tissue phantoms with precisely characterized SAT-simulating layers.
- Preprocess the experimental
R_exp(r)to match the normalization and noise characteristics of the MC-generated training data. - Input
R_exp(r)into the CNN and record predictions. - Compare predicted thickness and properties to the physical phantom's known characteristics.
Comparison to Traditional Inverse Model:
- Fit the same experimental
R_exp(r)data using a standard, iterative inverse diffusion model. - Compare the accuracy, precision, and computational time of the hybrid MC-AI pipeline versus the traditional method.
- Fit the same experimental
Table 2: Key Research Reagent Solutions for SAT Optical Measurement Development
| Reagent/Material | Function in Research Context |
|---|---|
| Multi-Layered Tissue-Simulating Phantoms | Physical validation standards with tunable optical properties (μa, μs') and known thicknesses to mimic SAT over muscle. |
| Lipid Emulsions (e.g., Intralipid) | A standardized scattering agent used in liquid phantoms to mimic the scattering properties of adipose tissue. |
| Absorbers (e.g., India Ink, Nigrosin) | Used in phantom fabrication to precisely mimic the absorption spectrum of tissue chromophores (hemoglobin, lipids, water). |
| Optical Clearing Agents (e.g., Glycerol, PEG) | Chemicals applied to reduce tissue scattering; used in ex vivo studies to understand light transport limits and enhance signal. |
| Fluorescent/Radioactive Lipid Probes | Tags for in vivo or ex vivo validation of lipid distribution and volume, providing an alternate measurement for correlation. |
| High-Fidelity MC Simulation Software (MCX, TIM-OS) | Digital reagents to generate the essential training data and ground truth for hybrid and AI model development. |
Visualizations
Short Title: Hybrid MC-AI Model Workflow for Tissue Optics
Short Title: Photon Paths in Subcutaneous Fat Measurement
1. APPLICATION NOTES
Monte Carlo (MC) simulation, a computational technique for modeling stochastic processes, is a cornerstone in the broader thesis on subcutaneous fat measurement research. Its application diverges significantly when tailored for Drug Efficacy Trials versus Population Health Studies, reflecting differing goals in precision vs. generalizability.
Drug Efficacy Trials (Phase II/III): MC simulations are employed to model the pharmacokinetic/pharmacodynamic (PK/PD) response of a novel therapeutic agent within a biologically plausible, yet tightly controlled, virtual patient population. In the context of subcutaneous fat research, this is critical for drugs targeting metabolic diseases (e.g., GLP-1 agonists, lipase inhibitors). Simulations model drug distribution into adipose tissue, receptor binding dynamics, and subsequent fat metabolism, predicting efficacy endpoints like reduction in subcutaneous fat volume. The focus is on isolating the drug's signal from noise by simulating confounding factors (e.g., diet variability) as controlled variables.
Population Health Studies: Here, MC simulation is used to model the complex, multifactorial determinants of subcutaneous fat distribution across large, heterogeneous populations. Simulations incorporate stochastic variables for genetics, socioeconomic factors, long-term lifestyle patterns, environmental exposures, and access to healthcare. The goal is to understand population-level risk distributions, forecast public health burdens related to obesity, and evaluate the potential impact of broad interventions (e.g., sugar tax, public health campaigns) on population adiposity metrics.
2. COMPARATIVE DATA SUMMARY
Table 1: Core Application Parameters for Monte Carlo Simulation
| Parameter | Drug Efficacy Trial Application | Population Health Study Application |
|---|---|---|
| Primary Objective | Estimate causal effect size of intervention; optimize trial design (sample size, dose). | Model disease prevalence & risk distribution; assess population-level intervention impact. |
| Virtual Cohort | Synthetic cohort mimicking inclusion/exclusion criteria (n=1,000-10,000). | Representative of national/regional demographic strata (n=50,000-1,000,000+). |
| Key Stochastic Inputs | PK variability, PD response, adherence (high), measurement error of imaging (MRI/CT). | Incidence of health behaviors, environmental exposures, access to care, genetic risk scores. |
| Time Horizon | Short-term (weeks to months), aligned with trial duration. | Long-term (years to decades) for chronic disease progression. |
| Outcome of Interest | Change in subcutaneous adipose tissue (SAT) volume/area; responder rate. | Population distribution of SAT; incidence of SAT-related comorbidities; cost-effectiveness. |
| Validation Benchmark | Against historical trial data or Phase I PK/PD data. | Against large-scale epidemiological datasets (e.g., NHANES, UK Biobank). |
Table 2: Simulation Output & Decision Support
| Output Metric | Drug Efficacy Trial Use | Population Health Study Use |
|---|---|---|
| Probability of Success (PoS) | Primary: PoS of trial meeting primary efficacy endpoint (p<0.05). | Not typically calculated. |
| Treatment Effect Distribution | Models uncertainty in mean SAT reduction; informs dose selection. | Models heterogeneity in intervention effect across subpopulations. |
| Sensitivity Analysis | Identifies PK parameters most critical to efficacy outcome. | Identifies social/structural drivers with largest impact on population SAT. |
| Risk Estimation | Risk of adverse event exceeding threshold. | Population attributable risk for SAT-related morbidity. |
3. EXPERIMENTAL PROTOCOLS
Protocol 1: MC Simulation for Dose-Response in a Phase IIb Fat Reduction Trial
Objective: To predict the dose-response relationship and optimal dosing regimen for a novel lipolytic agent's effect on abdominal SAT volume.
Materials (Research Reagent Solutions):
- PK/PD Modeling Software (e.g., NONMEM, R/Python): Platform for building mathematical models of drug action.
- Prior PK Data (Phase I): Provides parameters (clearance, volume of distribution) for defining population variability.
- In Vitro PD Data: Concentration-effect relationships for target enzyme/receptor in human adipocytes.
- Historical Control Data: Placebo-arm SAT change from previous trials (model input for natural variation).
- SAT Measurement Error Model: Statistical model (e.g., based on MRI reproducibility studies) defining noise in primary endpoint.
Methodology:
- Model Development: Develop a linked PK/PD model. The PK module uses a multi-compartment model, including a subcutaneous adipose tissue compartment. The PD module uses an Emax model to relate drug concentration in SAT to the rate of lipolysis.
- Parameter Population: Define distributions for each PK and PD parameter (e.g., log-normal for clearances, normal for Emax). Correlations between parameters are specified.
- Virtual Trial Execution: a. For each virtual patient (n=5000), sample a parameter set from the defined distributions. b. Simulate drug concentration over time for a 12-week period under different dosing regimens (e.g., 2mg, 5mg, 10mg daily). c. Calculate the corresponding PD effect (lipolysis rate) and integrate to estimate change in SAT volume. d. Add realistic measurement error sampled from the SAT Measurement Error Model.
- Analysis: For each dose, compute the distribution of Week 12 SAT change. Perform statistical testing (simulated ANCOVA) against a concurrent virtual placebo arm. Calculate PoS for achieving >5% mean reduction over placebo with p<0.05.
- Sensitivity: Use variance-based sensitivity analysis (e.g., Sobol indices) to identify which PK/PD parameters contribute most to variance in the outcome.
Protocol 2: MC Simulation for Evaluating a Public Health Intervention on Population Adiposity
Objective: To project the 10-year impact of a proposed sugar-sweetened beverage (SSB) tax on the population distribution of subcutaneous fat in adults.
Materials (Research Reagent Solutions):
- National Health Survey Data (e.g., NHANES): Provides baseline distributions of BMI, SAT, SSB consumption, demographics.
- Price Elasticity Meta-Analysis: Provides distribution of demand responsiveness to SSB price changes.
- Diet-SAT Risk Model: Published longitudinal model linking caloric intake from sugars to SAT accrual.
- Population Projection Tables: Official forecasts for demographic changes (aging, migration).
- Microsimulation Platform (e.g., HALEY, Java/Python): Software for simulating individual life-courses.
Methodology:
- Agent Definition: Create a starting virtual population (n=100,000) statistically representative of the target national population, with attributes: age, sex, income, baseline SAT, daily SSB consumption.
- Intervention Model: Apply a 20% price increase to SSBs. For each agent, sample a price elasticity coefficient to determine their percentage change in consumption.
- Dynamic Simulation: a. For each annual cycle over 10 years, update agent's SSB consumption based on intervention effect. b. Calculate change in daily caloric intake. c. Update agent's SAT using the Diet-SAT Risk Model, incorporating stochastic elements for aging and individual metabolic variability. d. Annually, a subset of agents is "replaced" based on mortality/immigration rates using projection tables.
- Analysis: Compare the distributions of SAT (mean, prevalence of high SAT) at Year 10 between simulated scenarios (with tax vs. without tax). Calculate population attributable fraction and estimate reduction in incidence of SAT-related type 2 diabetes using risk ratios from literature.
- Scenario Analysis: Run simulations under different tax rates or complementary interventions (e.g., education campaign).
4. DIAGRAMS
Title: MC Workflow for Drug Efficacy Trial Simulation
Title: Causal Pathway for Population Health Intervention Model
5. THE SCIENTIST'S TOOLKIT: RESEARCH REAGENT SOLUTIONS
Table 3: Essential Materials for MC Simulations in Subcutaneous Fat Research
| Item | Function & Application |
|---|---|
| High-Performance Computing (HPC) Cluster | Enables execution of thousands to millions of stochastic simulations in parallel, reducing computation time from weeks to hours. Essential for both trial and population models. |
| PK/PD Modeling Software (NONMEM, Monolix) | Industry-standard for developing complex pharmacometric models. Critical for defining the biological system in drug efficacy simulations. |
| Microsimulation Platform (HALEY, TreeAge) | Specialized software for modeling individual life-courses, health states, and interactions. Foundational for population health studies. |
| Biostatistical Software (R, Python with NumPy/SciPy) | For data wrangling, statistical analysis of simulation outputs, and creating custom simulation scripts. Ubiquitous across both applications. |
| Reference Anatomical & Kinetic Data | High-quality MRI-derived SAT volumes and tracer kinetic studies inform realistic compartment sizes and transfer rates in PK/PD models. |
| Epidemiological Cohort Datasets | Large, longitudinal datasets (e.g., UK Biobank, Framingham) provide real-world parameter distributions and validation benchmarks for population models. |
| Uncertainty Quantification Libraries (e.g., Chaospy, SALib) | Python/R libraries for designing sensitivity analyses and quantifying uncertainty in model outputs, crucial for robust conclusions. |
Conclusion
Monte Carlo simulation remains an indispensable, physics-based tool for advancing subcutaneous fat measurement, offering unparalleled insight into the complex interaction between probing energy and heterogeneous adipose tissue. Mastering its application—from robust foundational modeling and meticulous methodological execution to systematic troubleshooting and rigorous validation—empowers researchers to develop more accurate, reliable, and interpretable non-invasive assessment tools. Future directions point toward the integration of patient-specific digital twins, coupling with machine learning for inverse problem solving, and real-time simulation enabled by GPU acceleration. These advancements will further solidify the role of Monte Carlo methods in personalized metabolic phenotyping, precision medicine, and accelerating the development of next-generation therapeutics for obesity and metabolic disorders.