Mastering Magnesium: The Complete Guide to Optimizing Mg2+ Concentration in PCR and RT-qPCR Master Mixes for Research and Diagnostics
This comprehensive guide details the critical role of magnesium ion (Mg2+) concentration in nucleic acid amplification master mixes.
Mastering Magnesium: The Complete Guide to Optimizing Mg2+ Concentration in PCR and RT-qPCR Master Mixes for Research and Diagnostics
Abstract
This comprehensive guide details the critical role of magnesium ion (Mg2+) concentration in nucleic acid amplification master mixes. Targeted at researchers and assay developers, it covers foundational principles of Mg2+ biochemistry in polymerase function, provides step-by-step methodologies for systematic optimization, addresses common troubleshooting scenarios, and validates best practices through comparative analysis. The article synthesizes current protocols and data to empower scientists to achieve maximum specificity, yield, and reproducibility in PCR, RT-PCR, and qPCR applications.
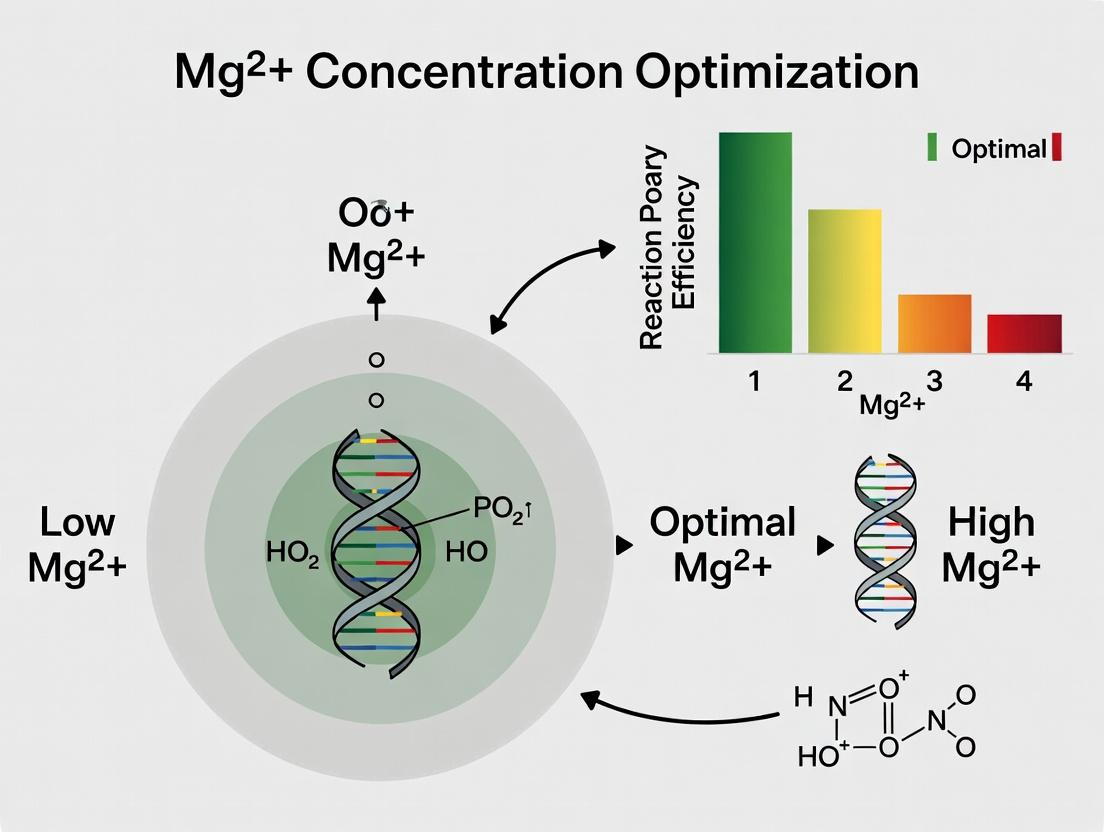
The Magnesium Mandate: Understanding the Foundational Role of Mg2+ in Nucleic Acid Amplification
Technical Support Center: Optimizing Mg2+ in Master Mixes
Troubleshooting Guides & FAQs
Q1: My PCR/qPCR reaction failed with low or no yield. What Mg2+-related issues should I investigate? A: Low Mg2+ concentration is a primary culprit. Mg2+ is essential for polymerase activity, primer-template annealing, and dNTP stabilization. Insufficient Mg2+ leads to poor enzyme processivity and low product yield. Excessive Mg2+ can reduce fidelity and promote non-specific binding. Begin troubleshooting by running a Mg2+ titration from 0.5 mM to 5.0 mM in 0.5 mM increments. Ensure your master mix components, especially dNTPs and chelating agents (EDTA), are accounted for, as they directly affect free Mg2+ availability.
Q2: How do I calculate the free Mg2+ concentration in my complex reaction buffer? A: Free Mg2+ is the biologically active form, not the total added. It is sequestered by dNTPs, ATP, and EDTA. Use the following simplified calculation and verify with online calculators or the MaxChelator software.
Key Binding Constants at pH 7.0 and 0.2 M Ionic Strength:
| Ligand | Binding Constant for Mg2+ (K) |
|---|---|
| dNTP | ~ 10^4 M^-1 |
| ATP | ~ 10^4 M^-1 |
| EDTA | ~ 10^8 M^-1 |
| Pyrophosphate (PPi) | ~ 10^5 M^-1 |
Protocol: Estimation of Free [Mg2+]
- List all Mg2+-binding components in your master mix (e.g., dNTPs, ATP, EDTA).
- For each component, calculate the product: [Ligand] * K. This estimates bound Mg2+.
- A rough approximation: Free [Mg2+] ≈ Total [Mg2+] - Σ(Bound Mg2+).
- For accurate calculation, use the iterative solution in tools like MaxChelator.
Q3: My reverse transcription (RT) reaction efficiency is suboptimal. Could Mg2+ be a factor? A: Absolutely. Mg2+ is a critical cofactor for reverse transcriptase, stabilizing the enzyme-nucleic acid complex and catalyzing the polymerization reaction. Suboptimal Mg2+ can lead to truncated cDNA, low yield, and poor representation of long or structured RNA templates. For RT optimization, perform a titration between 1.0 mM and 6.0 mM Mg2+. Note that Mg2+ requirements may differ between RNA templates (e.g., GC-rich vs. structured regions).
Q4: What is the impact of Mg2+ on CRISPR-Cas9 nuclease activity in vitro? A: Mg2+ is the mandatory catalytic cofactor for Cas9's RuvC and HNH nuclease domains. It activates a water molecule for in-line nucleophilic attack on the target DNA phosphodiester bond. No Mg2+, no cleavage. The optimal concentration is typically 5-10 mM for in vitro cleavage assays. However, high fidelity (HiFi) Cas9 variants may have altered Mg2+ dependence—always refer to your specific enzyme's formulation guide.
Q5: How does Mg2+ concentration affect ligation efficiency (e.g., in cloning)? A: Mg2+ is required for T4 DNA Ligase activity, enabling the formation of a phosphodiester bond. Standard buffers contain 10 mM Mg2+. Deviation can significantly impact efficiency, especially for blunt-end or difficult ligations. If troubleshooting, ensure your insert/vector DNA is not contaminated with EDTA, which chelates Mg2+.
The Scientist's Toolkit: Research Reagent Solutions
| Reagent / Material | Function in Mg2+-Sensitive Experiments |
|---|---|
| MgCl2 or MgSO4 Stock Solutions | Source of divalent Mg2+ ions. Use high-purity, nuclease-free stocks. MgCl2 is hygroscopic; calibrate concentration periodically. |
| EDTA (Ethylenediaminetetraacetic acid) | Chelating agent used to control free Mg2+ or as a stop solution. A common contaminant from DNA purification kits that can inhibit reactions if not accounted for. |
| dNTP Mix | Substrates for DNA polymerases. Each dNTP molecule binds one Mg2+ ion to form the active substrate complex. Major competitor for free Mg2+. |
| ATP | Essential cofactor for ligases and kinases. Binds Mg2+ to form Mg-ATP, the active co-substrate. |
| High-Fidelity or Specialized Polymerase Buffers | Often supplied with an optimized Mg2+ concentration or a separate Mg2+ solution. Formulations are enzyme-specific and tuned for fidelity/processivity. |
| Mg2+ Titration Kit (Commercial) | Pre-mixed master mixes with varying [Mg2+] for rapid optimization, saving researcher preparation time. |
| Metal Ion Chelator Resin | Used to rigorously strip contaminating metals from buffers and water to establish a defined baseline before Mg2+ addition. |
Experimental Protocol: Systematic Mg2+ Optimization for PCR Master Mix
Objective: To determine the optimal free Mg2+ concentration for a specific primer-template pair and polymerase.
Materials:
- DNA template, forward/reverse primers, dNTP mix, polymerase with supplied buffer, MgCl2 stock solution (e.g., 50 mM), nuclease-free water.
Method:
- Prepare a 2X base master mix without Mg2+. Per reaction: 1X polymerase buffer (no Mg), 0.2 mM dNTPs, 0.5 µM each primer, 0.5 U polymerase, template DNA (e.g., 10-100 ng), water to volume.
- Prepare a series of 1X working solutions with varying [Mg2+]. For 8 tubes, label 0.5, 1.0, 1.5, 2.0, 2.5, 3.0, 4.0, 5.0 mM.
- To each tube, add the required volume of MgCl2 stock and nuclease-free water to create a "Mg2+ Additive Solution" that will bring the final reaction to the target concentration.
- Aliquot the 2X base master mix into each tube containing the Mg2+ Additive Solution. Mix gently.
- Run the thermal cycling protocol recommended for your polymerase.
- Analyze results via agarose gel electrophoresis (for standard PCR) or Ct value/yield analysis (for qPCR).
Interpretation: Identify the concentration yielding the highest specific product yield with minimal non-specific amplification.
Data Presentation: Mg2+ Effects on Common Biochemical Reactions
Table 1: Typical Optimal and Functional Ranges for Mg2+ as a Cofactor
| Enzymatic Reaction / Process | Typical Optimal [Mg2+] | Critical Function of Mg2+ | Consequence of Deviation |
|---|---|---|---|
| Taq DNA Polymerase (PCR) | 1.5 - 2.5 mM | Stabilizes DNA duplex; coordinates dNTPs in active site; essential for catalytic activity. | Low: Low yield, no product. High: Increased non-specific binding, reduced fidelity. |
| Reverse Transcriptase | 3.0 - 6.0 mM | Catalyzes RNA-dependent DNA synthesis; stabilizes complex with often structured RNA. | Low: Short, incomplete cDNA. High: Can increase misincorporation. |
| T4 DNA Ligase | 10 mM (standard buffer) | Activates the 5'-phosphate via adenylation and facilitates phosphodiester bond formation. | Low: Drastically reduced ligation efficiency. High: Generally tolerated but may promote non-ligase nucleic acid interactions. |
| CRISPR-Cas9 Nuclease | 5 - 10 mM | Direct catalytic cofactor in both nuclease domains; enables DNA cleavage. | Low: Abolished or severely reduced cleavage. High: May increase off-target effects in vitro. |
| Restriction Endonucleases | Varies (often 10 mM) | Often required for structural integrity and catalytic activity of the enzyme-DNA complex. | Low: Incomplete digestion. High: May lead to star activity (loss of specificity). |
Visualizations
Title: Mg2+ Catalytic Mechanism in DNA Polymerase
Title: Mg2+ Titration Experiment Workflow
Technical Support Center: Troubleshooting PCR & Master Mix Optimization
Frequently Asked Questions (FAQs)
Q1: My PCR reaction shows no product (complete failure). What should I check first regarding the core components? A: First, verify the integrity and concentration of your template DNA. Then, check primer specificity and annealing temperature. Ensure the polymerase is active and not inhibited. A common fix is to titrate Mg2+ concentration, as it is a critical cofactor for polymerase activity and affects primer annealing. Start with a gradient from 1.0 mM to 4.0 mM.
Q2: I see non-specific bands or primer-dimer artifacts. How can I adjust my reaction components to improve specificity? A: Non-specific amplification often stems from suboptimal Mg2+ concentration (too high) or excessive primer concentration. Lower Mg2+ (e.g., from 2.5 mM to 1.5 mM) can increase fidelity. Increase annealing temperature in 2°C increments. Ensure dNTP concentration is balanced (typically 200 µM each) as excess dNTPs can chelate Mg2+, effectively reducing its availability for the polymerase.
Q3: My PCR yield is low despite all controls being correct. Which component interplay is most likely the issue? A: Low yield can result from imbalanced dNTP:Mg2+ ratio. dNTPs bind Mg2+ ions; therefore, increasing total dNTP concentration without adjusting Mg2+ can deplete free Mg2+, inhibiting the polymerase. Recalculate the stoichiometry. As a rule, the Mg2+ concentration should exceed the total dNTP concentration by at least 0.5-1.0 mM. Refer to Table 1 for optimization.
Q4: How does template quality or type (genomic vs. plasmid) affect the optimal concentrations of other components? A: Complex genomic DNA may require higher polymerase stability (often influenced by Mg2+) and more cycles. For GC-rich templates, increased Mg2+ (up to 4.0 mM) or additives like DMSO may be needed. For clean plasmid templates, standard concentrations (1.5-2.0 mM Mg2+) usually suffice. Always include a positive control template.
Troubleshooting Guide: Key Issues and Solutions
| Symptom | Possible Cause (Component Interplay) | Troubleshooting Step | Related Mg2+ Optimization |
|---|---|---|---|
| No Amplification | Inactive polymerase due to insufficient free Mg2+ | Titrate MgCl2 (1.0 - 5.0 mM range). Verify dNTP concentration. | Increase Mg2+ in 0.5 mM steps. |
| Smeared Bands | Excess Mg2+ reduces enzyme fidelity; too much polymerase | Perform Mg2+ gradient PCR (1.0 - 3.0 mM). Reduce polymerase units by 25%. | Decrease Mg2+ concentration. |
| Primer-Dimer Formation | Low annealing temp; high primer concentration; excess Mg2+ | Increase annealing temperature. Optimize primer concentration (50-900 nM). | Lower Mg2+ to tighten primer binding. |
| Inconsistent Replicates | Unstable master mix due to variable Mg2+ chelation | Prepare a large, single batch of master mix. Ensure consistent thawing/mixing of dNTPs. | Use a master mix with optimized, pre-formulated Mg2+. |
Experimental Protocol: Titrating Mg2+ Concentration to Optimize Component Interplay
Objective: To determine the optimal MgCl2 concentration for a specific PCR assay by balancing the interplay of primers, dNTPs, template, and polymerase.
Materials: See "The Scientist's Toolkit" below. Protocol:
- Prepare a base master mix without MgCl2 containing:
- 1X supplied reaction buffer
- 200 µM each dNTP
- 0.2 - 0.5 µM each primer
- 0.5 - 1.25 units of DNA polymerase
- Template DNA (10 - 100 ng genomic)
- Nuclease-free water to a final volume of 24 µL per reaction.
- Aliquot 24 µL of the base master mix into each tube of an 8-tube strip.
- Prepare a MgCl2 dilution series (e.g., 10 mM, 15 mM, 20 mM, 25 mM, 30 mM, 35 mM, 40 mM, 50 mM).
- Add 1 µL of each MgCl2 solution to the individual tubes to achieve final concentrations as outlined in Table 1.
- Run PCR using a standardized thermal cycling program with an annealing temperature gradient if needed.
- Analyze products via agarose gel electrophoresis.
Table 1: Example Mg2+ Titration Matrix for a 25 µL Reaction
| Tube | [MgCl2] Stock Added | Final [Mg2+] in Reaction | Expected Effect on Components |
|---|---|---|---|
| 1 | 1 µL of 10 mM | 0.4 mM | Very low: Likely no product, polymerase inactive. |
| 2 | 1 µL of 15 mM | 0.6 mM | Low: Possible weak yield. |
| 3 | 1 µL of 20 mM | 0.8 mM | Suboptimal for most assays. |
| 4 | 1 µL of 25 mM | 1.0 mM | Lower limit for standard PCR. |
| 5 | 1 µL of 30 mM | 1.2 mM | May work for simple templates. |
| 6 | 1 µL of 35 mM | 1.4 mM | Common starting point. |
| 7 | 1 µL of 40 mM | 1.6 mM | Often optimal for many assays. |
| 8 | 1 µL of 50 mM | 2.0 mM | Higher fidelity; risk of non-specific bands if too high. |
Diagrams
The Scientist's Toolkit: Key Research Reagent Solutions
| Item | Function in Mg2+ Optimization Study |
|---|---|
| MgCl2 (25-100 mM Stock Solutions) | The variable cofactor; titrated to optimize polymerase activity, primer annealing, and reaction specificity. |
| Ultrapure dNTP Mix (100 mM) | Substrates for DNA synthesis; their concentration must be balanced with Mg2+ to prevent chelation. |
| Hot-Start DNA Polymerase | Reduces non-specific amplification at room temperature; requires optimized Mg2+ for maximum activity. |
| 10X PCR Buffer (Mg2+-Free) | Provides optimal pH and salt conditions, allowing precise, independent adjustment of Mg2+ concentration. |
| Nuclease-Free Water | Prevents degradation of reaction components and ensures no contamination with metal ions. |
| Standardized DNA Template | A control template (e.g., plasmid, genomic) of known concentration to assess PCR efficiency across Mg2+ levels. |
| DNA Gel Stain (e.g., SYBR Safe) | For visualization of PCR products to assess yield, specificity, and determine optimal conditions. |
Troubleshooting Guide & FAQs
Q1: My qPCR assay shows inconsistent Cq values and poor amplification efficiency. Could Mg2+ concentration be a factor? A: Yes, Mg2+ concentration is a critical factor. Insufficient Mg2+ can lead to weak or non-specific amplification, while excess Mg2+ can promote primer-dimer formation and increase non-specific binding. For standard Taq polymerase-based PCR, the typical starting concentration is 1.5 mM in the final reaction. We recommend performing a Mg2+ titration from 1.0 mM to 4.0 mM in 0.5 mM increments to optimize for your specific primer-template system.
Q2: During reverse transcription, I am getting low cDNA yield. How does Mg2+ in my master mix affect this? A: Mg2+ acts as a cofactor for reverse transcriptase enzymes. Suboptimal concentrations can drastically reduce enzyme processivity and yield. For M-MLV and similar enzymes, the standard starting concentration is often 3.0 mM, but this can vary. Consult your enzyme's datasheet. A common troubleshooting step is to test a range from 1.5 mM to 6.0 mM. Ensure your master mix maintains a consistent pH, as Mg2+ concentration can affect buffering capacity.
Q3: In my endpoint PCR, I see smearing or multiple bands. How can adjusting Mg2+ help? A: High Mg2+ concentrations can reduce the fidelity of DNA polymerase, leading to misincorporation and smearing. It can also stabilize nonspecific primer-template interactions. Begin optimization by reducing the Mg2+ concentration from your standard starting point in 0.25 mM decrements. Simultaneously, consider increasing the annealing temperature. A balance between Mg2+ (typically 1.0 - 2.5 mM) and stringent thermal cycling often resolves smearing.
Q4: My isothermal amplification assay (e.g., LAMP) failed. Is Mg2+ optimization different for these assays? A: Absolutely. Isothermal assays like LAMP or RPA are highly sensitive to Mg2+ levels, as Mg2+ is involved in strand displacement and polymerase activity. Required concentrations are generally higher than for PCR. For LAMP, a typical starting point is 4-8 mM. Failure often requires a broad titration (e.g., 2 mM to 10 mM). Note that Mg2+ is often supplied as part of the master mix from commercial vendors, and supplemental addition may be necessary.
Q5: How do I account for Mg2+ contributed by my DNA template (e.g., eluted in TE buffer)? A: This is a crucial detail. TE buffer contains EDTA, which chelates Mg2+ ions. Even small volumes can significantly deplete the free Mg2+ available for your enzyme. If your template is in TE, we recommend: 1) Precipitating and resuspending DNA in nuclease-free water or the provided resuspension buffer, or 2) Accounting for the chelation by performing a pilot Mg2+ titration where the template volume is constant, increasing the Mg2+ in the master mix to compensate. Always include a no-template control.
Table 1: Typical Mg2+ Starting Points for Common Assays
| Assay Type | Typical Starting [Mg2+] (mM) | Optimization Range (mM) | Primary Function of Mg2+ |
|---|---|---|---|
| Standard Taq PCR | 1.5 | 1.0 - 4.0 | Polymerase cofactor, stabilizes dNTPs |
| High-Fidelity PCR | 2.0 | 1.5 - 3.0 | Polymerase cofactor |
| Reverse Transcription | 3.0* | 1.5 - 6.0 | Reverse Transcriptase cofactor |
| LAMP | 6.0 | 4.0 - 10.0 | Polymerase & strand displacement cofactor |
| RPA | 14.0 | (Vendor defined) | Polymerase & recombinase cofactor |
| DNA Ligase Reactions | 1.0 | 0.5 - 2.0 | Enzyme cofactor |
Varies significantly by enzyme (M-MLV vs. Superscript IV). *Typically supplied in proprietary mix.
Table 2: Troubleshooting Mg2+ Effects
| Symptom | Possible Mg2+ Cause | Suggested Action |
|---|---|---|
| No Amplification | Concentration too low | Titrate upward from starting point |
| Smearing/Multiple Bands | Concentration too high | Titrate downward; increase annealing temp |
| High Cq/Low Yield | Suboptimal for enzyme/assay | Perform full titration curve |
| Primer-Dimer Artifacts | Concentration too high | Titrate downward; re-design primers |
Experimental Protocols
Protocol 1: Mg2+ Titration for PCR Optimization Objective: To determine the optimal MgCl2 concentration for a specific primer-template pair. Materials: See "The Scientist's Toolkit" below. Method:
- Prepare a 2X concentrated master mix containing all components except MgCl2 and template. Include buffer, dNTPs, primers, polymerase, and water.
- Prepare a stock solution of MgCl2 at a concentration that allows you to add an equal volume to each master mix aliquot to achieve the desired final range (e.g., for a final 25µL reaction, prepare MgCl2 stocks to add 5µL).
- Aliquot the master mix into separate tubes. Add varying volumes/concentrations of the MgCl2 stock to create a series of reactions with final Mg2+ concentrations (e.g., 1.0, 1.5, 2.0, 2.5, 3.0, 3.5, 4.0 mM).
- Add an equal amount of template DNA to each tube.
- Run the PCR using standard or gradient cycling conditions.
- Analyze products via gel electrophoresis or qPCR melt curve analysis to identify the concentration giving the strongest specific product with minimal artifacts.
Protocol 2: Accounting for Chelating Agents in Template Objective: To ensure free Mg2+ concentration is not depleted by EDTA in template storage buffers. Method:
- Control Reaction: Set up a standard reaction using template resuspended in nuclease-free water.
- Test Reactions: Set up identical reactions, but replace the water-diluted template with an equimolar amount of template eluted in TE buffer (e.g., 1mM EDTA).
- Compensation Series: To the test reactions, add incremental increases of MgCl2 (e.g., +0.5 mM, +1.0 mM, +1.5 mM to the final concentration).
- Run all reactions simultaneously.
- Compare yields. The additional Mg2+ required in the test reactions to match the control yield indicates the amount needed to overcome chelation.
Visualizations
Title: Mg2+ Concentration Optimization Workflow
Title: Key Roles of Mg2+ in PCR
The Scientist's Toolkit
Table 3: Essential Research Reagent Solutions for Mg2+ Optimization
| Reagent/Material | Function in Optimization | Key Consideration |
|---|---|---|
| MgCl2 Stock Solutions (e.g., 25mM, 100mM) | Provides the titratable divalent cation source. | Use high-purity, nuclease-free stocks. Concentration must be accurately known. |
| Mg-Free 10X PCR Buffer | Provides baseline salts, buffering agents (e.g., Tris-HCl), and often KCl without Mg2+. | Essential for performing a clean titration without confounding variables. |
| dNTP Mix | Substrates for DNA synthesis. | Mg2+ stabilizes the dNTPs; keep dNTP concentration constant during titration as it affects free Mg2+. |
| High-Fidelity or Standard Taq Polymerase | The enzyme whose activity is being optimized. | Different polymerases may have different optimal Mg2+ ranges. |
| Nuclease-Free Water | Reaction diluent. | Must be free of chelating agents or contaminants that affect Mg2+ availability. |
| EDTA (0.5M, pH 8.0) | A chelating agent used in control experiments. | Can be used to deliberately quench reactions or validate Mg2+ depletion effects. |
| Template DNA in Water & TE Buffer | The target for amplification. | Allows direct testing of chelation effects from common storage buffers. |
| Agarose Gel Electrophoresis or qPCR System | Analytical tools for assessing yield and specificity. | Critical for evaluating the outcome of the titration experiment. |
Technical Support Center
Troubleshooting Guides & FAQs
FAQ 1: My PCR reaction failed to produce any amplicon. What should I check first related to Mg2+?
- Answer: This is a common symptom of insufficient Mg2+ concentration. Mg2+ is a cofactor for Taq DNA polymerase, and its absence or low concentration renders the enzyme inactive. First, verify the MgCl2 or MgSO4 stock concentration and your calculation for the master mix. Perform a Mg2+ titration experiment (see Protocol 1) across a range (e.g., 1.0 mM to 4.0 mM in 0.5 mM increments) to determine the optimal concentration for your specific primer-template system.
FAQ 2: I am observing non-specific bands (primer-dimers or spurious products) in my gel. Could Mg2+ be the cause?
- Answer: Yes, elevated Mg2+ concentration can decrease reaction specificity. Excess Mg2+ stabilizes DNA duplexes non-specifically, allowing primers to bind to mismatched sequences and increasing primer-dimer formation. To troubleshoot, systematically reduce the Mg2+ concentration in your master mix by 0.5 mM increments. Also, ensure you are using a hot-start polymerase and optimizing your thermal cycler's annealing temperature in conjunction with Mg2+ adjustment.
FAQ 3: My qPCR shows high Cq values and low yield, but the melt curve looks normal. Is this a fidelity or yield issue linked to Mg2+?
- Answer: This primarily indicates a yield (efficiency) problem. While low Mg2+ can reduce yield, normal melt curves suggest specificity is maintained. Check for PCR inhibitors carryover that may chelate Mg2+. Re-optimize Mg2+ concentration (see Protocol 1) and ensure your master mix has a sufficient buffer capacity. Note that for high-fidelity (proofreading) polymerases, Mg2+ optimum is often narrower and may require MgSO4 instead of MgCl2.
FAQ 4: I am switching from a standard Taq polymerase to a high-fidelity (proofreading) enzyme. Do I need to re-optimize Mg2+?
- Answer: Absolutely. Different DNA polymerases have distinct Mg2+ optima due to variations in their active site architecture. High-fidelity enzymes often require precise, and sometimes lower, Mg2+ concentrations for maximal activity and fidelity. Consult the manufacturer's protocol for the recommended range (typically 1.5-3.0 mM for MgSO4) and perform a titration experiment. Using the incorrect type (e.g., MgCl2 vs. MgSO4) can drastically reduce yield.
FAQ 5: How does Mg2+ concentration directly affect nucleotide incorporation fidelity?
- Answer: Mg2+ plays a direct catalytic role in the phosphoryl transfer reaction. Suboptimal concentrations (too high or too low) can alter the enzyme's kinetics and geometric constraints in the active site, increasing the likelihood of misincorporation. Excess Mg2+ can also promote non-productive binding states. For the highest fidelity, precise optimization within a narrow window (often ±0.2 mM) is critical, especially for applications like cloning or NGS library prep.
FAQ 6: My reverse transcription (RT) reaction efficiency is low. Does Mg2+ play a role here?
- Answer: Yes. Mg2+ is a critical cofactor for reverse transcriptases as well. Similar to PCR, the Mg2+ concentration in your RT master mix must be optimized. Too little Mg2+ results in low cDNA yield; too much can reduce specificity and enzyme stability. Follow the manufacturer's guidelines and consider titrating Mg2+ if you are developing a custom RT master mix.
Table 1: Effect of Mg2+ Concentration on PCR Outcomes
| [Mg2+] (mM) | Specificity (Gel Score 1-5) | Relative Yield (%) | Estimated Error Rate (10^-6) | Recommended Use Case |
|---|---|---|---|---|
| 1.0 | 5 (High) | 25 | 1.1 | High-specificity PCR, multiplex |
| 1.5 | 4 | 65 | 1.5 | Standard PCR, genotyping |
| 2.0 | 3 | 100 | 2.3 | Optimal balance (baseline) |
| 3.0 | 2 | 95 | 5.8 | Difficult templates (high GC) |
| 4.0 | 1 (Low) | 80 | 12.4 | Not recommended; high error |
| 5.0 | 1 (Low) | 40 | 25.0 | Avoid; severe non-specificity |
Table 2: Recommended Mg2+ Starting Ranges by Polymerase Type
| Polymerase Type | Typical Mg2+ Form | Recommended Starting Range | Critical Optimization Note |
|---|---|---|---|
| Standard Taq | MgCl2 | 1.5 - 2.5 mM | Broad optimum; crucial for specificity. |
| Hot-Start Taq | MgCl2 | 1.5 - 3.0 mM | Essential for low background. |
| High-Fidelity | MgSO4 | 1.5 - 2.0 mM | Narrow optimum; vital for cloning fidelity. |
| RT Enzymes (MMLV) | MgCl2 | 1.5 - 3.0 mM | Impacts first-strand cDNA yield and length. |
Experimental Protocols
Protocol 1: Standard Mg2+ Titration for PCR Master Mix Optimization
Objective: To empirically determine the optimal Mg2+ concentration for a specific primer-template pair.
Materials: See "The Scientist's Toolkit" below.
Method:
- Prepare a standard PCR master mix containing all components except MgCl2/MgSO4 and template DNA. Use the manufacturer's recommended concentrations for buffer, dNTPs, primers, and polymerase.
- Aliquot the master mix into 8 PCR tubes.
- Add MgCl2 stock solution to each tube to create a final concentration series: 0.5, 1.0, 1.5, 2.0, 2.5, 3.0, 4.0, and 5.0 mM. Keep notes.
- Add an equal amount of template DNA to each tube.
- Run the PCR using a standardized cycling program.
- Analyze the products by agarose gel electrophoresis. Assess for (a) presence/absence of the correct product, (b) intensity of the correct band (yield), and (c) presence of non-specific bands or primer-dimers.
- Select the Mg2+ concentration that provides the strongest specific product with the cleanest background.
Protocol 2: Assessing Fidelity via Cloning and Sequencing
Objective: To evaluate the impact of Mg2+ concentration on polymerase error rate.
Method:
- Perform multiple, separate PCR reactions amplifying the same target gene (≥1 kb) using Mg2+ concentrations of 1.5 mM, 2.0 mM (control), and 3.0 mM.
- Gel-purify the correct-sized amplicons from each condition.
- Clone each purified product into a blunt-end or TA cloning vector using a high-efficiency bacterial transformation.
- Pick 20-30 colonies from each transformation plate and prepare plasmid DNA.
- Sanger sequence the insert from each plasmid.
- Align sequences to the known reference sequence and count any discrepancies (mutations). Calculate the error rate per 1000 bp per condition.
- Statistically compare error rates across the Mg2+ conditions to confirm the fidelity impact.
Diagrams
Title: Mg2+ Role in PCR Polymerization
Title: Mg2+ Optimization Workflow
The Scientist's Toolkit
Table 3: Essential Reagents for Mg2+ Optimization Research
| Reagent / Material | Function in Experiment | Key Consideration |
|---|---|---|
| MgCl2 Stock (25-50 mM) | Standard Mg2+ source for most Taq polymerases. | Concentration must be verified; hygroscopic. |
| MgSO4 Stock (25-50 mM) | Required Mg2+ source for many high-fidelity polymerases. | Do not substitute with MgCl2 without validation. |
| 10X PCR Buffer (no Mg) | Provides pH, salts, and stabilizers without confounding Mg2+. | Essential for accurate titration from a known baseline. |
| Hot-Start DNA Polymerase | Reduces non-specific amplification and primer-dimer formation. | Critical for isolating the effect of Mg2+ on specificity. |
| dNTP Mix (10 mM each) | Substrates for DNA synthesis. | Keep concentration constant; ratio to Mg2+ can affect fidelity. |
| Quantitative DNA Standards | For precise yield measurement via qPCR or gel densitometry. | Allows for quantitative comparison across titration points. |
| High-Resolution Agarose | For clear visualization of specific vs. non-specific PCR products. | Use 2-4% gels for products <500 bp to see primer-dimers. |
| Cloning & Sequencing Kit | For fidelity assessment protocol (Protocol 2). | Requires high-efficiency competent cells for statistical power. |
Troubleshooting Guides & FAQs
FAQ 1: Why is my one-step RT-qPCR yielding non-specific products or high background?
- Answer: This is often due to suboptimal Mg2+ concentration. The one-step protocol combines reverse transcription (RT) and PCR in a single tube with a common buffer. The optimal Mg2+ for the polymerase may be inhibitory for the reverse transcriptase, or vice-versa. Non-specific binding increases if Mg2+ is too high. Troubleshooting: Titrate Mg2+ (from 1.5 mM to 5 mM) in your one-step master mix. Use hot-start enzymes to minimize non-specific amplification during setup.
FAQ 2: In two-step RT-qPCR, my cDNA yield seems low. What could be wrong?
- Answer: The first-strand cDNA synthesis in the two-step protocol is highly sensitive to Mg2+ concentration in the dedicated RT buffer. Insufficient Mg2+ can reduce reverse transcriptase processivity and fidelity. Troubleshooting: Ensure you are using the RT enzyme's recommended Mg2+ (or MgCl2) concentration. If optimizing, test increments of 0.5 mM around the recommended level. Verify RNA integrity and the absence of EDTA in your RNA sample, as it chelates Mg2+.
FAQ 3: When switching from a two-step to a one-step protocol, my Ct values increase significantly. Why?
- Answer: The compromise buffer in the one-step system may not be optimal for your specific target, especially if it has high GC content or secondary structure. The unified Mg2+ level might be suboptimal for the RT step of your target. Troubleshooting: Re-optimize Mg2+ and cycling conditions for the one-step system. Consider adding PCR enhancers like DMSO or betaine to the master mix to improve amplification of difficult templates.
FAQ 4: Which protocol is more suitable for high-throughput screening in drug development?
- Answer: The one-step protocol is generally preferred for high-throughput applications. It involves less pipetting steps (reducing hands-on time and contamination risk), uses smaller reaction volumes, and is easier to automate. However, validation with a two-step protocol (which often provides higher sensitivity and flexibility in primer choice) is recommended for critical low-abundance targets.
FAQ 5: How does Mg2+ concentration differentially affect one-step and two-step reactions?
- Answer: Mg2+ is a critical cofactor for both reverse transcriptase and DNA polymerase. In the two-step protocol, you can independently optimize Mg2+ for the RT reaction (Step 1) and the PCR master mix (Step 2). In the one-step protocol, a single, compromise concentration must support both enzymes, which can limit the efficiency of one or both steps.
Table 1: Protocol Comparison & Key Optimization Parameters
| Parameter | One-Step RT-qPCR | Two-Step RT-qPCR |
|---|---|---|
| Workflow | RT and PCR in single tube | RT and PCR in separate tubes |
| Hands-on Time | Lower | Higher |
| Cross-contamination Risk | Lower | Higher (during cDNA transfer) |
| Mg2+ Optimization Flexibility | Single, compromise concentration for both enzymes | Independent optimization for RT and PCR steps |
| Optimal Mg2+ Range (Typical) | 3.0 - 4.5 mM (unified) | RT Step: 2.0 - 3.0 mM; PCR Step: 2.5 - 4.0 mM |
| cDNA Archive | Not possible; product is amplicon | Possible; cDNA can be stored and used for multiple targets |
| Best For | High-throughput, single-target assays | Multiple targets from same sample, difficult RNA templates |
Table 2: Impact of Mg2+ Concentration on Reaction Efficiency (Hypothetical Data from Titration Experiment)
| Mg2+ Concentration (mM) | One-Step: Ct Value (Target Gene) | Two-Step RT Efficiency (Relative cDNA Yield) | Two-Step PCR: Ct Value (Target Gene) |
|---|---|---|---|
| 1.5 | Undetermined | 0.65 | 28.5 |
| 2.0 | 30.2 | 1.00 | 26.1 |
| 2.5 | 28.1 | 0.95 | 25.0 |
| 3.0 | 26.0 | 0.90 | 25.3 |
| 3.5 | 26.3 | 0.85 | 25.8 |
| 4.0 | 27.5 | 0.80 | 26.5 |
| 5.0 | 29.8 (Non-specific bands) | 0.70 | 28.0 (Non-specific bands) |
Experimental Protocols
Protocol 1: Optimizing Mg2+ in a One-Step RT-qPCR Master Mix Objective: Determine the optimal MgCl2 concentration for a specific one-step RT-qPCR assay.
- Prepare a 2X One-Step Reaction Buffer (without MgCl2) containing dNTPs, stabilizers, and passive reference dye.
- Prepare a 5X stock solution containing reverse transcriptase, hot-start DNA polymerase, and RNase inhibitor.
- Prepare a 10X primer/probe mix for your target and a standardized RNA template.
- Set up a series of 25 µL reactions with final MgCl2 concentrations of 1.5, 2.0, 2.5, 3.0, 3.5, 4.0, and 5.0 mM.
- Run the RT-qPCR program: 50°C for 15 min (RT), 95°C for 2 min (polymerase activation), then 40 cycles of 95°C for 15 sec and 60°C for 1 min (acquire fluorescence).
- Analyze amplification curves and Ct values. Plot Ct vs. [Mg2+]. The concentration yielding the lowest Ct with a clean amplification curve is optimal.
Protocol 2: Independent Mg2+ Optimization for Two-Step RT-qPCR Part A: Optimizing RT Step
- Set up first-strand cDNA synthesis reactions with constant amounts of RNA and reverse transcriptase.
- Vary MgCl2 concentration in the RT buffer from 1.0 mM to 5.0 mM in 0.5 mM increments.
- Synthesize cDNA.
- Use a standardized, optimized qPCR master mix to amplify a reference gene from each cDNA product.
- The RT Mg2+ condition producing the lowest Ct (highest cDNA yield) is optimal.
Part B: Optimizing PCR Step
- Using cDNA synthesized at the optimal RT Mg2+, set up qPCR reactions with a standard hot-start polymerase.
- Vary MgCl2 in the PCR buffer from 1.5 mM to 5.0 mM.
- Run the qPCR program.
- The concentration yielding the lowest Ct, highest amplification efficiency (from a standard curve), and no non-specific products is optimal.
Visualizations
Title: RT-qPCR Protocol Decision Pathway
Title: Mg2+ Role in One-Step vs Two-Step
The Scientist's Toolkit: Research Reagent Solutions
Table 3: Essential Reagents for RT-qPCR Optimization
| Reagent / Material | Primary Function in Optimization | Key Consideration |
|---|---|---|
| MgCl2 or MgSO4 Stock Solutions | To titrate the divalent cation concentration, the critical cofactor for both RT and PCR enzymes. | Use high-purity, nuclease-free stocks. Concentration must be precisely verified. |
| One-Step RT-qPCR Master Mix | Provides a unified buffer, enzymes, dNTPs for combined reaction. | Select mixes designed for your instrument. Hot-start polymerase is recommended. |
| Two-Step System: Separate RT & qPCR Mixes | Allows independent buffer/enzyme systems for each step. | Enables use of specialized reverse transcriptases (e.g., for long transcripts or high GC content). |
| RNase-Free Water | Solvent for all reactions and dilutions. | Essential for preventing RNA degradation and avoiding contamination. |
| Standardized RNA Template / External RNA Controls | Provides a consistent, high-quality template for optimization experiments. | Crucial for generating reproducible titration data (e.g., Table 2). |
| Primers & Probes (Assay Design) | Target-specific oligonucleotides for amplification and detection. | Design according to MIQE guidelines. Avoid primer-dimer formation and secondary structure. |
| PCR Enhancers (DMSO, Betaine) | Assist in denaturing difficult templates (high GC, secondary structure). | May be required for specific targets. Must be re-titrated when changing Mg2+. |
Systematic Optimization: A Step-by-Step Method for Determining Ideal Mg2+ Concentration
Troubleshooting Guides & FAQs
Q1: During my Mg2+ titration, I see no amplification in any reaction, including the positive control. What could be wrong? A1: This indicates a complete reaction failure. First, check your thermocycler's block calibration. Then, verify the integrity of your core reagents: ensure the polymerase is active by a standalone activity assay, confirm the dNTPs are not degraded (check pH), and ensure the template DNA is of high quality and concentration. A common oversight is using nuclease-contaminated water; always use molecular biology grade, DEPC-treated water.
Q2: My titration curve shows non-specific amplification (multiple bands on a gel) at higher Mg2+ concentrations. How can I resolve this? A2: Elevated Mg2+ can reduce polymerase fidelity and stabilize primer-dimer formation. First, optimize the annealing temperature of your PCR protocol using a gradient cycler. If the issue persists, consider using a hot-start polymerase to minimize non-specific extension during setup. You may also need to re-design primers with stricter attention to minimizing self-complementarity and secondary structure.
Q3: The fluorescence signal (if using qPCR) in my titration series is inconsistent and shows high replicate variability. What steps should I take? A3: High variability often points to pipetting error of small volumes. Ensure you are using calibrated pipettes and tips designed for high accuracy with viscous solutions like master mixes. Prepare a bulk master mix for the reaction components excluding Mg2+, then aliquot it before adding the variable MgCl2 component. This minimizes premix variability. Also, ensure the MgCl2 stock solution is thoroughly mixed and homogeneous before use.
Q4: My negative control shows amplification after several cycles. What does this mean and how do I address it? A4: Amplification in the no-template control (NTC) indicates contamination, most commonly with amplicon (PCR product) or plasmid DNA. You must decontaminate your workspace with UV light and bleach. Prepare fresh buffers and aliquots of all reagents. Use dedicated equipment and pipettes for pre- and post-PCR work. Include a UDG (uracil-DNA glycosylase) system in your master mix to combat carryover contamination in future runs.
Q5: How do I determine if the optimal Mg2+ concentration is truly the best, or if I need to co-optimize another factor? A5: The optimal Mg2+ point from a one-dimensional titration can be a local optimum. To confirm robustness, perform a two-factor optimization around the identified optimum. A common approach is to create a matrix testing your optimal Mg2+ concentration ± 0.5 mM against a range of annealing temperatures (± 3°C). This can reveal a broader, more reliable sweet spot for your assay.
Key Experimental Protocols
Protocol 1: Standard Mg2+ Titration Series for PCR Optimization
- Prepare 10x MgCl2 Stock Solutions: Create a series of MgCl2 solutions (e.g., 15 mM, 20 mM, 25 mM, 30 mM, 35 mM, 40 mM) in nuclease-free water. Filter sterilize.
- Formulate Base Master Mix (without Mg2+): For N reactions + 10% excess, combine in order:
- Nuclease-free water: (Variable volume)
- 10x PCR Buffer (Mg-free): N x 2.5 µL
- dNTP Mix (10 mM each): N x 0.5 µL
- Forward Primer (10 µM): N x 0.75 µL
- Reverse Primer (10 µM): N x 0.75 µL
- DNA Polymerase (5 U/µL): N x 0.2 µL Mix gently and spin down.
- Aliquot and Add Mg2+: Aliquot 24 µL of the base master mix into each PCR tube. Add 1 µL of the respective 10x MgCl2 stock solution to each tube to achieve final concentrations (e.g., 1.5, 2.0, 2.5, 3.0, 3.5, 4.0 mM).
- Add Template: Add 1 µL of template DNA (e.g., 10 ng genomic DNA) to all tubes except the NTC. Add 1 µL of nuclease-free water to the NTC tube.
- Run PCR: Use your standard thermal cycling program, starting with an initial denaturation of 98°C for 30 seconds.
- Analysis: Analyze products by agarose gel electrophoresis or qPCR analysis to determine the concentration yielding the highest yield/specificity and lowest Cq.
Protocol 2: No-Template Control (NTC) and Positive Control Setup
- NTC: Includes every component of the reaction except the target DNA template, which is replaced with an equal volume of nuclease-free water. It must be included in every run to detect contamination.
- Positive Control: Uses a known, high-quality template that has previously amplified successfully under similar conditions. It validates that the entire reaction system is functioning correctly. It should use a standardized, mid-range Mg2+ concentration (e.g., 2.5 mM) from your initial tests.
Data Presentation
Table 1: Example Results from a Mg2+ Titration Experiment for a 500 bp Amplicon
| Final [Mg2+] (mM) | Gel Band Intensity (0-5) | Specificity (1=Low, 5=High) | qPCR Mean Cq | qPCR Efficiency (%) | Notes |
|---|---|---|---|---|---|
| 1.5 | 0 | - | No Cq | - | No amplification |
| 2.0 | 2 | 4 | 28.5 | 89 | Faint specific band |
| 2.5 | 5 | 5 | 24.1 | 99.5 | Optimal: Strong, specific |
| 3.0 | 4 | 3 | 24.8 | 95 | Additional faint non-specific bands |
| 3.5 | 3 | 2 | 25.5 | 102 | Pronounced primer-dimer |
| 4.0 | 1 | 1 | 27.1 | 110 | High background, low yield |
The Scientist's Toolkit: Research Reagent Solutions
Table 2: Essential Materials for Mg2+ Optimization Studies
| Item | Function & Rationale |
|---|---|
| Mg-free 10x PCR Buffer | Provides the core reaction environment (pH, salts) without the variable ion, allowing precise Mg2+ titration. |
| Ultra-Pure MgCl2 Stock (1M) | Standardized, nuclease-free stock for preparing accurate titration dilutions. Minimizes contamination risk. |
| Hot-Start DNA Polymerase | Reduces non-specific amplification and primer-dimer formation during reaction setup, giving cleaner titration results. |
| Molecular Biology Grade Water | Nuclease-free, DEPC-treated water to prevent degradation of reaction components. |
| dNTP Mix (10 mM each) | Balanced equimolar solution of nucleotides; concentration impacts free Mg2+ availability. |
| Validated Primer Pair | Primers with minimal secondary structure are less sensitive to Mg2+ fluctuations, yielding clearer optimization data. |
| Quantitative DNA Standard | For qPCR-based titrations, a serial dilution of known copy number is essential for calculating amplification efficiency. |
Experimental Workflow & Pathway Visualizations
Title: Mg2+ Optimization Experimental Workflow
Title: Mg2+ Role in PCR Reaction Dynamics
Technical Support Center
Troubleshooting Guides
Issue 1: No Amplification or Very Faint Bands Across All Titration Points
- Potential Cause: Mg²⁺ is not the limiting factor. Primary issues may be with template quality, primer integrity, or thermocycler block calibration.
- Solution: Run a positive control reaction with a previously validated Mg²⁺ concentration (e.g., 1.5 mM). Verify template concentration via spectrophotometry and check primer aliquots for degradation.
Issue 2: Smearing or Non-Specific Bands at Higher Mg²⁺ Concentrations (e.g., >3.0 mM)
- Potential Cause: Excess Mg²⁺ reduces primer-stringency and stabilizes non-specific primer-template interactions, enabling mis-priming.
- Solution: Optimize annealing temperature upward by 2-5°C for reactions at high Mg²⁺. Consider using a hot-start polymerase to suppress activity during setup.
Issue 3: Inconsistent Replicate Results Within the Same Mg²⁺ Concentration
- Potential Cause: Inaccurate pipetting of the concentrated MgCl₂ stock solution or incomplete mixing of the master mix.
- Solution: Always prepare a master mix for all reactions at a given concentration. Vortex the MgCl₂ stock briefly before use and mix the master mix thoroughly after adding Mg²⁺. Use calibrated pipettes for small volumes.
Issue 4: Reduced PCR Product Yield at the Lowest Mg²⁺ Concentrations (e.g., 0.5 mM)
- Potential Cause: Insufficient Mg²⁺ to stabilize the DNA polymerase activity or the dNTP- Mg²⁺ complex.
- Solution: Confirm the calculated amount of free Mg²⁺, accounting for chelation by dNTPs and EDTA (if present in buffer). Titrate in finer increments (e.g., 0.2 mM steps) between 0.5 and 1.5 mM.
FAQs
Q1: Why is Mg²⁺ concentration so critical for PCR optimization? A1: Mg²⁺ is an essential cofactor for DNA polymerase activity. It stabilizes the double-stranded DNA structure, facilitates primer binding, and forms soluble complexes with dNTPs for incorporation. Both insufficient and excess Mg²⁺ can drastically reduce yield, specificity, and fidelity.
Q2: Should I use MgCl₂ or MgSO₄ for titration? A2: MgCl₂ is the standard and recommended source for most Taq and related polymerases. MgSO₄ is sometimes specified for certain engineered polymerases (e.g., some high-fidelity blends). Always refer to the polymerase manufacturer's instructions.
Q3: How do I calculate the final Mg²⁺ concentration in my reaction? A3: The final concentration is based on the total reaction volume. For example, to achieve a 1.5 mM final [Mg²⁺] in a 50 µL reaction, you need to add (1.5 mmol/L * 0.00005 L) = 0.075 µmol of Mg²⁺. If your stock is 25 mM MgCl₂, add (0.075 µmol / 25 mmol/L) = 3 µL.
Q4: How does Mg²⁺ concentration relate to annealing temperature optimization? A4: They are interconnected. Higher Mg²⁺ stabilizes hydrogen bonds, effectively lowering the Tm of primer-template duplexes. Therefore, an optimized protocol may require a slightly higher annealing temperature when using a higher Mg²⁺ concentration to maintain specificity.
Q5: What is a typical starting range for Mg²⁺ titration in a standard PCR? A5: While the optimal range depends on the primer-template system, a broad titration from 0.5 mM to 5.0 mM in 0.5 mM increments is a standard empirical approach. Most routine PCRs yield optimal results between 1.0 and 3.0 mM.
Data Presentation: Mg²⁺ Titration Effects on PCR Output
Table 1: Qualitative Analysis of PCR Products Across Mg²⁺ Concentration Gradient
| Final [Mg²⁺] (mM) | Product Yield | Band Specificity | Common Observations |
|---|---|---|---|
| 0.5 - 1.0 | Low to Moderate | High | Clean, specific bands but may have low yield. |
| 1.5 - 2.5 | High | High | Optimal window for most applications. |
| 3.0 - 4.0 | High | Moderate | Increased risk of non-specific bands/smearing. |
| 4.5 - 5.0 | Variable | Low | Heavy smearing, primer-dimer formation likely. |
Table 2: Quantitative Metrics from a Model PCR Optimization Experiment Based on a 500 bp amplicon, using standard Taq polymerase.
| [Mg²⁺] (mM) | Band Intensity (Relative Units) | Δ Yield vs 1.5mM Control | Recommended Action |
|---|---|---|---|
| 0.5 | 15 | -85% | Increase [Mg²⁺] |
| 1.0 | 65 | -35% | Near optimal; fine-tune |
| 1.5 | 100 (Control) | 0% | Optimal for this system |
| 2.0 | 105 | +5% | Optimal for this system |
| 2.5 | 95 | -5% | Optimal for this system |
| 3.0 | 80 | -20% | Increase annealing temp |
| 4.0 | 40* | -60% | Reduce [Mg²⁺]; re-optimize |
| 5.0 | 10* | -90% | Reduce [Mg²⁺]; re-optimize |
*Signal includes non-specific background.
Experimental Protocol: Mg²⁺ Titration in Standard PCR
Objective: To empirically determine the optimal MgCl₂ concentration for a specific primer-template pair in a standard PCR.
Materials: See "The Scientist's Toolkit" below.
Methodology:
- Master Mix Preparation (Without Mg²⁺): For n reactions (including a positive control and negative control), combine in a sterile tube:
- (n x 10.0 µL) of 5X Colorless GoTaq Reaction Buffer (final 1X).
- (n x 1.0 µL) of 10 mM dNTP Mix (final 200 µM each).
- (n x 1.0 µL) of Forward Primer (10 µM stock, final 0.2 µM).
- (n x 1.0 µL) of Reverse Primer (10 µM stock, final 0.2 µM).
- (n x 0.25 µL) of GoTaq DNA Polymerase (5 U/µL, final 1.25 U/50µL rxn).
- (n x X µL) of Nuclease-Free Water to bring volume to (n x (36.75 - MgCl₂ Volume)) µL.
- Mix thoroughly by vortexing and brief centrifugation.
Aliquoting and Mg²⁺ Addition: Aliquot 36.75 µL of the master mix into each of eight labeled PCR tubes. To each tube, add a specific volume of 25 mM MgCl₂ stock solution as per the table below to create the titration series. Add template DNA to all tubes except the negative control. Finally, adjust each reaction to a final volume of 50 µL with Nuclease-Free Water.
Mg²⁺ Titration Setup Table (50 µL Reaction):
Tube Desired Final [Mg²⁺] (mM) Vol. of 25 mM MgCl₂ Stock (µL) Vol. of Template DNA (µL)* Vol. of Nuclease-Free Water (µL) 1 0.5 1.0 1.0 11.25 2 1.0 2.0 1.0 10.25 3 1.5 3.0 1.0 9.25 4 2.0 4.0 1.0 8.25 5 2.5 5.0 1.0 7.25 6 3.0 6.0 1.0 6.25 7 4.0 8.0 1.0 4.25 8 5.0 10.0 1.0 2.25 PC 1.5 3.0 1.0 9.25 NC* 1.5 3.0 0.0 10.25 *Assume 1.0 µL of template; adjust volumes if different. Positive Control. *Negative Control (No Template).
PCR Cycling: Place tubes in a thermocycler and run the following standard protocol:
- Initial Denaturation: 95°C for 2 minutes.
- Amplification (30-35 cycles):
- Denature: 95°C for 30 seconds.
- Anneal: Tm-5°C for 30 seconds. (Optimize temperature based on results)
- Extend: 72°C for 1 minute per kb.
- Final Extension: 72°C for 5 minutes.
- Hold: 4°C.
Analysis: Analyze 5-10 µL of each reaction by agarose gel electrophoresis (1-2% gel) alongside a DNA ladder. Visualize under UV light and compare yield and specificity across the Mg²⁺ gradient.
Visualizations
Diagram Title: Mg²⁺ Titration Experimental Workflow
Diagram Title: Mg²⁺ Roles and Optimization Logic in PCR
The Scientist's Toolkit: Key Research Reagent Solutions
| Item | Function in Mg²⁺ Titration Experiment |
|---|---|
| 25 mM MgCl₂ Stock Solution | The titrant; provides the divalent magnesium cations essential for reaction. A concentrated, sterile, nuclease-free stock is required for accurate pipetting. |
| 5X Colorless Reaction Buffer (Mg²⁺-Free) | Provides the optimal pH, ionic strength, and stabilizing agents for the polymerase without introducing a fixed Mg²⁺ concentration, allowing free manipulation. |
| GoTaq DNA Polymerase | A standard, recombinant Taq polymerase. Its activity is directly dependent on Mg²⁺ concentration, making it a model enzyme for this optimization. |
| dNTP Mix (10 mM each) | The nucleotide substrates. They chelate Mg²⁺, reducing the concentration of free Mg²⁺ available to the polymerase. This interaction is central to optimization. |
| Target-Specific Primers | Define the amplicon. Their annealing efficiency and stringency are modulated by Mg²⁺ concentration, affecting yield and specificity. |
| Template DNA (e.g., Genomic) | The target to be amplified. Quality and concentration must be consistent across all titration points to isolate the Mg²⁺ variable. |
| Agarose & Electrophoresis Buffer | For post-PCR analysis. The gel separates products by size, allowing visual assessment of yield and specificity at each Mg²⁺ level. |
| DNA Ladder (Molecular Weight Marker) | Essential for confirming the correct size of the amplicon and identifying non-specific products in the gel analysis. |
Protocol for Mg2+ Optimization in SYBR Green and Probe-Based qPCR
This technical support center provides troubleshooting guidance for researchers optimizing Mg2+ concentration in qPCR master mixes, a critical parameter for assay performance within the broader thesis of Optimizing Mg2+ concentration in master mix research. Proper Mg2+ concentration is essential for primer annealing, polymerase activity, and probe hybridization, directly impacting specificity, efficiency, and sensitivity.
Troubleshooting Guides & FAQs
Q1: What are the primary symptoms of suboptimal Mg2+ concentration in qPCR? A: For SYBR Green assays: High background, non-specific amplification (multiple peaks in melt curve), reduced amplification efficiency (>110% or <90%), and poor reproducibility. For Probe-based assays: Increased Ct values, reduced fluorescence intensity (ΔRn), and in extreme cases, complete assay failure.
Q2: What is the typical starting range for Mg2+ optimization, and how should the titration be designed? A: Most commercial master mixes contain 1.5-4.0 mM MgCl2. A standard optimization titration should test a range from 1.0 mM to 5.0 mM in 0.5 mM increments. Prepare a stock MgCl2 solution to spike the master mix, ensuring the total reaction volume remains constant.
Q3: How does Mg2+ requirement differ between SYBR Green and probe-based assays? A: Probe-based assays often require slightly higher Mg2+ concentrations due to the need for both primer annealing and probe hybridization stability. SYBR Green assays may be more sensitive to excess Mg2+, which can promote non-specific binding and primer-dimer formation.
Q4: How do I interpret the results of a Mg2+ titration experiment to select the optimal concentration? A: Analyze the following parameters in parallel: Lowest Ct value (maximal sensitivity), Highest ΔRn or endpoint fluorescence (maximal signal), Amplification Efficiency (closest to 100%), and for SYBR Green, a single, sharp melt curve peak. The optimal concentration balances all these factors.
Q5: How do buffer composition (e.g., Tris, KCl) and primer characteristics (Tm, length) influence the optimal Mg2+ point? A: Buffer ions like K+ compete with Mg2+ for DNA backbone binding. Higher KCl may require slightly higher Mg2+. Primers with higher Tm or longer sequences may be more tolerant of lower Mg2+. Always re-optimize when changing buffer or primer sets.
Data Presentation: Key Quantitative Optimization Parameters
Table 1: Typical Effects of Mg2+ Concentration on qPCR Assay Performance
| [Mg2+] (mM) | SYBR Green Ct Value | Probe Assay Ct Value | SYBR Green Efficiency | Specificity (Melt Curve) | Probe ΔRn |
|---|---|---|---|---|---|
| 1.0 | High (Delayed) | Very High | Low (<85%) | High | Very Low |
| 2.0 | Moderate | Moderate | Good (95-105%) | High | Good |
| 3.0 (Common Default) | Optimal | Good | Optimal (100%) | High | High |
| 4.0 | Low (Early) | Optimal | Acceptable (105%) | May Decline | Optimal |
| 5.0 | Very Low | Low | Poor (>115%) | Low (Non-specific bands) | High |
Table 2: Recommended Mg2+ Optimization Titration Protocol
| Component | Stock Concentration | Volume per 25 µL Reaction (Variable) | Final Concentration Range |
|---|---|---|---|
| PCR Master Mix (Mg-free) | 2X | 12.5 µL | 1X |
| MgCl2 Solution | 50 mM | 0.5 µL - 2.5 µL | 1.0 mM - 5.0 mM |
| Forward/Reverse Primer Mix | 10 µM each | 1.0 µL | 0.4 µM each |
| Probe (if applicable) | 10 µM | 0.5 µL | 0.2 µM |
| Template DNA | Variable | Variable | As required |
| Nuclease-free H2O | To final volume | To 25 µL | - |
Experimental Protocols
Protocol 1: Mg2+ Titration for SYBR Green qPCR
- Prepare Mg2+ Stock Solutions: Dilute 50 mM MgCl2 to 10 mM in nuclease-free water.
- Set Up Reactions: In separate tubes, prepare a master mix containing SYBR Green master mix (without Mg2+), primers, template, and water. Aliquot equal volumes into 8 PCR tubes.
- Spike with Mg2+: Add the 10 mM MgCl2 stock to each tube to achieve final concentrations of 1.0, 1.5, 2.0, 2.5, 3.0, 3.5, 4.0, and 5.0 mM. Adjust water volume to keep total reaction constant (e.g., 25 µL).
- Run qPCR: Use standard cycling conditions: 95°C for 3 min, followed by 40 cycles of 95°C for 15 sec and 60°C for 1 min, followed by a melt curve stage.
- Analyze: Plot Ct and efficiency vs. [Mg2+]. Inspect melt curves for single, sharp peaks.
Protocol 2: Mg2+ Titration for Probe-Based qPCR (TaqMan)
- Follow steps 1-2 from Protocol 1, using a probe-based master mix and including the probe in the master mix.
- Spike with Mg2+: Identical titration range as Protocol 1.
- Run qPCR: Use standard cycling conditions: 50°C for 2 min (UNG incubation, if applicable), 95°C for 10 min, followed by 40 cycles of 95°C for 15 sec and 60°C for 1 min (acquire fluorescence).
- Analyze: Plot Ct and ΔRn (fluorescence intensity) vs. [Mg2+]. Select concentration yielding the lowest Ct and highest ΔRn without compromising efficiency (90-110%).
Visualizations
Title: Mg2+ Optimization Workflow for SYBR Green and Probe qPCR
Title: Biochemical Roles and Outcomes of Mg2+ in qPCR
The Scientist's Toolkit: Research Reagent Solutions
Table 3: Essential Materials for Mg2+ Optimization Experiments
| Item | Function in Optimization | Example Product/Note |
|---|---|---|
| MgCl2 Stock Solution (50-100 mM, Nuclease-free) | Precise spiking agent to adjust final [Mg2+] without diluting other components. | Molecular biology grade, certified RNase/DNase-free. |
| Mg-free qPCR Master Mix (2X) | Baseline reagent allowing full control over Mg2+ concentration. | Select a mix specifically formulated without MgCl2. |
| SYBR Green I Dye Master Mix | For intercalating dye-based optimization. Ensure dye is compatible with your instrument's filters. | Many vendors offer "Customizable" or "Mg-free" versions. |
| TaqMan Probe Master Mix | For hydrolysis probe-based optimization. | Should contain dUTP/UNG if carryover prevention is needed. |
| Standardized DNA Template | A well-quantified, high-quality template (plasmid or gDNA) for consistent optimization runs. | Use at a concentration within the assay's linear range (e.g., 10^4 copies/µL). |
| Optimized Primer/Probe Set | Primers with minimal dimerization potential and a probe with high quenching efficiency. | HPLC-purified primers, dual-quenched probes for low background. |
| Nuclease-free Water | Diluent to adjust reaction volume without introducing contaminants or altering ion concentrations. | Certified for PCR, not DEPC-treated. |
| Microtiter Plates/Sealing Films | Reaction vessels compatible with your qPCR instrument's heating block and optical system. | Use optically clear films for fluorescence detection. |
Within the context of a thesis on Optimizing Mg2+ concentration in master mix research, the accurate analysis of gel electrophoresis, melt curves, and amplification plots is critical. These techniques are fundamental for validating PCR efficiency, specificity, and yield, all of which are directly influenced by Mg2+ concentration. This technical support center provides troubleshooting guides and FAQs for researchers, scientists, and drug development professionals.
Troubleshooting Guides & FAQs
Gel Electrophoresis
Q1: Why are my PCR product bands on the gel faint or absent? A: This is a common issue in Mg2+ optimization studies. Insufficient Mg2+ can lead to poor Taq polymerase activity and low yield. Conversely, excessive Mg2+ can promote non-specific binding and reduce target amplification efficiency. Ensure your master mix Mg2+ concentration is within the tested range (e.g., 1.5 mM to 4.5 mM). Also, verify template quality and primer integrity.
Q2: What does a smear below my target band indicate? A: A smear often indicates non-specific amplification or primer-dimer formation, which can be exacerbated by suboptimal Mg2+ concentrations. High Mg2+ increases enzyme processivity but decreases fidelity. Re-optimize Mg2+ concentration and consider increasing the annealing temperature during PCR.
Melt Curve Analysis
Q3: My melt curve shows multiple peaks for a single amplicon. What does this mean? A: Multiple peaks indicate the presence of non-specific products or primer-dimers, a direct sign of poor reaction specificity. In Mg2+ optimization, this frequently occurs at concentrations that are too high. Lower the Mg2+ concentration in 0.5 mM increments. Also, ensure your primer sequences are specific and check for amplicon contamination.
Q4: The melt curve peak is broad or shallow. Is this a problem? A: Yes. A broad peak suggests heterogeneous PCR products or unstable duplex formation, which can be influenced by Mg2+ concentration. Mg2+ stabilizes the DNA double helix. A concentration too low may lead to incomplete synthesis or unstable products. Titrate Mg2+ to find the concentration that yields a single, sharp peak.
Amplification Plots (qPCR)
Q5: The amplification curves have high Cq (Ct) values and poor efficiency. A: High Cq values and low efficiency are hallmark signs of suboptimal reaction conditions. Mg2+ is a cofactor for Taq polymerase, and its concentration directly impacts enzyme kinetics. An insufficient amount will drastically reduce efficiency. Create a standard curve using serial dilutions of template at various Mg2+ concentrations (see protocol below) to calculate precise efficiency.
Q6: Why is there significant variation between technical replicates in my amplification plots? A: Inconsistent pipetting of the master mix component, especially when manually supplementing MgCl2, is a primary cause. Ensure the master mix is thoroughly mixed before aliquoting. Implementing a standardized protocol for preparing the master mix with varying Mg2+ is crucial for reproducibility.
Experimental Protocol: Mg2+ Titration for qPCR Optimization
Objective: To determine the optimal MgCl2 concentration for a specific primer-template pair.
Materials: See "Research Reagent Solutions" table.
Method:
- Prepare a 2X master mix without MgCl2. Include buffer, dNTPs, primers, Taq polymerase, and passive reference dye.
- Prepare a stock MgCl2 solution (e.g., 50 mM).
- Set up 8 PCR reactions. To each, add an equal volume of template DNA.
- Spike each reaction with MgCl2 stock to achieve final concentrations spanning 1.0 mM to 5.0 mM in 0.5 mM increments.
- Run qPCR with standard cycling conditions (e.g., 95°C for 3 min, followed by 40 cycles of 95°C for 10s and 60°C for 30s, concluding with a melt curve analysis).
- Analyze amplification efficiency (from a standard curve), yield (from endpoint fluorescence), and specificity (from melt curve) for each Mg2+ concentration.
Data Presentation
Table 1: Impact of Mg2+ Concentration on qPCR Parameters
| Mg2+ Conc. (mM) | Mean Cq Value | Amplification Efficiency (%) | Melt Curve Peak Tm (°C) | Specificity (Single Peak?) | Gel Band Intensity (1-5) |
|---|---|---|---|---|---|
| 1.5 | 28.5 | 78 | 78.2 | Yes | 2 |
| 2.0 | 25.1 | 92 | 79.0 | Yes | 4 |
| 2.5 | 24.8 | 98 | 79.1 | Yes | 5 |
| 3.0 | 24.9 | 96 | 79.0 | Yes | 5 |
| 3.5 | 25.0 | 94 | 78.9, 72.3 | No | 4 (with smear) |
| 4.0 | 24.5 | 105 | 78.5, 71.5 | No | 3 (with heavy smear) |
The Scientist's Toolkit: Research Reagent Solutions
Table 2: Essential Materials for Mg2+ Optimization Experiments
| Item | Function in Experiment |
|---|---|
| Hot-Start Taq DNA Polymerase | Reduces non-specific amplification during reaction setup; critical for assessing Mg2+'s true effect on specificity. |
| MgCl2 Stock Solution (50 mM) | The variable component for titration; must be nuclease-free and accurately quantified. |
| dNTP Mix | Substrates for DNA synthesis; concentration must be balanced with Mg2+, as Mg2+ binds dNTPs. |
| SYBR Green I Dye | Intercalating dye for qPCR and melt curve analysis; binds double-stranded DNA. |
| Low EDTA TE Buffer | For template/primer dilution; EDTA chelates Mg2+, so its concentration must be minimal. |
| Optical Grade Plate & Seals | Ensure consistent thermal conductivity and prevent evaporation during cycling. |
| DNA Molecular Weight Marker | Essential for gel electrophoresis to confirm amplicon size and assess non-specific products. |
| qPCR Standard Curve Template | A serial dilution of known template copy number for calculating precise PCR efficiency at each Mg2+ level. |
Visualizations
Title: Mg2+ Optimization Experimental Workflow
Title: Mg2+ Effect on PCR Outcomes & Diagnosis
Troubleshooting Guides & FAQs
Q1: Our SNP genotyping assay for a high GC region shows late or no amplification. What is the most common primary adjustment? A: The most common and effective primary adjustment is optimizing the MgCl₂ concentration in the master mix. Mg²⁺ is a critical cofactor for DNA polymerase, and its optimal concentration is highly dependent on template GC content and assay design. For high-GC targets, increasing MgCl₂ concentration (e.g., from a standard 1.5 mM to 2.0-3.5 mM) can stabilize DNA duplexes and improve polymerase processivity.
Q2: Beyond Mg²⁺, what other master mix components should be evaluated for a stubborn assay? A: Consider the following adjustments in tandem with Mg²⁺ optimization:
- Polymerase Type: Use a hot-start, high-fidelity polymerase engineered for robust amplification through secondary structures.
- Co-Solvents: Additives like DMSO (1-5%), betaine (0.5-1.5 M), or formamide (1-3%) can help denature stable GC-rich templates and reduce non-specific binding.
- dNTP Ratio: For some SNP assays, adjusting the dGTP/dCTP balance or using 7-deaza-dGTP can reduce secondary structure formation.
Q3: How do I systematically test Mg²⁺ concentrations? A: Follow this protocol:
Experimental Protocol: MgCl₂ Titration for Assay Optimization
- Prepare Stock: Obtain a separate tube of 25 mM or 50 mM MgCl₂ solution.
- Master Mix Formulation: Create a base master mix containing buffer, dNTPs, primers, probes, polymerase, and water, but omit MgCl₂.
- Titration Series: Aliquot the base master mix. Spike in the separate MgCl₂ stock to create a dilution series. A standard range is 1.0 mM, 1.5 mM, 2.0 mM, 2.5 mM, 3.0 mM, and 3.5 mM final concentration.
- Run Reaction: Add template DNA to each concentration and run the qPCR or endpoint PCR protocol.
- Analysis: Compare Cq values, endpoint fluorescence (ΔRn), and amplification curve shapes. Select the concentration yielding the lowest Cq with the highest ΔRn and a clean exponential phase.
Q4: What are the key performance metrics to track when optimizing? A: Summarize your titration results in a table for clear comparison:
Table 1: Performance Metrics Across MgCl₂ Concentrations
| [MgCl₂] (mM) | Mean Cq | ΔRn (Endpoint) | Curve Shape | Specificity (Tm Analysis) | Notes |
|---|---|---|---|---|---|
| 1.0 | 35.5 | 0.15 | Poor, shallow | Single peak | Insufficient amplification |
| 1.5 | 30.2 | 0.45 | Exponential | Single peak | Standard condition |
| 2.0 | 26.8 | 1.20 | Excellent | Single peak | Optimal |
| 2.5 | 26.5 | 1.25 | Excellent | Minor primer-dimer | Excellent signal |
| 3.0 | 26.0 | 1.10 | Good | Non-specific products | Reduced specificity |
| 3.5 | 25.8 | 0.95 | Irregular | High non-specificity | Too high for assay |
Q5: The assay works but shows primer-dimer or non-specific peaks. How can I address this? A: This often occurs when Mg²⁺ is raised without other compensatory optimizations.
- Increase Annealing Temperature: Raise the temperature in 0.5-1°C increments.
- Touchdown PCR: Implement a protocol starting 3-5°C above the calculated Tm and stepping down.
- Optimize Primer/Probe Design: Verify no homopolymer runs or self-complementarity; consider locked nucleic acid (LNA) probes for enhanced specificity.
The Scientist's Toolkit: Key Research Reagent Solutions
Table 2: Essential Reagents for Optimizing Difficult PCR Assays
| Reagent | Function & Rationale for Use |
|---|---|
| MgCl₂ Stock Solution (25-50 mM) | Independent variable for titration; critical cofactor for polymerase activity and nucleic acid stability. |
| High-Fidelity Hot-Start Polymerase | Reduces non-specific amplification during setup and offers robust activity on complex templates. |
| PCR Enhancers (Betaine, DMSO) | Destabilize GC-rich secondary structures, lower DNA melting temperature, and improve yield. |
| LNA or MGB Probes | Provide higher melting temperature (Tm) and greater specificity for shorter probes, ideal for SNP discrimination. |
| 7-deaza-dGTP | Analog that reduces hydrogen bonding in GC-rich regions, minimizing polymerase pausing. |
| Ultra-Pure dNTPs | Ensure consistent nucleotide quality and concentration, preventing reaction inhibition. |
Experimental Workflow & Pathway Diagrams
Diagram 1: Assay Optimization Decision Pathway
Diagram 2: Mg²⁺ Concentration Titration Protocol
Diagram 3: Mg²⁺ Roles in PCR Biochemistry
Integrating Findings into Your Standardized Master Mix Formulation
Troubleshooting Guides & FAQs
Q1: My PCR reaction consistently shows low yield or no product after integrating a new Mg2+ concentration into my master mix. What could be the cause? A: This is a common issue when optimizing Mg2+ concentration. Mg2+ acts as a cofactor for Taq polymerase, and its concentration directly affects primer annealing and enzyme fidelity. Too little Mg2+ results in low yield due to inefficient primer binding and polymerase activity. Too much Mg2+ can lead to non-specific amplification and increased primer-dimer formation. The recommended troubleshooting steps are:
- Perform a Mg2+ titration experiment (see protocol below).
- Check the purity and concentration of your DNA template.
- Verify that your primer design is specific and has an appropriate Tm.
Q2: I am observing non-specific bands or smearing in my gel electrophoresis after standardizing my master mix. How can I address this? A: Non-specific amplification is frequently tied to excessive Mg2+ concentration, which stabilizes DNA duplexes and reduces enzyme fidelity. To resolve this:
- Re-optimize Mg2+: Slightly decrease the Mg2+ concentration in 0.25 mM increments from your current standard.
- Increase Annealing Temperature: Raise the annealing temperature in your PCR cycle by 1-2°C increments to enhance stringency.
- Use a Hot-Start Polymerase: This can prevent primer-dimer formation and non-specific extension during reaction setup.
Q3: How do I systematically determine the optimal Mg2+ concentration for a new set of primers or a new polymerase formulation? A: A standardized Mg2+ titration protocol is essential. The optimal concentration is dependent on primer sequence, template, dNTP concentration (as dNTPs chelate Mg2+), and the specific polymerase used. Follow the experimental protocol detailed below.
Experimental Protocol: Mg2+ Titration for Master Mix Optimization
Objective: To empirically determine the optimal MgCl2 concentration for a specific PCR assay prior to finalizing the standardized master mix formulation.
Materials & Reagent Solutions:
| Research Reagent Solution | Function in Experiment |
|---|---|
| 10X PCR Buffer (Mg2+-free) | Provides optimal pH, ionic strength, and stabilizers for the polymerase, without confounding Mg2+ variables. |
| MgCl2 Stock Solution (25 mM) | The titrated component; provides the essential cofactor for Taq DNA polymerase. |
| dNTP Mix (10 mM each) | Substrates for DNA synthesis; concentration must be fixed as dNTPs chelate free Mg2+. |
| Template DNA (10-100 ng/µL) | The target DNA to be amplified; concentration and purity must be consistent. |
| Forward/Reverse Primers (10 µM each) | Sequence-specific oligonucleotides that define the amplicon. |
| Hot-Start Taq DNA Polymerase (5 U/µL) | The enzyme that catalyzes DNA synthesis; hot-start minimizes non-specific amplification. |
| Nuclease-Free Water | Solvent to bring the reaction to volume; ensures no RNase/DNase contamination. |
Methodology:
- Prepare a 2X "Base Master Mix" for 10 reactions, excluding MgCl2. Per reaction: 2.5 µL 10X Mg2+-free Buffer, 0.5 µL dNTP mix (10 mM), 0.5 µL Forward Primer (10 µM), 0.5 µL Reverse Primer (10 µM), 0.2 µL Hot-Start Taq (5 U/µL), and 14.8 µL Nuclease-Free Water.
- Label eight 0.2 mL PCR tubes. To each, add 19 µL of the 2X Base Master Mix.
- Add 1 µL of MgCl2 stock solution to each tube to achieve the final concentrations outlined in Table 1.
- Add 1 µL of template DNA to each tube (final volume: 25 µL). Include a no-template control (NTC) at your standard Mg2+ concentration.
- Run the PCR using your standardized thermal cycling profile.
- Analyze the results via agarose gel electrophoresis (1.5-2.0% gel). Assess for product yield, specificity, and the absence of primer-dimers.
Table 1: Mg2+ Titration Gradient Setup & Hypothetical Results
| Tube | MgCl2 Stock Added | Final [MgCl2] in 25 µL rxn | Expected Yield (ng/µL)* | Specificity (1-5 Scale) | Recommended Action |
|---|---|---|---|---|---|
| 1 | 1 µL of 12.5 mM | 0.5 mM | 2.5 | 5 | Too low; insufficient product. |
| 2 | 1 µL of 25.0 mM | 1.0 mM | 10.1 | 5 | Low yield, but specific. |
| 3 | 1 µL of 37.5 mM | 1.5 mM | 35.5 | 5 | Optimal Zone - High yield, specific. |
| 4 | 1 µL of 50.0 mM | 2.0 mM | 38.2 | 4 | Good yield, slightly reduced specificity. |
| 5 | 1 µL of 62.5 mM | 2.5 mM | 40.0 | 3 | High yield, but non-specific bands appear. |
| 6 | 1 µL of 75.0 mM | 3.0 mM | 41.5 | 2 | High yield, significant smearing/non-specific. |
| 7 | 1 µL of 87.5 mM | 3.5 mM | 35.0 | 1 | Yield drops, poor specificity. |
| 8 | 1 µL of 100.0 mM | 4.0 mM | 15.8 | 1 | Poor yield and specificity. |
Hypothetical data from spectrophotometry. *1=Poor (smearing), 5=Excellent (single sharp band).
Visualizations
Diagram 1: Mg2+ Role in PCR Catalysis
Diagram 2: Mg2+ Optimization Workflow
Diagnosing and Solving Common Mg2+-Related Amplification Issues
Troubleshooting Guides & FAQs
Q1: What is the relationship between Mg2+ concentration and non-specific amplification in qPCR?
A1: Magnesium chloride (MgCl₂) is a critical cofactor for DNA polymerase activity. An excessive concentration can reduce primer specificity, leading to non-specific band formation and primer-dimer artifacts. This occurs because higher Mg2+ stabilizes DNA duplexes, allowing primers to bind to mismatched sequences and facilitating primer-primer annealing. The optimal concentration is typically in the range of 1.5–4.0 mM and must be empirically determined for each primer set.
Q2: How do I systematically optimize Mg2+ concentration to eliminate primer-dimers?
A2: Perform a Mg2+ titration experiment.
- Protocol:
- Prepare a standard 2X qPCR master mix without MgCl₂.
- Create a series of 1X reaction tubes where the final MgCl₂ concentration varies (e.g., 1.0 mM, 1.5 mM, 2.0 mM, 2.5 mM, 3.0 mM, 3.5 mM, 4.0 mM). Use a stock MgCl₂ solution (e.g., 25 mM or 50 mM) to spike the reactions.
- Keep all other components (primers, template, polymerase, dNTPs) constant.
- Run the qPCR protocol with a melt curve analysis.
- Analyze results: Select the lowest Mg2+ concentration that yields the lowest Cq value, highest amplification efficiency, and a single, sharp peak in the melt curve. This point minimizes non-specificity while maintaining robust signal.
Q3: Besides Mg2+ adjustment, what other steps should I consider when troubleshooting primer-dimers?
A3: Mg2+ is one parameter. A comprehensive troubleshooting approach includes:
- Primer Design: Re-evaluate primers using software. Ensure no 3' complementarity (>4 complementary bases) to prevent primer-dimer formation.
- Annealing Temperature: Increase the annealing temperature in a gradient PCR to enhance stringency.
- Hot-Start Polymerase: Use a hot-start enzyme to inhibit polymerase activity during reaction setup, preventing low-temperature mis-priming.
- Primer Concentration: Lower primer concentration (50-300 nM final) can reduce dimer formation.
Q4: How does Mg2+ concentration quantitatively affect qPCR efficiency and specificity?
A4: The impact is measurable through key performance indicators (KPIs). The table below summarizes data from a model gene amplification experiment with a problematic primer pair:
Table 1: Quantitative Impact of Mg2+ Titration on qPCR KPIs
| Final [Mg2+] (mM) | Cq Value | Amplification Efficiency | Melt Curve Peak Temperature (°C) | Specificity Score (1-5) * |
|---|---|---|---|---|
| 1.5 | 28.5 | 85% | N/A (no amplification) | 5 |
| 2.0 | 25.1 | 98% | 78.5 (single peak) | 5 |
| 2.5 | 24.8 | 102% | 78.3 (single peak) | 5 |
| 3.0 | 24.6 | 110% | 77.8 (main) & 72.1 (small) | 3 |
| 3.5 | 24.5 | 115% | 77.5 & 71.5 | 2 |
| 4.0 | 24.5 | 118% | 77.0 & 71.0 | 1 |
*Specificity Score: 5=excellent (single product), 1=poor (multiple peaks/bands).
The Scientist's Toolkit: Key Reagent Solutions
Table 2: Essential Materials for Mg2+ Optimization Experiments
| Item | Function in Optimization |
|---|---|
| MgCl₂ Solution (25-50 mM), PCR-grade | Provides the divalent cation source for precise titration without altering reaction volume significantly. |
| Mg2+-Free 2X qPCR Master Mix | Serves as a consistent base for all titration points, ensuring only Mg2+ concentration varies. |
| Hot-Start DNA Polymerase | Reduces non-specific amplification and primer-dimer artifacts during reaction setup. Critical for accurate optimization. |
| Nuclease-Free Water | Used for dilutions and as a no-template control (NTC). Must be high-quality to avoid contamination. |
| Standard DNA Template (e.g., Plasmid, gDNA) | A known, high-quality template to test optimization parameters without introducing template variability. |
| Gradient or Standard Thermal Cycler | Allows for simultaneous testing of different annealing temperatures alongside Mg2+ titration. |
Experimental Protocols
Detailed Protocol: Mg2+ Titration for qPCR Optimization
Objective: To empirically determine the optimal MgCl₂ concentration that minimizes non-specific bands and primer-dimer formation while maintaining high amplification efficiency.
Materials:
- Mg2+-Free 2X qPCR Master Mix (contains dNTPs, buffer, hot-start polymerase, stabilizers)
- Forward and Reverse Primers (100 µM stock each)
- Nuclease-free water
- MgCl₂ solution (50 mM stock)
- Template DNA
- Optical qPCR tubes/plates
- Real-Time PCR instrument
Method:
- Primer Dilution: Dilute primer stocks to a 10 µM working concentration in nuclease-free water.
- Master Mix Preparation (without Mg2+): For n reactions (+10% excess), combine in a sterile tube:
- (n x 10.0 µL) Mg2+-Free 2X Master Mix
- (n x 0.8 µL) Forward Primer (10 µM) [Final ~400 nM]
- (n x 0.8 µL) Reverse Primer (10 µM) [Final ~400 nM]
- (n x X µL) Template DNA (variable volume to achieve desired final amount)
- (n x Y µL) Nuclease-free water. (Note: Leave volume for MgCl₂ addition).
- Aliquot Master Mix: Pipette 18.0 µL of the master mix into 7 separate tubes (one for each Mg2+ concentration point).
- Spike with MgCl₂: Add 2.0 µL of the appropriate dilution of 50 mM MgCl₂ stock to each tube to achieve the final desired concentration in a 20 µL total reaction. For example:
- For 1.5 mM final: Add 2.0 µL of 7.5 mM MgCl₂ (diluted from 50 mM stock).
- For 2.0 mM final: Add 2.0 µL of 10.0 mM MgCl₂.
- For 3.0 mM final: Add 2.0 µL of 15.0 mM MgCl₂.
- (Calculate dilutions such that 2.0 µL added to 18.0 µL master mix yields the final target concentration).
- Mix and Load: Mix each tube gently, then pipette 20 µL into triplicate wells on the qPCR plate.
- Run qPCR: Use the following cycling conditions:
- Stage 1: Polymerase Activation - 95°C for 2 min.
- Stage 2: 40 Cycles of:
- Denaturation: 95°C for 15 sec.
- Annealing/Extension: 60°C for 1 min (acquire fluorescence).
- Stage 3: Melt Curve Analysis: 65°C to 95°C, increment 0.5°C/5 sec.
- Analysis: Plot Cq vs. log template amount for efficiency calculation. Examine amplification plots and melt curves. Optimal [Mg2+] is the lowest concentration providing the lowest Cq and a single, distinct melt peak.
Title: Mg2+ Optimization Workflow for qPCR Specificity
Title: Effect of Mg2+ Concentration on qPCR Outcome
Troubleshooting Guides & FAQs
Frequently Asked Questions
Q1: Why is Mg2+ concentration so critical for PCR amplification? A: Mg2+ acts as an essential cofactor for DNA polymerase activity. It stabilizes the DNA double helix, facilitates primer-template binding, and is directly involved in the catalytic reaction for nucleotide incorporation. An incorrect concentration can drastically reduce polymerase fidelity and efficiency, leading to low or no yield.
Q2: What are the typical signs of insufficient Mg2+ in a reaction? A: Primary signs include complete PCR failure (no visible band) or very faint bands on an agarose gel. Non-specific amplification (multiple bands/smearing) can also occur if the concentration is suboptimal, as it reduces polymerase fidelity.
Q3: Besides Mg2+, what are the other common culprits for low/no amplification? A: Key factors include:
- Primer Issues: Poor design, degradation, or suboptimal concentration.
- Template Quality/Degradation: Inhibitors (phenol, ethanol, salts) or degraded nucleic acids.
- Thermal Cycler Conditions: Incorrect annealing temperature or cycle number.
- Polymerase Inactivation: Denaturation from improper storage or handling.
- dNTP Concentration: Imbalanced or degraded dNTPs can chelate Mg2+ and reduce availability.
Q4: How do I systematically troubleshoot a failed PCR reaction? A: Follow a stepwise approach:
- Verify template quality and concentration.
- Check primer integrity and design (check for dimers, secondary structure).
- Perform a Mg2+ titration experiment (see protocol below).
- Optimize annealing temperature using a thermal gradient.
- Include appropriate positive and negative controls.
Q5: How does dNTP concentration interact with Mg2+ optimization?
A: dNTPs bind Mg2+ ions. Therefore, the free Mg2+ concentration, which is critical for polymerase activity, is calculated as: [Free Mg2+] = [Total Mg2+] - [dNTP] * 4. A change in dNTP concentration necessitates re-optimization of Mg2+.
Table 1: Effect of MgCl2 Concentration on PCR Yield & Fidelity
| MgCl2 Concentration (mM) | Relative Amplification Yield (%) | Band Specificity (1-5 Scale)* | Notes |
|---|---|---|---|
| 0.5 | < 5 | 5 | Very low yield, high specificity |
| 1.0 | 25 | 5 | Low yield, specific product |
| 1.5 (Standard) | 100 | 5 | Optimal for many standard reactions |
| 2.5 | 110 | 4 | High yield, minor non-specific bands |
| 3.5 | 90 | 3 | Good yield, increased smearing |
| 5.0 | 60 | 2 | Reduced yield, significant non-specificity |
*Scale: 1 (Heavy smearing/multiple bands) to 5 (Single, crisp band).
Table 2: Troubleshooting Checklist & Solution Matrix
| Symptom | Primary Suspects | Immediate Action | Confirmatory Experiment |
|---|---|---|---|
| No Band | 1. Mg2+ too low2. Template degraded3. Primer failure | Check calculations. Use fresh aliquots of all reagents. | Perform Mg2+ titration (0.5 - 5.0 mM). Run template/positive control. |
| Faint Band | 1. Suboptimal Mg2+2. Low primer/template3. Low cycle number | Increase Mg2+ in 0.5 mM increments. | Titrate Mg2+ and primer concentration (0.1 - 1.0 µM). |
| Smear/Multiple Bands | 1. Mg2+ too high2. Annealing temp too low3. Primer dimers | Decrease Mg2+. Increase annealing temperature. | Mg2+ titration + Annealing temp gradient. |
Experimental Protocols
Protocol: Mg2+ Concentration Titration for PCR Optimization
Objective: To empirically determine the optimal MgCl2 concentration for a specific primer-template pair.
Materials:
- Standard PCR master mix components (excluding MgCl2)
- Template DNA
- Forward and Reverse Primers
- MgCl2 stock solution (typically 25mM or 50mM)
- Nuclease-free water
- 0.2 mL PCR tubes or plate
Methodology:
- Prepare a base master mix for N+2 reactions, containing buffer (without Mg2+), dNTPs, primers, polymerase, template, and water.
- Aliquot equal volumes of the base master mix into 8 labeled tubes.
- Spike each tube with a calculated volume of MgCl2 stock to achieve the following final concentrations: 0.5, 1.0, 1.5, 2.0, 2.5, 3.0, 4.0, and 5.0 mM.
- Mix gently and spin down.
- Run the PCR using your standard cycling parameters.
- Analyze 5-10 µL of each product on a 1-2% agarose gel stained with ethidium bromide or a safer alternative.
- Identify the concentration that yields the strongest, most specific product.
Visualizations
Title: Troubleshooting Logic for PCR Failure
Title: Key Roles of Mg2+ in the PCR Mechanism
The Scientist's Toolkit
Table 3: Essential Research Reagent Solutions for Mg2+/PCR Optimization
| Item | Function & Importance in Optimization |
|---|---|
| MgCl2 Stock Solution (25-50 mM) | The titratable source of Mg2+ ions. Must be high-quality, nuclease-free, and accurately prepared for concentration optimization experiments. |
| Mg2+-Free PCR Buffer (10X) | Provides the optimal pH, salt, and co-factor environment without Mg2+, allowing for precise, incremental addition during titration. |
| Hot-Start DNA Polymerase | Reduces non-specific amplification and primer-dimer formation prior to the first denaturation step, simplifying the isolation of the Mg2+ effect. |
| dNTP Mix (10 mM each) | High-purity, balanced mix is critical. Degraded or imbalanced dNTPs can chelate Mg2+, altering the effective free concentration available to the polymerase. |
| Nuclease-Free Water | Used for all master mix and dilution preparations. Contaminants in water can inhibit polymerase or affect cation concentrations. |
| Positive Control Template/Primer Set | A known, robustly amplifying system used to validate reagent integrity and thermal cycler performance when troubleshooting fails. |
Technical Support Center: Troubleshooting & FAQs
Frequently Asked Questions (FAQs)
Q1: What are the primary symptoms indicating reduced fidelity in my PCR reactions? A: The key symptoms include an increased frequency of unintended mutations in the cloned product, a higher-than-expected rate of non-functional clones during downstream applications (e.g., protein expression), and sequence verification data showing point mutations, insertions, or deletions that were not in the template. This often becomes apparent only after sequencing.
Q2: How does Mg²⁺ concentration specifically affect Taq polymerase error rate? A: Mg²⁺ is a critical cofactor for DNA polymerase activity. However, its concentration must be optimized. Excess Mg²⁺ can stabilize non-complementary nucleotide binding, reducing the enzyme's ability to discriminate against incorrect dNTPs. It can also decrease the rate of primer extension, giving more time for misincorporated nucleotides to escape proofreading (even in non-proofreading enzymes like Taq). Insufficient Mg²⁺ can also be detrimental, leading to low yield but is less directly linked to fidelity errors.
Q3: I am using a high-fidelity polymerase mix, but I'm still seeing errors. Could Mg²⁺ still be the issue? A: Yes. While high-fidelity polymerases have intrinsic proofreading (3'→5' exonuclease) activity, they still require optimized Mg²⁺ for maximum fidelity. Commercial master mixes have a predetermined [Mg²⁺], which is optimized for their specific enzyme blend and buffer. If you are supplementing with additional Mg²⁺, preparing your own master mix, or using suboptimal template/buffer conditions, you can still compromise the engineered fidelity of these enzymes.
Q4: What other factors, besides Mg²⁺, should I check when troubleshooting fidelity issues? A: A systematic check should include:
- Polymerase Type: Standard Taq has higher error rates (~1 x 10⁻⁴ errors/base) than proofreading enzymes (e.g., Pfu, ~1.3 x 10⁻⁶ errors/base).
- Cycle Number: Excessive PCR cycles amplify early errors exponentially.
- Template Quality: Damaged or contaminated template.
- dNTP Quality & Balance: Degraded dNTPs or imbalanced dNTP ratios increase misincorporation.
- Thermocycling Conditions: Excessively low annealing temperatures reduce specificity.
Troubleshooting Guide
Issue: High error rate in sequenced PCR products. Step-by-Step Diagnosis:
- Verify Reagents: Use fresh, high-quality dNTPs from a single, balanced source. Confirm the polymerase is appropriate for high-fidelity needs.
- Review Protocol: Reduce the number of PCR cycles to the minimum required for sufficient yield. Ensure annealing temperatures are optimal.
- Optimize Mg²⁺ Concentration (See Experimental Protocol Below): This is often the key variable in custom mixes.
- Switch Enzyme: If steps 1-3 fail, switch to a dedicated high-fidelity polymerase master mix and follow the manufacturer's protocol exactly.
- Clone & Sequence Multiple Colonies: Sequence multiple clones from independent PCRs to distinguish PCR errors from sequencing errors or clonal mutations.
Data Presentation
Table 1: Impact of Mg²⁺ Concentration on PCR Fidelity and Yield Data derived from controlled experiments using a standard Taq polymerase and a 1kb amplicon.
| Mg²⁺ Concentration (mM) | Relative Yield (%) | Calculated Error Rate (errors/bp) | Observation |
|---|---|---|---|
| 1.0 | 15 | 2.5 x 10⁻⁵ | Very low yield, process inefficient. |
| 1.5 | 65 | 1.8 x 10⁻⁵ | Moderate yield, optimal fidelity for this enzyme. |
| 2.0 (Standard) | 100 | 1.0 x 10⁻⁴ | High yield, standard fidelity. |
| 2.5 | 110 | 3.2 x 10⁻⁴ | Very high yield, significantly reduced fidelity. |
| 3.0 | 95 | 8.7 x 10⁻⁴ | Yield declines, error rate very high. |
| 4.0 | 40 | N/D | Severe nonspecific amplification. |
Table 2: Fidelity Comparison of Common Polymerases Theoretical error rates under optimized buffer conditions (including Mg²⁺).
| Polymerase | Proofreading Activity | Typical Error Rate (errors/bp) | Optimal [Mg²⁺] Range (mM) |
|---|---|---|---|
| Standard Taq | No | ~1.0 x 10⁻⁴ | 1.5 - 2.5 |
| Hot Start Taq | No | ~1.0 x 10⁻⁴ | 1.5 - 2.5 |
| Pfu | Yes | ~1.3 x 10⁻⁶ | 1.5 - 2.0 |
| Q5 High-Fidelity | Yes | ~2.8 x 10⁻⁷ | 1.5 - 2.0 |
| Phusion High-Fidelity | Yes | ~4.4 x 10⁻⁷ | 1.5 - 2.0 |
Experimental Protocols
Protocol: Empirical Optimization of Mg²⁺ Concentration for Fidelity
Objective: To determine the MgCl₂ concentration that provides an optimal balance between yield and fidelity for a specific primer-template-enzyme system.
Materials: See "The Scientist's Toolkit" below.
Method:
- Prepare a standardized PCR master mix containing buffer (without Mg²⁺), dNTPs, primers, template (high quality, 1-10 ng), and polymerase.
- Aliquot the master mix into 8 PCR tubes.
- Add MgCl₂ stock solution to each tube to create a final concentration gradient (e.g., 1.0, 1.5, 2.0, 2.5, 3.0, 3.5, 4.0, 4.5 mM).
- Run the PCR using the recommended thermocycling protocol for your primers.
- Analyze 5 µL of each product via agarose gel electrophoresis to assess yield and specificity.
- Purify the products from the tubes showing clean, single bands.
- Clone the purified products using a blunt-end or TA-cloning kit (as appropriate for the polymerase).
- Sequence a minimum of 5-10 clones per Mg²⁺ concentration point.
- Align sequences to the known template and count mutations to calculate an empirical error rate.
Mandatory Visualizations
Title: PCR Fidelity Troubleshooting Decision Pathway
Title: Mechanism of Mg²⁺ Impact on PCR Fidelity
The Scientist's Toolkit: Research Reagent Solutions
Table 3: Essential Materials for Mg²⁺ Fidelity Optimization Experiment
| Item | Function in Experiment | Key Consideration |
|---|---|---|
| High-Purity MgCl₂ Stock Solution | To create precise concentration gradients. | Use a dedicated, nuclease-free stock. Avoid MgSO₄ unless specified for the enzyme. |
| Mg²⁺-Free PCR Buffer (10X) | Provides core reaction components (Tris, KCl, etc.) without Mg²⁺, allowing full control. | Must be compatible with your chosen polymerase. |
| Ultra-Pure, Balanced dNTP Mix | Provides equimolar substrates for polymerization. | Imbalances promote misincorporation. Use fresh, pH-neutral aliquots. |
| High-Fidelity DNA Polymerase | Enzyme with low intrinsic error rate (often with proofreading). | Critical for applications requiring perfect sequence. |
| Standard Taq Polymerase | Control enzyme for establishing baseline error rates. | Useful for comparative optimization studies. |
| TA or Blunt-End Cloning Kit | For cloning PCR products prior to sequencing to analyze errors from individual molecules. | Choose kit matching polymerase terminal overhang (A-tailed or blunt). |
| Competent E. coli (High-Efficiency) | For transformation of cloned PCR products to generate colonies for sequencing. | High efficiency increases chance of analyzing a representative clone set. |
| Sanger Sequencing Service/Kit | For final analysis of mutation frequency in cloned PCR products. | Sequence sufficient clones (n≥5) per condition for statistical relevance. |
Troubleshooting Guides & FAQs
FAQ 1: Why is my qPCR amplification inefficient or absent when using a purified nucleic acid sample?
- Answer: This is a classic sign of Mg²⁺ starvation in the master mix due to chelation. Purified nucleic acid samples are often eluted or stored in buffers containing EDTA (Ethylenediaminetetraacetic acid). EDTA is a potent chelator of divalent cations like Mg²⁺. When you add this sample to your master mix, the EDTA sequesters the free Mg²⁺, which is an essential cofactor for DNA polymerase. The effective concentration of Mg²⁺ in the reaction falls below the optimal range, leading to poor or no amplification.
- Solution: Determine the EDTA concentration in your sample buffer. Use Table 1 to calculate the additional Mg²⁺ required to neutralize the EDTA and still maintain the optimal free Mg²⁺ concentration for your polymerase. Include this excess in your master mix formulation. As a rapid test, perform a standard Mg²⁺ titration experiment spiked with your sample.
FAQ 2: My samples are in different lysis/binding buffers (e.g., from different kits). How do I standardize Mg²⁺ conditions across them?
- Answer: Different sample types (blood, tissue, cells) processed with different kits result in a variable "chelator load" entering the PCR. Common interferents include EDTA, citrate, and EGTA. This variability causes inconsistent amplification efficiencies between samples, compromising data comparability.
- Solution:
- Identify Interferents: Consult your nucleic acid purification kit manual for the composition of elution and binding buffers.
- Perform a Chelation Challenge Experiment: Spike a constant amount of your master mix (with a known Mg²⁺ concentration) with representative sample buffers. Run qPCR using a control template and compare Cq values. See Protocol 1.
- Formulate a Robust Master Mix: Based on the challenge results, add a sufficient surplus of Mg²⁺ to your master mix to overcome the highest expected chelator load from your sample set. Refer to Table 2 for chelator-Mg²⁺ binding stoichiometry.
FAQ 3: How does sample type (e.g., plasma vs. serum) affect Mg²⁺ optimization?
- Answer: Blood-derived samples are a key example. Plasma requires anticoagulants, which are frequently potent chelators (e.g., EDTA, citrate). Serum, which contains no anticoagulants, has a lower chelator burden but may contain other interfering substances. Therefore, a master mix optimized for serum may fail with plasma samples if the chelation effect is not accounted for.
- Solution: Always optimize Mg²⁺ concentration using the specific sample type (and collection tube) that will be used in the final assay. A master mix intended for universal use with blood samples must be formulated with enough supplemental Mg²⁺ to counteract the chelators in anticoagulant-treated plasma.
Experimental Protocols
Protocol 1: Chelation Challenge Test for Sample Buffers
Objective: To determine the effective chelator load of an unknown sample buffer and its impact on PCR.
- Prepare Master Mix Base: Create a standard master mix with all components (polymerase, dNTPs, salts, primers, probe) except for supplemental MgCl₂. Use the polymerase manufacturer's recommended baseline Mg²⁺ concentration (e.g., 1.5 mM final).
- Prepare Sample Buffer Spike: Dilute the sample buffer (e.g., nucleic acid elution buffer, lysis buffer) in nuclease-free water to mimic the volume/ratio it would constitute in a final PCR reaction (e.g., 5 µL in a 25 µL reaction).
- Set Up Reaction Series: For each sample buffer to test, set up a series of 8 PCR tubes. To each tube, add a constant volume of the Master Mix Base and the sample buffer spike.
- Mg²⁺ Titration: Add MgCl₂ stock solution to the series to create a final added Mg²⁺ concentration gradient (e.g., 0.0, 0.5, 1.0, 1.5, 2.0, 2.5, 3.0, 3.5 mM).
- Add Template & Complete: Add a constant amount of a positive control DNA template and water to the final volume.
- Run qPCR: Perform cycling on a real-time PCR instrument.
- Analyze: Plot Cq (or reaction efficiency) vs. Added Mg²⁺ concentration. The curve will show the optimal Mg²⁺ range in the presence of the interferent. Compare to a control series using water instead of sample buffer.
Protocol 2: Optimizing Mg²⁺ Concentration for a Heterogeneous Sample Set
Objective: To establish a single, robust master mix Mg²⁺ concentration for a set of samples processed through different methods.
- Identify Representative Samples: Select the 2-3 sample types/buffers expected to have the highest chelator load (e.g., EDTA-eluted DNA, citrate plasma RNA).
- Run Chelation Challenge: Perform Protocol 1 for each high-load buffer.
- Determine Required Surplus: From the results, identify the Mg²⁺ concentration required for each buffer to achieve 90-100% of the maximum amplification efficiency (lowest Cq).
- Formulate Universal Mix: The master mix should be prepared with a Mg²⁺ concentration equal to: Baseline Mg²⁺ + (Highest Required Surplus from Step 3).
- Validate: Test the new universal master mix on all sample types in the set, including those with low chelator load. Verify that amplification efficiency is uniform and high across all types.
Data Presentation
Table 1: Common Chelators and Their Mg²⁺ Binding Stoichiometry
| Chelator | Primary Use in Sample Prep | Binding Ratio (Chelator:Mg²⁺) | Notes |
|---|---|---|---|
| EDTA | Nucleic acid elution, plasma anticoagulant | 1:1 | High-affinity, hexadentate chelator. Most common interferent. |
| Citrate | Plasma anticoagulant, buffer component | 1:1 (for MgCitrate⁻ complex) | Common in blood collection tubes. Affinity lower than EDTA. |
| EGTA | Ca²⁺ selective chelation in lysis buffers | Weak binding to Mg²⁺ | Primarily binds Ca²⁺, but can affect Mg²⁺ at high concentrations. |
| CDTA | Alternative to EDTA in some kits | 1:1 | Similar high affinity to divalent cations as EDTA. |
Table 2: Example Calculation for Mg²⁺ Supplementation
| Sample Buffer | EDTA Concentration | Sample Volume in PCR (µL) | Total PCR Volume (µL) | EDTA Moles in Reaction | Required Mg²⁺ to Neutralize (nmol)* | Required Additional Mg²⁺ in Master Mix (mM final) |
|---|---|---|---|---|---|---|
| Elution Buffer A | 0.5 mM | 5 | 25 | 2.5 pmol | 2.5 pmol | +0.10 mM |
| Elution Buffer B | 1.0 mM | 5 | 25 | 5.0 pmol | 5.0 pmol | +0.20 mM |
*Assumes 1:1 binding. In practice, add 10-20% excess Mg²⁺ to ensure free Mg²⁺ for polymerase.
Mandatory Visualization
Diagram Title: Overcoming EDTA Interference in qPCR
Diagram Title: Workflow for Robust Mg²⁺ Optimization
The Scientist's Toolkit: Research Reagent Solutions
| Item | Function in Addressing Chelation/Interference |
|---|---|
| MgCl₂ Stock Solution (High Purity, Nuclease-Free) | Precise supplementation of Mg²⁺ concentration in master mix to overcome chelator load. |
| EDTA-Free Sample Purification Kits | Source of nucleic acids without introducing the primary chelator interferent. |
| Chelator-Specific Detection Kits (e.g., for EDTA) | Quantify chelator concentration in unknown sample buffers to guide supplementation. |
| Standardized Control Template (e.g., gBlock, Plasmid) | Essential for running chelation challenge tests and calculating PCR efficiency. |
| Mg²⁺ Titration-Ready Master Mix Bases | Commercial master mixes supplied without Mg²⁺ to allow for flexible, user-defined optimization. |
| Metal-Buffered Solutions (e.g., with Mg²⁺) | Sample storage or elution buffers that maintain a constant, known free Mg²⁺ level. |
Technical Support & Troubleshooting Center
FAQs & Troubleshooting Guides
Q1: My PCR reaction yielded no product. I used a standard 1.5 mM Mg2+ concentration. What should I adjust first? A: The lack of product suggests primer-template mismatch or suboptimal Mg2+. First, verify primer design and template quality. Then, perform a Mg2+ titration (0.5 mM to 4.0 mM in 0.5 mM increments) while keeping annealing temperature at a conservative midpoint (e.g., 55°C). Mg2+ is a critical cofactor for Taq polymerase; insufficient concentration leads to low enzyme activity, while excess can stabilize nonspecific binding and increase misincorporation.
Q2: I am getting nonspecific bands (primer-dimers) even after optimizing annealing temperature. How can Mg2+ and additives resolve this? A: Nonspecific amplification is often exacerbated by high free Mg2+. Lower Mg2+ concentration (try reducing by 0.5 mM steps) can increase primer stringency. In conjunction, introduce additives like betaine (0.8-1.2 M) or DMSO (3-10%) to destabilize secondary structures and promote specific binding. Adjust the annealing temperature upward by 1-2°C for every 0.5 mM reduction in Mg2+ to maintain specificity. The key is a balanced triad: Lower [Mg2+] + Higher Ta + Additive.
Q3: When optimizing for a high-GC template, should I increase Mg2+ or annealing temperature first? A: For high-GC templates (>65%), first incorporate a stabilizing additive like betaine (1 M final) or formamide (1-3%). Then, optimize Mg2+ within a higher range (2.0-4.0 mM), as GC-rich sequences require more Mg2+ to neutralize the phosphate backbone and facilitate polymerase processivity. Only after establishing additive and Mg2+ conditions should you fine-tune the annealing temperature, starting 3-5°C above the primer Tm.
Q4: How do I systematically test the interaction between Mg2+, temperature, and an additive like DMSO? A: Use a factorial optimization design. Prepare master mixes with three key variables: Mg2+ (e.g., 1.5, 2.5, 3.5 mM), DMSO (0%, 3%, 6%), and a gradient of annealing temperatures (e.g., 55-65°C). Run all combinations. Analyze for yield and specificity. See the recommended protocol below and the associated workflow diagram.
Q5: My qPCR shows poor amplification efficiency (below 90%). Could Mg2+ be the issue? A: Yes. In qPCR, suboptimal Mg2+ directly impacts efficiency. For SYBR Green assays, excess Mg2+ can quench fluorescence, while insufficient Mg2+ reduces yield. Titrate Mg2+ from 1.0 to 4.0 mM and calculate efficiency from the standard curve slope. The optimal concentration typically yields an efficiency between 90-105%. Remember, probe-based assays (TaqMan) may have different optimal Mg2+ ranges than SYBR Green.
Data Presentation
Table 1: Effect of Mg2+ Concentration on PCR Yield and Specificity (Standard Template)
| Mg2+ Concentration (mM) | Relative Yield (%) | Specificity (1-5 Scale)* | Recommended Annealing Temp Range |
|---|---|---|---|
| 1.0 | 45 | 5 (High) | Tm -2°C to Tm |
| 1.5 | 85 | 4 | Tm -1°C to Tm +1°C |
| 2.0 | 100 | 3 | Tm +1°C to Tm +3°C |
| 3.0 | 95 | 2 | Tm +3°C to Tm +5°C |
| 4.0 | 80 | 1 (Low) | Tm +5°C to Tm +7°C |
*1 = Multiple nonspecific bands; 5 = Single, specific band.
Table 2: Interaction of Additives with Optimal Mg2+ and Annealing Temperature Adjustments
| Additive | Optimal Conc. | Effect on Mg2+ Requirement | Typical Annealing Temp Adjustment | Best For |
|---|---|---|---|---|
| DMSO | 3-10% v/v | Allows reduction by 0.5-1 mM | Can increase by 1-3°C | GC-rich templates, secondary structure |
| Betaine | 0.8-1.2 M | May increase by 0.5-1 mM | Can decrease by 1-2°C | High-GC content, eliminates bias |
| Glycerol | 5-10% v/v | Minimal change | Can decrease by 1-3°C | Long templates, enhances polymerase stability |
| Formamide | 1-3% v/v | Allows reduction by 0.5 mM | Can increase by 1-2°C | Problematic templates with high secondary structure |
Experimental Protocols
Protocol 1: Factorial Optimization of Mg2+, Annealing Temperature, and Additives
Objective: To empirically determine the optimal combination of MgCl2 concentration, annealing temperature, and additive for a specific PCR assay.
Materials: See "The Scientist's Toolkit" below. Procedure:
- Prepare a base master mix lacking MgCl2 and the additive.
- Aliquot the base mix into 9 tubes.
- To these tubes, add MgCl2 to final concentrations of 1.5, 2.5, and 3.5 mM (three tubes per concentration).
- For each Mg2+ concentration, prepare sub-aliquots with three different concentrations of your chosen additive (e.g., DMSO at 0%, 3%, 6%).
- Add template and primers to each final mix.
- Run the PCR using a thermal cycler with a gradient function across the expected annealing temperature range (e.g., 55°C to 65°C).
- Analyze products by agarose gel electrophoresis. Score for yield (band intensity) and specificity (number of bands).
- Plot results to identify the combination giving maximum yield with a single, specific product.
Protocol 2: Mg2+ Titration for qPCR Efficiency Optimization
Objective: To determine the Mg2+ concentration that yields optimal amplification efficiency (90-105%) in a qPCR assay.
Procedure:
- Prepare a SYBR Green master mix without MgCl2.
- Prepare 7 separate reactions with MgCl2 concentrations spanning 1.0, 1.5, 2.0, 2.5, 3.0, 3.5, and 4.0 mM.
- Use a serially diluted standard template (e.g., 5-log dilution series) in each reaction.
- Run qPCR using a standard cycling protocol.
- Generate a standard curve for each Mg2+ concentration. Calculate amplification efficiency using the formula: Efficiency = [10^(-1/slope) - 1] * 100%.
- Select the Mg2+ concentration that produces an efficiency closest to 100% with the highest R² value.
Mandatory Visualizations
Title: PCR Optimization Decision Pathway
Title: Factorial Optimization Experimental Workflow
The Scientist's Toolkit: Research Reagent Solutions
| Item | Function in Mg2+/Temperature/Additive Optimization |
|---|---|
| MgCl2 Solution (25-100 mM) | The titratable source of Mg2+ ions. Critical cofactor for DNA polymerase activity, stabilizes primer-template binding, and affects duplex stability. |
| PCR Master Mix (Mg-free) | Provides core components (buffer, dNTPs, polymerase) without Mg2+, allowing for precise, user-defined Mg2+ concentration adjustment. |
| DMSO (Dimethyl Sulfoxide) | Additive that reduces secondary structure in DNA templates by lowering melting temperature. Allows for higher annealing temperatures and can reduce Mg2+ requirement for specificity. |
| Betaine (5M Stock) | Additive that equalizes the melting temperature of AT and GC base pairs, particularly beneficial for amplifying high-GC regions. Can alter optimal Mg2+ window. |
| Thermostable DNA Polymerase | Enzyme whose activity is directly dependent on Mg2+ concentration. Different polymerases (e.g., Taq, Pfu, Q5) may have distinct optimal Mg2+ ranges. |
| Gradient Thermal Cycler | Essential instrument for testing a range of annealing temperatures simultaneously across a block, enabling efficient optimization in conjunction with chemical variables. |
| Standard DNA Template & Primers | Well-characterized control amplicon system used to establish baseline optimization parameters before applying to novel, problematic targets. |
| Electrophoresis System | For post-PCR analysis of yield and specificity (banding pattern), the primary readout for optimization experiments. |
Quick-Reference Troubleshooting Flowchart for Common Problems
Frequently Asked Questions
Q1: What is the most common symptom of suboptimal Mg2+ concentration in a PCR master mix? A: Non-specific amplification (e.g., primer-dimers, multiple bands) or a complete lack of amplification (PCR failure) are the primary indicators. Insufficient Mg2+ can reduce yield, while excess Mg2+ can decrease specificity.
Q2: How does Mg2+ concentration directly affect Taq DNA polymerase activity? A: Mg2+ acts as a cofactor for Taq polymerase. It facilitates the binding of the enzyme to the DNA template and stabilizes the interaction between the enzyme and the dNTP substrates. An incorrect concentration alters polymerase fidelity and processivity.
Q3: My gel shows smearing. Could this be related to Mg2+? A: Yes. Smearing can indicate excessive Mg2+, which reduces enzyme fidelity and can promote non-specific binding and mispriming, leading to a heterogeneous mixture of DNA products.
Q4: What is a recommended starting range for Mg2+ concentration optimization? A: A standard starting range is 1.5 mM to 4.0 mM in 0.5 mM increments, with 2.0 mM being a typical baseline for many protocols. The optimal concentration is highly dependent on primer sequence, template, and buffer composition.
Q5: How do I systematically troubleshoot a failed optimization experiment? A: Follow the flowchart below and ensure controls are included: a positive control (known working template/primer), a negative control (no template), and verify reagent integrity (especially dNTPs, which compete with Mg2+).
Experimental Protocol: Mg2+ Concentration Gradient Optimization
Objective: To determine the optimal MgCl2 concentration for a specific PCR assay.
Materials:
- Template DNA
- Forward and Reverse Primers
- 10X PCR Buffer (without MgCl2)
- 25 mM MgCl2 stock solution
- dNTP Mix (10 mM each)
- Taq DNA Polymerase (5 U/µL)
- Nuclease-free water
- Thermal Cycler
- Gel Electrophoresis system
Methodology:
- Prepare a 2X Master Mix lacking only MgCl2. Calculate volumes for (n+1) reactions, where n is the number of Mg2+ conditions.
- Aliquot the master mix into n sterile microcentrifuge tubes.
- Prepare a dilution series of MgCl2 to cover the desired range (e.g., 1.0, 1.5, 2.0, 2.5, 3.0, 3.5, 4.0 mM final concentration in the reaction).
- Add the calculated volume of each MgCl2 dilution to its respective tube. Add water to bring all tubes to an equal volume.
- Add template DNA and primers to each tube. Include a no-template control (NTC).
- Run PCR using standard cycling parameters.
- Analyze products via agarose gel electrophoresis (1.5-2.0% gel). Assess for yield, specificity, and absence of primer-dimers.
Table 1: Interpretation of PCR Results Based on Mg2+ Concentration
| Final [Mg2+] (mM) | Expected Band Clarity & Yield | Common Artifacts | Recommended Action |
|---|---|---|---|
| < 1.5 | Low or no yield. Faint specific band. | None. | Increase concentration. |
| 1.5 - 2.5 | Optimal Range: High yield, single sharp band. | Minimal. | Fine-tune within this window. |
| 2.5 - 3.5 | Good yield, potential for extra bands. | Primer-dimers, minor non-specific bands. | Consider increasing annealing temperature slightly. |
| > 3.5 | High yield but diffuse/smeared products. | Significant smearing, multiple bands. | Decrease concentration. |
Signaling Pathway & Experimental Workflow
Diagram 1: Mg2+ Role in PCR Catalysis
Diagram 2: Mg2+ Optimization Troubleshooting Flowchart
The Scientist's Toolkit
Table 2: Essential Research Reagent Solutions for Mg2+ Optimization
| Reagent/Material | Function in Optimization | Key Consideration |
|---|---|---|
| MgCl2 Stock Solution (25-50 mM) | Provides the divalent cation cofactor for polymerase activity. | Use a high-purity, nuclease-free stock. Concentration must be accurately calibrated. |
| Mg2+-Free 10X PCR Buffer | Provides baseline pH, salt, and stabilizer conditions without confounding Mg2+. | Essential for creating a true gradient; avoids background Mg2+. |
| dNTP Mix (10 mM each) | Nucleotide substrates for DNA synthesis. | Competes with enzyme for Mg2+ ions; keep concentration constant (typically 0.2 mM each). |
| Hot Start Taq Polymerase | Reduces non-specific amplification at lower temperatures. | Mitigates primer-dimer formation, allowing clearer interpretation of Mg2+ effects. |
| Optimization Grade Primers | Specific sequences for target amplification. | High purity (HPLC/ PAGE purified) reduces artifacts unrelated to Mg2+. |
| DNA Ladder & Gel Stain | For accurate sizing and quantification of PCR products. | Use a high-sensitivity stain (e.g., SYBR Safe) to detect low-yield products. |
Validation Benchmarks: Comparing Commercial Master Mixes and Optimization Strategies
Technical Support Center
Troubleshooting Guides & FAQs
FAQ 1: Why is my PCR yield low or non-specific with a fixed-Mg2+ master mix?
- Answer: Fixed-Mg2+ mixes are optimized for a "typical" primer-template system. Low yield may indicate insufficient Mg2+ for your specific primers or template GC content. Non-specific bands (smearing, extra bands) often signal excessive Mg2+, reducing enzyme fidelity. To troubleshoot, validate the protocol and template quality. If issues persist, you likely require an adjustable-Mg2+ formulation to titrate the concentration.
FAQ 2: How do I optimize reactions when using an adjustable-Mg2+ master mix?
- Answer: Perform a Mg2+ titration experiment. Prepare your master mix without Mg2+. Set up a series of reactions (e.g., 5-8 tubes) and supplement with a MgCl2 or MgSO4 stock solution to create a concentration gradient, typically from 1.0 mM to 4.0 mM in 0.5 mM increments. Run the PCR and analyze the product via gel electrophoresis for yield and specificity. The optimal concentration gives a single, bright band of the correct size.
FAQ 3: Can I add extra Mg2+ to a fixed-concentration master mix?
- Answer: It is strongly discouraged. Fixed-mix formulations are precisely balanced. Adding exogenous Mg2+ disrupts the optimized buffer-enzyme equilibrium, which can destabilize the polymerase, reduce nucleotide incorporation fidelity, and alter dNTP kinetics, leading to unpredictable and often suboptimal results.
FAQ 4: My qPCR efficiency is suboptimal (>110% or <90%). Could Mg2+ be the cause?
- Answer: Yes, Mg2+ concentration directly impacts amplification efficiency. Inefficient reactions (<90%) may need more Mg2+, while over-efficient ones (>110%) often have too much, promoting non-specific binding. For SYBR Green assays, use an adjustable master mix and titrate Mg2+ as part of your assay validation. Ensure your standard curve is properly set up.
Table 1: Characteristics of Fixed vs. Adjustable Mg2+ Master Mixes
| Feature | Fixed Mg2+ Master Mix | Adjustable Mg2+ Master Mix |
|---|---|---|
| Mg2+ Concentration | Pre-optimized, fixed (e.g., 1.5 mM, 3.0 mM) | User-supplemented, variable (e.g., 0 mM in base mix) |
| Optimal Use Case | Routine, standardized assays (genotyping, screening) | Assay development, problematic templates (high GC%), multiplex PCR |
| Optimization Required | Minimal; "out-of-the-box" use | Required (titration experiment) |
| Reproducibility | High for validated assays | High post-optimization |
| Flexibility | Low | High |
| Typical Cost | Lower | Slightly Higher |
| Common Issues | Failure with suboptimal templates | User error in supplement concentration |
Table 2: Example PCR Outcomes Across Mg2+ Concentrations
| [Mg2+] (mM) | Product Yield | Specificity | Notes |
|---|---|---|---|
| 1.0 | Low/None | High | Primer annealing may be inefficient. |
| 1.5 | Moderate | High | Typical starting point. |
| 2.5 | High | High | Often optimal zone. |
| 3.5 | High | Moderate | May see minor non-specific products. |
| 4.5 | Variable | Low | Significant smearing; low fidelity. |
Experimental Protocols
Protocol: Mg2+ Titration for Optimal PCR Amplification Objective: Determine the optimal Mg2+ concentration for a novel primer set using an adjustable Mg2+ master mix. Materials: Adjustable Mg2+ master mix, DNA template, primers, nuclease-free water, MgCl2 stock solution (e.g., 50 mM), thermal cycler. Procedure:
- Prepare the main Master Mix without Mg2+ on ice: 13 µL nuclease-free water, 2.0 µL 10X Buffer (Mg-free), 2.0 µL dNTPs (10 mM), 1.0 µL Forward Primer (10 µM), 1.0 µL Reverse Primer (10 µM), 0.5 µL DNA Polymerase (5 U/µL), 1.0 µL Template DNA (50 ng). Total volume per reaction before Mg2+ addition = 20.5 µL.
- Aliquot 20.5 µL of the main Master Mix into each of 7 PCR tubes.
- Add MgCl2 stock solution to each tube to achieve the desired final concentration in a 25 µL total reaction volume:
- Tube 1: 0.5 µL → 1.0 mM final
- Tube 2: 1.0 µL → 1.5 mM final
- Tube 3: 1.5 µL → 2.0 mM final
- Tube 4: 2.0 µL → 2.5 mM final
- Tube 5: 2.5 µL → 3.0 mM final
- Tube 6: 3.0 µL → 3.5 mM final
- Tube 7: 3.5 µL → 4.0 mM final
- Adjust each tube's final volume to 25 µL with nuclease-free water.
- Run PCR using your standard cycling parameters.
- Analyze 5-10 µL of each product by agarose gel electrophoresis.
- Identify the Mg2+ concentration producing the strongest, cleanest band.
Visualizations
Title: Master Mix Selection Workflow
Title: Key Roles of Mg2+ in PCR
The Scientist's Toolkit: Research Reagent Solutions
Table 3: Essential Reagents for Mg2+ Optimization Studies
| Reagent / Material | Function & Importance |
|---|---|
| Adjustable Mg2+ Master Mix | Core reagent providing all PCR components except Mg2+, enabling precise titration. |
| MgCl2 or MgSO4 Stock Solutions | High-quality, nuclease-free stocks (e.g., 25-50 mM) for accurate supplementation. |
| Nuclease-Free Water | Prevents degradation of reaction components; critical for reproducibility. |
| Standardized DNA Template | Consistent quality and concentration required for valid optimization. |
| Optimized Primer Pairs | High-efficiency primers are a prerequisite for effective Mg2+ optimization. |
| Agarose Gel Electrophoresis System | Standard method for analyzing PCR yield and specificity post-titration. |
| Real-Time PCR Instrument (for qPCR) | Required for generating amplification curves and calculating efficiency metrics. |
| Spectrophotometer/Nanodrop | For accurate quantification of nucleic acids and primer stocks. |
Technical Support Center
Troubleshooting Guides & FAQs
Q1: My qPCR amplification efficiency (E) is calculated to be >110% or <90%. What are the potential causes and solutions? A: Non-ideal efficiency indicates issues with reaction components or conditions, often linked to suboptimal Mg2+ concentration.
- Causes:
- Incorrect Mg2+ concentration in the master mix (too high or too low).
- Pipetting inaccuracies when preparing standard curves.
- Inhibitors present in the sample.
- Poor primer design or primer-dimer formation.
- Solutions:
- Optimize Mg2+: Perform a titration experiment (see Protocol 1). For Mg2+-sensitive assays, adjust the concentration in 0.5 mM increments.
- Calibrate pipettes and use reverse pipetting for viscous master mix solutions.
- Dilute the template or use a purification kit with an inhibitor removal step.
- Re-design primers to avoid secondary structures; use a thermal gradient to optimize annealing temperature.
Q2: My standard curve has a good R2 value (>0.99) but the efficiency is poor. Should I trust my quantification? A: No. R2 indicates the linearity of the log-linear plot, not the reaction kinetics. A high R2 with low efficiency means the data points are linearly related but the reaction is suboptimal, leading to inaccurate quantification. You must optimize the reaction (especially Mg2+, which affects polymerase fidelity and primer annealing) until both R2 > 0.99 and E = 90-110% are achieved.
Q3: The Cq values for my replicates are highly variable. How can I improve reproducibility? A: High Cq variability often stems from master mix inconsistency or pipetting errors.
- Primary Action: Ensure your master mix is homogeneous. Vortex the Mg2+-containing buffer thoroughly before use, then centrifuge briefly. Always prepare a single, large-volume master mix for all replicates and controls to minimize component variability.
- Secondary Checks: Check for low-level template contamination. Verify that the thermal cycler block is calibrated for even heating.
Q4: How do I determine if my assay's Limit of Detection (LOD) is suitable for my target application in drug development? A: The LOD must be below the lowest biologically relevant concentration. For example, if studying low-abundance transcripts in response to Mg2+-modulated drug treatments, you need an LOD in the single-copy range.
- Procedure: Statistically determine the LOD from your standard curve (see Protocol 2). Compare the LOD (e.g., 10 copies/µL) to the expected target concentration in your negative control or lowest sample. If the LOD is higher, you cannot reliably distinguish signal from noise. To improve LOD: optimize Mg2+ to increase efficiency, use a probe-based chemistry for higher specificity, and increase the amount of input nucleic acid if possible.
Q5: During Mg2+ optimization, increasing concentration reduces Cq but increases background fluorescence. What is the trade-off? A: This is a classic optimization challenge. Higher Mg2+ stabilizes DNA duplexes (lowering Cq by improving primer binding and polymerase activity) but also stabilizes non-specific products and primer-dimers (increasing background).
- Solution: The optimal Mg2+ concentration is the lowest point that yields the lowest Cq for your specific target before the non-specific fluorescence in the NTC rises significantly. Run a Mg2+ titration with both a target sample and a No-Template Control (NTC) to identify this inflection point.
Experimental Protocols
Protocol 1: Mg2+ Concentration Titration for Master Mix Optimization Objective: To determine the optimal MgCl2 concentration for a qPCR assay within the context of master mix formulation research.
- Prepare a 2X master mix base without MgCl2. Include buffer, dNTPs, hot-start Taq polymerase, primers, probe, and stabilizers.
- Prepare a 50 mM MgCl2 stock solution.
- Create 8 identical master mix aliquots. Spike each with MgCl2 to achieve final concentrations of: 1.0, 1.5, 2.0, 2.5, 3.0, 3.5, 4.0, and 5.0 mM.
- Pipette equal volumes of each Mg2+-adjusted master mix into wells containing a constant amount of template (e.g., 10^3 copies of target).
- Run qPCR with standard cycling conditions.
- Analysis: Plot Mean Cq vs. Mg2+ concentration. The optimal point is typically at the lowest Cq plateau before the NTC signal increases.
Protocol 2: Determination of Limit of Detection (LOD) Objective: To statistically determine the lowest concentration of target detectable by the optimized assay.
- Using the optimized master mix (with defined Mg2+), prepare a standard dilution series in a nucleic acid-free buffer (e.g., 10^5 to 10^0 copies/µL). Use at least 3 replicates per dilution.
- Perform qPCR.
- For each dilution, calculate the mean and standard deviation (SD) of the Cq values.
- Perform linear regression on the detectable dilutions to create the standard curve.
- The LOD is defined as the lowest concentration where 95% of replicates are positive (Cq < a predetermined cutoff, often 35-40). It can be calculated as the concentration corresponding to the mean Cq of the lowest detectable dilution + 3*SD of its Cq.
Table 1: Impact of Mg2+ Concentration on qPCR Validation Metrics Data from a model assay optimizing Mg2+ for GAPDH detection.
| [MgCl2] (mM) | Mean Cq (10^3 copies) | Efficiency (E) | R² (Standard Curve) | NTC Cq | Recommended? |
|---|---|---|---|---|---|
| 1.5 | 28.5 | 78% | 0.995 | Undet. | No (Low E) |
| 2.0 | 26.8 | 95% | 0.999 | 38.2 | Yes |
| 2.5 | 26.5 | 102% | 0.998 | 36.5 | Yes |
| 3.0 | 26.4 | 115% | 0.997 | 34.1 | No (High E) |
| 4.0 | 26.3 | 125% | 0.992 | 32.0 | No (High E) |
Table 2: Calculation of Assay LOD from Replicate Data Standard curve from optimized assay (2.5 mM Mg2+): Slope = -3.32, E = 100%, R² = 0.999.
| Target Copies/µL | Cq Replicate 1 | Cq Replicate 2 | Cq Replicate 3 | Mean Cq | SD | % Positive |
|---|---|---|---|---|---|---|
| 10 | 32.1 | 32.4 | 31.9 | 32.13 | 0.25 | 100% |
| 5 | 33.0 | 33.6 | Undet. | 33.30* | 0.42* | 67% |
| 1 | 35.2 | Undet. | Undet. | 35.20* | N/A* | 33% |
| LOD (Copies/µL) | 10 (based on 95% detection threshold) |
*Mean and SD calculated from detected replicates only for illustration.
Diagrams
Diagram 1: Mg2+ Optimization Workflow
Diagram 2: Key Validation Metrics Relationship
The Scientist's Toolkit: Research Reagent Solutions
| Item | Function in Mg2+/Master Mix Research |
|---|---|
| MgCl2 Stock Solution (Molecular Grade) | Precise source of Mg2+ ions for titration; critical for modulating Taq polymerase activity, primer annealing, and nucleic acid stability. |
| Mg2+-Free PCR Buffer (10X) | Provides the core reaction environment (pH, salts) without Mg2+, allowing for exact, incremental addition of MgCl2 during optimization. |
| dNTP Mix (with Mg2+-Equilibrated Concentration) | Nucleotide substrates; their concentration must be balanced with Mg2+ (typically dNTP:Mg2+ ratio considered) to prevent chelation and inhibition. |
| Hot-Start Taq DNA Polymerase | Enzyme for amplification; its processivity and fidelity are directly influenced by free Mg2+ concentration. Hot-start prevents non-specific amplification. |
| SYBR Green I Dye or Hydrolysis Probe (FAM/TAMRA) | Detection chemistry. Mg2+ optimization is crucial for probe-based assays, as it affects hybridization and cleavage efficiency. |
| Nuclease-Free Water | Solvent for all reagents; ensures no contaminating ions interfere with the precise Mg2+ concentration being tested. |
| Synthetic gBlock or Plasmid DNA Standard | Provides a consistent, high-purity template for generating standard curves to calculate E, R2, and LOD during optimization. |
Troubleshooting Guides & FAQs
Q1: My PCR/qPCR results show poor reproducibility between replicates. What Mg2+-related issues should I investigate? A: Inconsistent Mg2+ concentration is a primary culprit. Investigate:
- Master Mix Preparation: Ensure the Mg2+ stock solution is thoroughly mixed before pipetting. Vortex and briefly centrifuge.
- Component Compatibility: Verify if your polymerase buffer already contains Mg2+. Adding a MgCl2 supplement on top of this can lead to excess, non-optimal concentrations.
- Template Quality: Co-purified contaminants like EDTA from template prep can chelate Mg2+, effectively reducing the free concentration. Re-precipitate or re-purify your template.
- Protocol: Follow the "Mg2+ Titration Protocol" below to empirically determine the optimal concentration for your specific primer-template system.
Q2: I am observing low PCR yield or specificity (e.g., primer-dimer, non-specific bands). How can Mg2+ optimization help? A: Mg2+ directly influences polymerase fidelity and primer annealing.
- Low Yield: Often due to insufficient Mg2+ (required as a polymerase cofactor). Increase concentration incrementally.
- Low Specificity (Smearing/Bands): Often due to excessive Mg2+, which stabilizes non-specific primer-template binding and reduces enzyme fidelity. Decrease concentration.
- Primer-Dimer: High Mg2+ can facilitate primer-dimer formation. Lowering Mg2+ and ensuring precise reaction assembly at low temperatures (on ice) can mitigate this.
- Protocol: The "Robustness Test Protocol" below helps define the tolerable range of Mg2+ for your assay.
Q3: How does Mg2+ concentration impact reverse transcription (RT) and subsequent qPCR robustness? A: In one-step RT-qPCR, Mg2+ is a critical cofactor for both the reverse transcriptase and DNA polymerase. A suboptimal concentration compromises either or both steps.
- Issue: Low cDNA synthesis efficiency or variable qPCR amplification.
- Solution: Optimize Mg2+ specifically for the combined system. Titration is even more critical here than in standard PCR. Use a high-quality, dedicated one-step master mix with pre-optimized Mg2+, or perform a meticulous titration if formulating your own.
Experimental Protocols
Protocol 1: Standard Mg2+ Titration for PCR/qPCR Optimization Objective: To empirically determine the optimal Mg2+ concentration for a specific assay. Materials: See "Research Reagent Solutions" table. Method:
- Prepare a standard PCR master mix containing all components except MgCl2 and template.
- Prepare a dilution series of MgCl2 (e.g., 0.5 mM to 5.0 mM, in 0.5 mM increments).
- Aliquot the Mg-free master mix into separate tubes for each Mg2+ concentration.
- Add the corresponding MgCl2 dilution to each tube. Mix gently.
- Add an equal amount of template to each tube.
- Run the PCR/qPCR program appropriate for your primers and template.
- Analyze results: For qPCR, identify the concentration giving the lowest Cq and highest RFU. For endpoint PCR, identify the concentration giving the strongest specific band and no non-specific products.
Protocol 2: Testing Assay Robustness to Mg2+ Variation Objective: To determine the tolerable range of Mg2+ variation before assay performance degrades, defining its robustness. Method:
- Using the optimal Mg2+ concentration identified in Protocol 1 as the midpoint (e.g., 2.0 mM).
- Prepare reactions where the Mg2+ concentration is deliberately deviated by ±0.2 mM, ±0.5 mM, and ±1.0 mM from this optimum (e.g., 1.0, 1.5, 1.8, 2.0, 2.2, 2.5, 3.0 mM).
- Run the assay with at least 8 replicates per concentration under standard conditions.
- Data Analysis: Calculate the mean Cq and standard deviation (SD) for each concentration. The robust range is defined as the concentration window where the SD does not increase significantly (e.g., remains < 0.3 cycles) compared to the optimal point.
Data Presentation Tables
Table 1: Impact of Mg2+ Concentration on qPCR Assay Performance
| [Mg2+] (mM) | Mean Cq (Target) | Cq SD (Target) | Mean Cq (Control) | Non-Specific Amplification? | Pass/Fail |
|---|---|---|---|---|---|
| 1.0 | 35.2 | 0.45 | Undetermined | No | Fail |
| 1.5 | 28.5 | 0.22 | 32.1 | No | Pass |
| 2.0 | 26.8 | 0.15 | Undetermined | No | Optimal |
| 2.5 | 27.1 | 0.18 | 30.5 | Slight | Pass |
| 3.0 | 26.9 | 0.25 | 28.8 | Yes | Fail |
Table 2: Reagent Compatibility and Pre-formulated Mg2+ Content
| Common Master Mix Type | Typical [Mg2+] Range | Requires Supplement? | Notes for Reproducibility |
|---|---|---|---|
| Standard Taq Buffer | 1.5 mM | Often Yes | Highly variable; titration required. |
| Hot-Start Polymerase Mix | 1.5 - 3.0 mM | Usually No | Check manufacturer's specs. |
| One-Step RT-qPCR Mix | 3.0 - 7.0 mM | Rarely | Optimized for dual enzyme activity. |
| High-Fidelity PCR Mix | 1.5 - 2.5 mM | Rarely | Lower Mg2+ often used to enhance fidelity. |
The Scientist's Toolkit: Research Reagent Solutions
| Item | Function & Importance for Mg2+ Optimization |
|---|---|
| Molecular Biology Grade MgCl2 | High-purity stock solution for accurate molarity. Essential for titration. |
| Chelating Agent (e.g., EDTA) | Used in control experiments to sequester Mg2+ and confirm its role in observed effects. |
| Nuclease-Free Water | Prevents contamination and ensures Mg2+ concentration is not altered by ions. |
| Pre-formulated Master Mix | Provides a consistent baseline of Mg2+ and other salts; critical for reproducibility. |
| Standardized DNA Template | Controls for variable template quality that can affect Mg2+ requirement (e.g., EDTA carryover). |
Visualizations
Title: Mg2+ Concentration Effects on PCR Outcomes
Title: Mg2+ Optimization Experimental Workflow
Troubleshooting Guides & FAQs
FAQ Category: Assay Optimization & Reproducibility
Q1: Our diagnostic assay results show high inter-assay variability. Could Mg2+ concentration in the master mix be a factor? A: Yes. In diagnostic assays, stringent reproducibility is critical. Fluctuations in Mg2+ concentration, even within the 1.0-1.5 mM typical range for PCR, can significantly affect enzyme fidelity and amplicon yield. For a TaqMan-based diagnostic assay, we recommend optimizing and locking the Mg2+ concentration using a matrix titration (e.g., 0.5 mM to 2.5 mM in 0.25 mM increments) against a panel of known positive and negative clinical samples. The optimal concentration is the lowest that yields consistent, bright amplification in positives with no non-specific signal in negatives.
Q2: In high-throughput screening (HTS), we see a high rate of false positives in our enzymatic assay. Could master mix formulation be the issue? A: Absolutely. HTS often uses simplified, universal master mixes. Mg2+ acts as a essential cofactor for many enzymes (e.g., kinases, polymerases). A suboptimal concentration can reduce enzymatic specificity. Troubleshooting Steps:
- Run a Counter-Screen: Test hits in a secondary assay with a different detection method.
- Titrate Mg2+: Perform a pilot screen on a subset of plates with Mg2+ at 0.5, 1.0, 2.0, and 5.0 mM. Compare hit lists and signal-to-background (S/B) ratios.
- Review Z'-factor: A decline in Z'-factor (>0.5 is excellent) with certain Mg2+ levels indicates increased assay variance, leading to false calls.
Q3: Why does the optimal Mg2+ concentration differ between our research qPCR assay and the companion diagnostic we are developing for the same target? A: The goals differ. Research screening prioritizes sensitivity for target discovery, often using higher Mg2+ (e.g., 2.0-4.0 mM for SYBR Green) to boost signal. Diagnostic development prioritizes specificity, robustness, and tolerance to inhibitors, often requiring a lower, more stringent Mg2+ concentration (e.g., 1.5-2.0 mM) to minimize non-specific amplification and ensure reproducibility across sample types and operators.
Q4: How should we adjust Mg2+ when moving from a single-plex to a multiplex diagnostic assay? A: Multiplexing requires balancing conditions for multiple primer pairs. Mg2+ optimization is crucial.
- Start with the concentration optimal for the least efficient primer pair.
- Perform a Mg2+ titration (1.0 - 3.0 mM) monitoring all channels.
- Select the concentration that provides the most balanced, efficient amplification for all targets with minimal cross-talk. Taq polymerase fidelity is also Mg2+-dependent; verify specificity.
Data Presentation
Table 1: Comparative Assay Parameters & Optimal Mg2+ Ranges
| Parameter | Diagnostic Assay Development | High-Throughput Research Screening |
|---|---|---|
| Primary Goal | Specificity, Reproducibility, Clinical Validation | Sensitivity, Speed, Cost-per-Well, Hit Discovery |
| Typical Mg2+ Range | Narrow (e.g., 1.5 - 2.0 mM ± 0.2 mM) | Broad (e.g., 1.0 - 5.0 mM, depending on assay) |
| Key Metric | Clinical Sensitivity/Specificity, LoD, CV% | Z'-factor, S/B Ratio, Signal Window |
| Mg2+ Optimization Protocol | Rigorous titration with clinical samples; concentration locked | Often predefined by commercial master mix; may be titrated for campaign |
| Tolerance to Variability | Very Low | Moderate (adjusted statistically) |
Table 2: Impact of Mg2+ Concentration on Assay Performance
| [Mg2+] (mM) | PCR Efficiency (Research qPCR) | Taq Polymerase Fidelity (Relative) | HTS Z'-factor Example (Kinase Assay) |
|---|---|---|---|
| 0.5 | Low (<85%) | High | 0.1 (Poor - low signal) |
| 1.5 | Good (~95%) | Very High | 0.7 (Excellent) |
| 3.0 | High (>105%) | Moderate | 0.6 (Good) |
| 5.0 | Very High (risk of non-specific) | Low | 0.3 (Poor - high variance) |
Experimental Protocols
Protocol 1: Optimizing Mg2+ for a Diagnostic PCR Master Mix Objective: Determine the optimal, locked MgCl2 concentration for a robust diagnostic assay. Materials: See "The Scientist's Toolkit" below. Method:
- Prepare a base master mix lacking MgCl2. Include buffer, dNTPs, primers, probe, enzyme, and water.
- Prepare 8 separate tubes of the base mix. Spike in MgCl2 stock to create final concentrations of: 0.5, 1.0, 1.5, 2.0, 2.5, 3.0, 4.0, 5.0 mM.
- Aliquot each Mg2+ concentration mix into 8 replicate wells. Load with 5 µL of template: 4 replicates of high-positive control (10^4 copies/µL), 2 replicates of low-positive control (10^2 copies/µL), and 2 replicates of no-template control (NTC).
- Run qPCR: 95°C for 2 min, then 45 cycles of [95°C for 15 sec, 60°C for 60 sec].
- Analysis: For each Mg2+ level, calculate average Cq for positives, standard deviation, and check for NTC amplification. The optimal [Mg2+] is the lowest concentration yielding minimal Cq variance, no NTC signal, and a clear distinction between high and low positives.
Protocol 2: Mg2+ Titration for a High-Throughput Biochemical Screen Objective: Identify Mg2+ concentration yielding the best assay performance (Z'-factor) for an HTS campaign. Materials: See "The Scientist's Toolkit" below. Method:
- Using a 384-well plate, define four columns each for "High Control" (enzyme + substrate) and "Low Control" (enzyme + substrate + a known potent inhibitor).
- Prepare four separate master mixes with Mg2+ at 1.0, 2.0, 3.0, and 5.0 mM. Dispense the respective mix into quadrants of the plate for both controls.
- Incubate per assay protocol (e.g., 30 min, RT) and measure signal (e.g., fluorescence, luminescence).
- Analysis: For each Mg2+ condition, calculate:
- Mean and SD of High Control (µH, σH)
- Mean and SD of Low Control (µL, σL)
- Z'-factor = 1 - [ (3*(σH + σL)) / |µH - µL| ]
- Select the Mg2+ concentration yielding a Z'-factor > 0.5, with the largest signal window (µH - µL).
Diagrams
Diagram 1: Mg2+ Optimization Decision Workflow
Diagram 2: Mg2+ Role in Polymerase Function
The Scientist's Toolkit: Research Reagent Solutions
Table 3: Essential Materials for Mg2+ Optimization Studies
| Item | Function in Mg2+ Optimization | Example Product/Catalog |
|---|---|---|
| Molecular Grade MgCl2 Solution (25mM or 100mM) | Provides the standardized source of Mg2+ ions for titration; critical for consistency. | Thermo Fisher Scientific AM9530G |
| Mg2+-Free PCR Buffer (10X) | Serves as the base for creating custom Mg2+ concentrations; ensures other buffer components are constant. | Promega M777A |
| Hot Start Taq DNA Polymerase | High-fidelity enzyme whose activity is directly modulated by Mg2+ concentration; reduces non-specific amplification. | NEB M0495S |
| Synthetic Target DNA & Primers/Probes | Provides a consistent, reproducible template for optimization experiments, removing sample variability. | IDT Custom Oligos |
| Commercial Universal HTS Master Mix | Benchmark for comparison; often contains a fixed, proprietary Mg2+ concentration. | Thermo Fisher 4484253 |
| Validated Inhibitor Control (for HTS) | Essential for establishing the "Low Control" signal when calculating Z'-factor during Mg2+ titration. | Target-dependent (e.g., Staurosporine for kinases) |
| 384-Well Assay Plates | Standard format for HTS optimization studies; material can affect enzyme kinetics. | Corning 3570 (White, Low Flange) |
| qPCR Plates & Seals | For diagnostic assay optimization; ensure optical clarity and a secure seal for thermal cycling. | Bio-Rad HSP3801 |
Technical Support Center: Optimizing Mg2+ Concentration in PCR/qPCR Master Mixes
Troubleshooting Guides & FAQs
Q1: My PCR reaction yields no product or very low yield after optimizing other components. Could Mg2+ be the issue? A: Yes. Mg2+ is a critical cofactor for Taq DNA polymerase. Insufficient Mg2+ concentration severely reduces enzyme activity, leading to low or no product yield. Conversely, excessive Mg2+ can promote non-specific binding and increase primer-dimer formation.
Q2: I see non-specific bands or primer-dimer artifacts in my gel electrophoresis. How can Mg2+ optimization help? A: High Mg2+ concentrations stabilize DNA duplexes non-specifically, allowing primers to bind to mismatched sequences. Performing a Mg2+ titration (e.g., 1.0 mM to 4.0 mM in 0.5 mM increments) can identify the concentration that maximizes specificity. Lower concentrations often improve stringency.
Q3: My qPCR assay has high variability in Cq values and poor amplification efficiency. What role does Mg2+ play? A: In qPCR, Mg2+ affects both polymerase efficiency and the fluorescence signal from dyes like SYBR Green, as it influences DNA dye binding. Suboptimal Mg2+ causes inconsistent amplification kinetics and skewed efficiency calculations. Optimization is essential for reproducible, quantitative data.
Q4: I am switching from a commercial master mix to a homemade formulation to save costs. Where should I start with Mg2+? A: Begin with a broad titration around the standard 1.5 mM, which is typical for many commercial mixes. Use a standardized template and primer set. The optimal point balances yield, specificity, and efficiency. Document the performance against the commercial mix to validate data quality is maintained or improved.
Experimental Protocol: Mg2+ Titration for Master Mix Optimization
Objective: Determine the optimal MgCl2 concentration for a specific PCR/qPCR assay. Materials: See "The Scientist's Toolkit" below. Method:
- Prepare a 2X master mix without MgCl2, containing buffer, dNTPs, primers, polymerase, and water.
- Prepare a MgCl2 stock solution (e.g., 50 mM) and serially dilute it to create working stocks.
- For a 25 µL final reaction, aliquot a constant volume of the 2X master mix.
- Spike each aliquot with MgCl2 to achieve a final concentration gradient (e.g., 0.5, 1.0, 1.5, 2.0, 2.5, 3.0, 3.5, 4.0 mM). Adjust water volume to keep total volume constant.
- Add an equal amount of DNA template to each reaction.
- Run the PCR/qPCR protocol with standardized cycling conditions.
- Analyze results: For endpoint PCR, use gel electrophoresis to assess yield and specificity. For qPCR, calculate amplification efficiency (% efficiency = (10^(-1/slope) - 1) * 100) and assess Cq consistency and melt curve profiles.
Table 1: Cost-Benefit Analysis of Mg2+ Optimization for a 500-Run Project
| Parameter | No Optimization (Fixed 1.5mM Mg2+) | With Mg2+ Titration Optimization | Net Benefit of Optimization |
|---|---|---|---|
| Time Invested | 0 hours | 8 hours (assay design, titration run, analysis) | -8 hours |
| Reagent Cost (Mg2+, master mix components) | $1,250 | $1,100 (5% waste reduction, optimal conc.) | $150 Saved |
| Data Quality Metric (Theoretical) | 85% success rate, Efficiency: 95% | 95% success rate, Efficiency: 100% | +10% success, +5% efficiency |
| Project Risk | Higher risk of failed runs, repeat experiments. | Lower risk, more reliable data for decision-making. | Reduced project delay risk. |
Table 2: Common Symptoms and Mg2+-Focused Solutions
| Symptom | Likely Mg2+ Relationship | Recommended Action |
|---|---|---|
| No Amplification | Concentration too low | Increase Mg2+ in 0.5-1.0 mM steps. |
| Smear or Non-Specific Bands | Concentration too high | Decrease Mg2+ concentration. |
| High qPCR Cq, Low Efficiency | Suboptimal for enzyme/assay | Perform a full titration (1.0-4.0 mM). |
| Inconsistent Replicate Cqs | Sensitivity to minor mix variability | Optimize and then fix concentration precisely. |
The Scientist's Toolkit: Key Research Reagent Solutions
| Item | Function in Mg2+ Optimization |
|---|---|
| MgCl2 or MgSO4 Stock Solutions | The variable component for titration. Use high-purity, nuclease-free stocks. |
| Mg2+-Free PCR Buffer (10X) | Provides core salts and pH buffer without Mg2+, allowing precise control. |
| Hot-Start DNA Polymerase | Reduces non-specific amplification at room temperature, working synergistically with optimal Mg2+ to enhance specificity. |
| dNTP Mix | Substrates for polymerization. Mg2+ concentration must be balanced with total dNTP concentration as they chelate Mg2+. |
| SYBR Green I Dye | For qPCR. Mg2+ concentration affects its binding to dsDNA and fluorescence yield. |
| Standardized DNA Template & Primer Set | Essential controls for a consistent titration experiment to isolate the Mg2+ variable. |
Diagram 1: Mg2+ Role in PCR Amplification Pathway
Diagram 2: Mg2+ Optimization Experimental Workflow
Conclusion
Optimizing Mg2+ concentration is a foundational, yet often under-prioritized, step in developing robust and reliable nucleic acid amplification assays. As demonstrated through foundational biochemistry, systematic methodology, targeted troubleshooting, and rigorous validation, precise Mg2+ adjustment directly translates to enhanced specificity, yield, and reproducibility. For the research and diagnostic communities, investing in this optimization is not merely a technical step but a critical determinant of experimental success and data credibility. Future directions point toward intelligent master mix formulations that dynamically adapt to sample input, the integration of machine learning to predict optimal conditions, and the development of next-generation polymerases with altered cation dependencies, all promising to further streamline the path to precision molecular biology.