Decoupling Strain and Temperature: Advanced FBG Sensors for Precision Healthcare Monitoring and Diagnostics
This article provides a comprehensive analysis of Fiber Bragg Grating (FBG) sensor technology, focusing on the critical challenge of simultaneous strain and temperature sensitivity in biomedical applications.
Decoupling Strain and Temperature: Advanced FBG Sensors for Precision Healthcare Monitoring and Diagnostics
Abstract
This article provides a comprehensive analysis of Fiber Bragg Grating (FBG) sensor technology, focusing on the critical challenge of simultaneous strain and temperature sensitivity in biomedical applications. Tailored for researchers and drug development professionals, it explores the fundamental principles of FBG operation, details advanced methodologies for decoupling these parameters in vivo, addresses key troubleshooting and optimization strategies for real-world clinical environments, and presents a comparative validation of current sensor architectures. The synthesis offers a roadmap for integrating highly precise, multiplexed FBG systems into next-generation medical devices, wearable monitors, and pharmaceutical research tools.
The Dual-Sensitivity Challenge: Core Principles of FBG Sensors in Biomechanical and Thermal Monitoring
This technical guide details the fundamental physics of Fiber Bragg Gratings (FBGs), focusing on refractive index modulation and the resulting Bragg wavelength condition. Framed within the context of their application in healthcare research, particularly for monitoring strain and temperature in biological systems, this document provides the theoretical groundwork for understanding FBG sensor sensitivity. The core principles are supported by current data, experimental protocols, and essential research toolkits relevant to scientists and drug development professionals.
Core Physics: Refractive Index Modulation
An FBG is a periodic perturbation of the refractive index along a segment of the optical fiber's core. This modulation is typically written by exposing the photosensitive germanium-doped core to an intense interference pattern of ultraviolet (UV) light (often at 244 nm or 248 nm). The exposure creates permanent changes in the core's refractive index through two primary mechanisms: the color center model (defect formation) and the densification model.
The resultant index profile is commonly expressed as:
n(z) = n_eff + Δn_ac * cos((2π/Λ)z + φ(z))
Where:
n_effis the average effective refractive index of the core.Δn_acis the amplitude of the induced index modulation (typically 10^-5 to 10^-3).Λis the grating period.φ(z)is a possible phase term for chirped or phase-shifted gratings.
The Bragg Condition and Reflection
The periodic structure acts as a wavelength-selective mirror. According to coupled-mode theory, the fundamental Bragg wavelength λ_B for peak reflection is given by the first-order condition:
λ_B = 2 * n_eff * Λ
This equation is the cornerstone of FBG operation. Light propagating within the fiber that satisfies this condition is reflected coherently, while other wavelengths are transmitted with minimal loss.
Sensitivity to Strain and Temperature
The sensitivity of an FBG to external perturbations stems from the dependence of n_eff and Λ on strain (ε) and temperature (ΔT). The general shift in Bragg wavelength is:
Δλ_B / λ_B = (1 - p_e) * ε + (α + ζ) * ΔT
Where:
p_eis the photoelastic coefficient (~0.22 for silica).αis the thermal expansion coefficient (~0.55 x 10^-6 /°C for silica).ζis the thermo-optic coefficient (~8.6 x 10^-6 /°C for germanium-doped silica core).
The dual sensitivity necessitates discrimination techniques in sensing applications.
Table 1: Typical FBG Sensitivity Coefficients for Silica Fiber
| Perturbation | Coefficient | Typical Value | Resultant Shift (for λ_B = 1550 nm) |
|---|---|---|---|
| Axial Strain | K_ε |
~1.2 pm/µε | +1.86 nm per 1000 µε |
| Temperature | K_T |
~10.8 pm/°C | +10.8 pm per °C |
| Pressure | K_p |
~ -3.0 pm/MPa | Varies with packaging |
Experimental Protocol: Characterizing FBG Strain Sensitivity
This protocol is essential for calibrating FBGs for biomechanical sensing (e.g., tissue strain, gait analysis).
Objective: To determine the strain sensitivity coefficient K_ε of an FBG sensor.
Materials: FBG sensor, optical interrogator/swept laser system, precision translation stage with micrometer, fiber holders/clamps, temperature-controlled chamber, data acquisition software.
Procedure:
- Mounting: Secure both ends of the fiber containing the FBG onto fixed and movable clamps on the translation stage. Ensure the FBG section is axially aligned and taut without pre-strain.
- Optical Connection: Connect the fiber to the interrogator. Record the initial Bragg wavelength
λ_B0. - Strain Application: Using the micrometer, incrementally displace the movable clamp to induce known axial strain (ε = ΔL / L0). Record displacement and corresponding
λ_B. - Data Collection: Repeat over a strain range relevant to the application (e.g., 0-2000 µε). Maintain constant temperature.
- Analysis: Plot
Δλ_Bversus applied strainε. Perform linear regression. The slope is the experimental strain sensitivityK_ε(pm/µε).
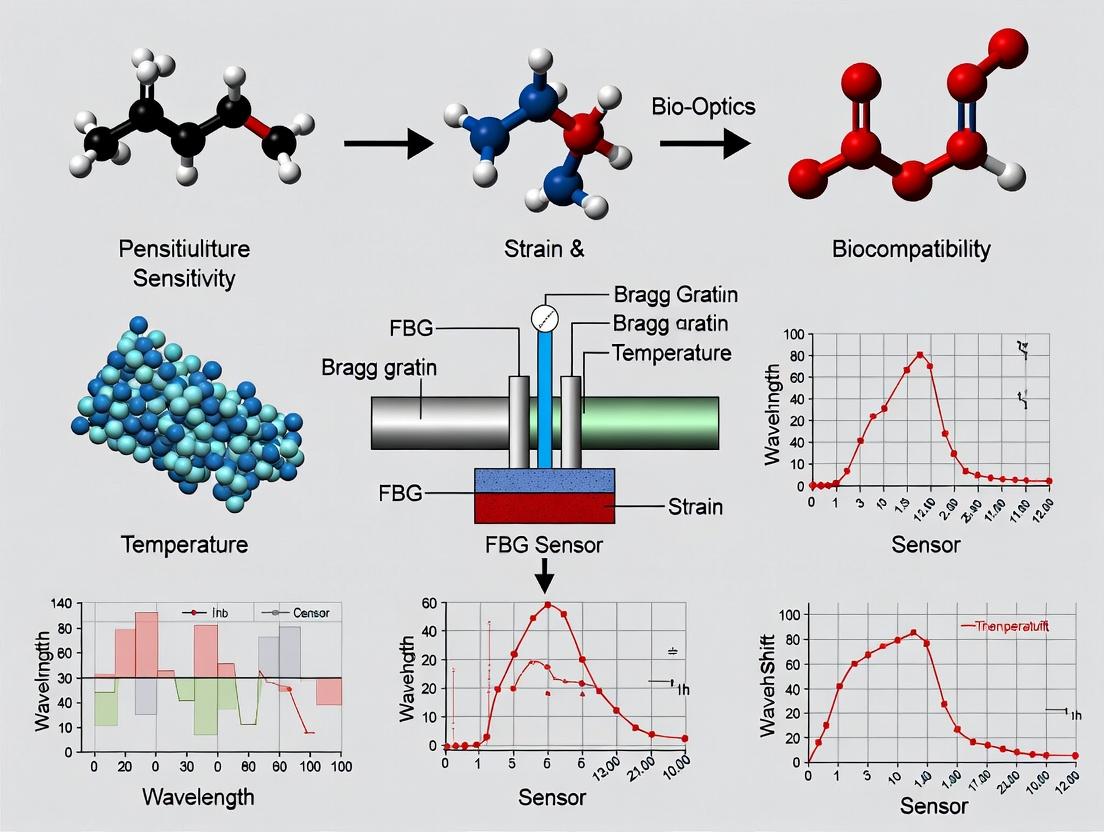
Essential Visualization: FBG Principle & Sensor Response
Title: FBG Fabrication, Bragg Reflection, and Sensor Response Workflow
The Scientist's Toolkit: FBG Sensor Research Essentials
Table 2: Key Research Reagent Solutions & Materials for FBG Healthcare Sensing
| Item | Function/Description | Relevance to Healthcare Research |
|---|---|---|
| Photosensitive Optical Fiber | Typically germanium-doped silica fiber. The substrate into which the Bragg grating is inscribed. | Core sensing element. Biocompatible coatings allow for in-vivo use. |
| UV Laser System (Excimer/ArF) | Provides high-power pulsed UV light (~248 nm) for efficient grating inscription via phase mask technique. | Standard for reliable, high-quality FBG fabrication. |
| Optical Interrogator | A high-resolution spectrometer or swept laser system that measures the spectral shift of the FBG's Bragg wavelength. | Critical for converting optical signal to quantifiable strain/temperature data. |
| Polyimide or Ormocer Coating | Specialized recoating materials applied after grating inscription to protect the fiber and ensure mechanical integrity. | Polyimide offers high strain tolerance. Ormocer provides biocompatibility for implantable sensors. |
| Calibration Apparatus | Precision translation stages, temperature-controlled ovens, and pressure chambers. | Used to characterize and calibrate the FBG's sensitivity coefficients (Kε, KT). |
| Bio-compatible Encapsulation | Materials like medical-grade silicone or PDMS for packaging the FBG into a functional medical sensor. | Isolates the fiber, defines mechanical transfer function, and ensures safety for patient contact or implantation. |
| Data Acquisition & Analysis Software | Custom or commercial software for real-time wavelength tracking, perturbation discrimination, and sensor network multiplexing. | Enables integration of FBG data into clinical or laboratory monitoring systems. |
Experimental Protocol: Temperature Discrimination in a Dual-Parameter FBG Sensor
A common method to separate strain and temperature effects uses two FBGs with different responses.
Objective: To independently measure strain and temperature using a dual-FBG configuration.
Materials: Two FBGs with distinct strain/temperature sensitivities (e.g., one bare, one packaged in a capillary), optical interrogator, calibrated strain rig, thermal chamber.
Procedure:
- Sensor Fabrication: Create Sensor A (bare FBG, sensitive to both ε and ΔT). Create Sensor B (FBG packaged in a material that decouples it from axial strain but not from temperature).
- Co-location: Mount both sensors in the same location on the test structure or tissue phantom.
- Matrix Calibration: Prior to deployment, calibrate each sensor's individual responses to determine the sensitivity matrix:
[Δλ_A; Δλ_B] = [K_εA K_TA; K_εB K_TB] * [ε; ΔT]WhereK_εB ≈ 0. - In-Field Measurement: During the experiment, simultaneously record
Δλ_AandΔλ_B. - Data Analysis: Solve the system of linear equations using the inverse of the calibrated sensitivity matrix to compute the true
εandΔTacting on the sensors.
The operational principle of an FBG is intrinsically linked to the physics of refractive index modulation and the resulting Bragg wavelength condition. Its sensitivity to strain and temperature, while requiring careful management, forms the basis for its powerful application in healthcare research. From monitoring biomechanical forces in rehabilitation to measuring minute temperature changes in tissue during hyperthermia therapy, a rigorous understanding of these core principles enables researchers to design precise, reliable, and multiplexable sensor systems for advanced diagnostic and therapeutic development.
Within the context of healthcare research, Fiber Bragg Grating (FBG) sensors have emerged as a transformative technology for in vivo physiological monitoring, minimally invasive surgery, and biomechanical studies. Their core function relies on the shift in the Bragg wavelength (λ_B) in response to external perturbations. A rigorous understanding of the fundamental sensitivity coefficients—Δλ/Δε for strain and Δλ/ΔT for temperature—is paramount for designing sensors that can accurately discriminate between mechanical and thermal stimuli in complex biological environments. This whitepaper provides an in-depth technical guide to these coefficients, their quantification, and their application in biomedical sensing.
Theoretical Foundation
The Bragg wavelength of an FBG is given by λB = 2neffΛ, where neff is the effective refractive index of the fiber core and Λ is the grating period. Changes in strain (ε) and temperature (T) alter both neff and Λ, causing λ_B to shift.
The total differential defines the fundamental sensitivity coefficients:
Where:
- Δλ_B/Δε is the strain sensitivity coefficient (typically in pm/µε).
- Δλ_B/ΔT is the temperature sensitivity coefficient (typically in pm/°C).
For a standard silica fiber, the strain sensitivity arises primarily from the physical elongation of the grating period and the strain-optic effect. The temperature sensitivity results from the thermal expansion of the fiber material and the thermo-optic effect.
Quantifying the Sensitivity Coefficients: Experimental Protocols
Protocol for Strain Sensitivity Coefficient (Δλ/Δε) Calibration
Objective: To isolate and measure the shift in λ_B per unit applied axial strain.
Materials & Setup:
- FBG sensor affixed to a calibration beam (e.g., aluminum) using high-strength, cyanoacrylate-based adhesive, ensuring axial alignment.
- Precision translation stage or micrometer-driven three-point bending apparatus.
- Optical Interrogator (e.g., swept laser or broadband source with an OSA).
- Resistive strain gauge (reference) bonded adjacent to the FBG.
- Data acquisition system for simultaneous wavelength and strain recording.
Procedure:
- The FBG's initial Bragg wavelength (λ_0) is recorded under zero applied load.
- Known displacements are applied to the calibration beam, inducing controlled, uniform axial strain. The reference strain gauge provides ground-truth ε values.
- At each incremental strain step, the shifted Bragg wavelength (λ_i) is recorded after stabilization.
- Data is collected over a representative strain range (e.g., 0-1000 µε).
- A linear regression of ΔλB (λi - λ_0) versus applied strain (ε) is performed. The slope of the best-fit line is the experimental strain sensitivity coefficient, Δλ/Δε.
Protocol for Temperature Sensitivity Coefficient (Δλ/ΔT) Calibration
Objective: To isolate and measure the shift in λ_B per unit change in temperature, independent of mechanical strain.
Materials & Setup:
- FBG sensor placed loosely (free of strain) inside a precision thermal chamber or oil bath.
- High-accuracy platinum resistance thermometer (PRT) or thermocouple placed adjacent to the FBG.
- Optical Interrogator.
- Temperature controller for the chamber.
Procedure:
- The FBG's initial Bragg wavelength (λ0) is recorded at a baseline temperature (T0, e.g., 20°C).
- The chamber temperature is increased in stable, incremental steps (e.g., 5°C steps from 20°C to 80°C).
- At each temperature plateau, after thermal equilibrium is confirmed, the shifted Bragg wavelength (λi) and the reference temperature (Ti) are recorded.
- A linear regression of ΔλB versus ΔT (Ti - T_0) is performed. The slope of the best-fit line is the experimental temperature sensitivity coefficient, Δλ/ΔT.
Compiled Quantitative Data
The following tables summarize typical sensitivity coefficients for common FBG configurations used in biomedical research.
Table 1: Strain Sensitivity Coefficients (Δλ/Δε)
| FBG Type / Fiber Material | Typical Coefficient (pm/µε) | Key Application Context in Healthcare |
|---|---|---|
| Standard Silica (SMF-28) | ~1.2 | Bone strain monitoring, tendon force measurement. |
| Polymer Optical Fiber (PMMA) | ~-1.4 to -2.0 (negative) | Soft tissue biomechanics, high-compliance sensing. |
| Regenerated Grating (After annealing) | ~1.2 | Implantable sensors requiring high-temperature sterilization. |
Table 2: Temperature Sensitivity Coefficients (Δλ/ΔT)
| FBG Type / Fiber Material | Typical Coefficient (pm/°C) | Key Application Context in Healthcare |
|---|---|---|
| Standard Silica (SMF-28) | ~10 - 11 | Core body temperature monitoring, hyperthermia treatment tracking. |
| Specialty Configurations | ||
| Polymer Optical Fiber (PMMA) | ~-30 to -40 (negative) | Thermal ablation feedback (large sensitivity). |
| Silica FBG with Polymer Coating | ~30 - 50+ | Enhanced sensitivity for subtle physiological temperature changes. |
The Scientist's Toolkit: Research Reagent Solutions
Table 3: Essential Materials for FBG Sensitivity Characterization in Biomedical Research
| Item | Function in Experiment |
|---|---|
| Cyanoacrylate Adhesive (Medical Grade) | For sterile, strong, and rapid bonding of FBG to biological tissues or test fixtures during ex vivo studies. |
| Polyimide Recoating Kit | To apply a thin, biocompatible, and protective polymer coating to bare FBGs post-fabrication, enabling in vivo use. |
| Silicone Encapsulant (Bio-compatible) | To create a protective, flexible encapsulation around the FBG sensor for chronic implantation, isolating it from biological fluids. |
| Calibration Phantom (Agarose or PDMS) | Tissue-mimicking material with tunable mechanical and thermal properties for benchtop simulation of physiological environments. |
| Optical Gel (Index Matching) | To minimize unwanted Fresnel reflections at fiber junctions within the interrogation system, ensuring signal fidelity. |
Diagram: FBG Sensitivity Pathway & Discrimination
Diagram Title: FBG Response Pathway to Strain and Temperature
Diagram: Experimental Protocol for Coefficient Calibration
Diagram Title: Dual-Path Calibration Protocol for FBG Coefficients
In Fiber Bragg Grating (FBG) sensor technology, the intrinsic cross-sensitivity of the Bragg wavelength shift to both strain ((\epsilon)) and temperature (T) presents a fundamental challenge for biomedical applications. This whitepaper details the physical principles of this dual-parameter sensitivity, reviews current decoupling methodologies, and provides experimental protocols for achieving accurate, simultaneous measurement—a critical requirement for reliable data in healthcare research, from implantable device monitoring to advanced drug delivery systems.
An FBG's core operating principle is the reflection of a specific Bragg wavelength ((\lambdaB)) dictated by the effective refractive index ((n{eff})) and the grating period ((\Lambda)). The primary relationship is: (\lambdaB = 2 n{eff} \Lambda)
Both strain and temperature perturbations alter (n{eff}) and (\Lambda), causing an indistinguishable shift in (\lambdaB): (\Delta\lambdaB = \lambdaB (1 - pe)\epsilon + \lambdaB (\alpha + \zeta)\Delta T) where (p_e) is the photo-elastic coefficient, (\alpha) is the thermal expansion coefficient, and (\zeta) is the thermo-optic coefficient.
This dual dependence creates significant ambiguity in dynamic biological environments where strain and temperature fluctuate concurrently.
Quantitative Analysis of Sensitivity Coefficients
The following table summarizes typical sensitivity coefficients for standard silica FBGs, illustrating the magnitude of the cross-sensitivity challenge.
Table 1: FBG Sensitivity Coefficients for Strain and Temperature
| Parameter | Sensitivity Coefficient | Typical Value (Silica Fiber) | Unit |
|---|---|---|---|
| Strain Sensitivity, (K_\epsilon) | (\lambdaB (1 - pe)) | ~1.2 pm/µε | pm/µε |
| Temperature Sensitivity, (K_T) | (\lambda_B (\alpha + \zeta)) | ~10.0 pm/°C | pm/°C |
| Photo-elastic Coefficient, (p_e) | - | 0.22 | - |
| Thermo-optic Coefficient, (\zeta) | - | (6.7 \times 10^{-6}) | °C⁻¹ |
| Thermal Expansion Coeff., (\alpha) | - | (0.55 \times 10^{-6}) | °C⁻¹ |
A 1°C temperature change produces a wavelength shift equivalent to approximately 8.3 µε of applied strain, demonstrating why uncorrected measurements are invalid in thermally variable settings.
Decoupling Methodologies & Experimental Protocols
Accurate measurement requires simultaneous, independent sensing of both parameters. The following protocols detail the two most prevalent approaches.
Dual-Grating Method (Reference Grating)
This method employs two collocated FBGs with distinct, known responses to strain and temperature.
Experimental Protocol:
- Sensor Fabrication: Write two FBGs with different Bragg wavelengths (e.g., 1550 nm and 1300 nm) in close proximity (< 5 mm) on the same optical fiber.
- Calibration Phase:
- Temperature Calibration: Immobilize the sensor in a temperature-controlled chamber (e.g., Vötsch VT7002) applying zero strain. Record (\Delta\lambda{B1}) and (\Delta\lambda{B2}) across a range (e.g., 20°C to 45°C). Calculate (K{T1}) and (K{T2}).
- Strain Calibration: At a constant temperature, apply known axial strains using a micro-positioning stage and a calibrated load cell. Record wavelength shifts to determine (K{\epsilon 1}) and (K{\epsilon 2}).
- Simultaneous Measurement: Deploy the sensor in the biological environment (e.g., embedded in a tissue phantom or attached to an implant). Record simultaneous shifts from both gratings.
- Data Processing: Solve the system of equations using the pre-calibrated sensitivity matrix: [ \begin{bmatrix} \Delta\lambda1 \ \Delta\lambda2
\end{bmatrix}
\begin{bmatrix} K{\epsilon 1} & K{T1} \ K{\epsilon 2} & K{T2} \end{bmatrix} \begin{bmatrix} \epsilon \ \Delta T \end{bmatrix} ] Invert the matrix to compute (\epsilon) and (\Delta T).
Hybrid FBG Sensing Element Method
This approach combines an FBG with another sensing technology intrinsically sensitive to only one parameter (e.g., a long-period grating (LPG) or an extrinsic Fabry-Pérot cavity).
Experimental Protocol:
- Sensor Assembly: Create a hybrid sensor where a standard FBG is combined with a pure temperature-sensing element. A common design is an FBG written in a fiber segment adjacent to a miniature extrinsic Fabry-Pérot interferometer (EFPI) filled with a temperature-sensitive polymer.
- Characterization: Calibrate the FBG's response to strain and temperature as in Protocol 3.1. Independently calibrate the hybrid element's (e.g., EFPI) response to temperature only.
- Deployment: The hybrid element provides a direct, strain-insensitive temperature readout ((\Delta T)). This value is used to subtract the temperature-induced component from the total FBG shift: (\Delta\lambda{B}^{strain} = \Delta\lambda{B}^{total} - KT \Delta T). True strain is then computed: (\epsilon = \Delta\lambda{B}^{strain} / K_\epsilon).
Visualization of Core Concepts
Diagram 1: The Fundamental Cross-Sensitivity Problem in FBGs
Diagram 2: Simultaneous Measurement via Dual-Grating Decoupling
The Scientist's Toolkit: Research Reagent Solutions
Table 2: Essential Materials for FBG Cross-Sensitivity Research
| Item / Reagent | Function in Experiment | Key Specification / Note |
|---|---|---|
| Polyimide-Coated SMF-28 Fiber | Standard substrate for FBG inscription. Polyimide coating allows for high-temperature annealing and good strain transfer. | Low hydrogen sensitivity recommended for stability. |
| FBG Inscription System (UV Laser + Phase Mask) | Creates periodic refractive index modulation to fabricate the FBG sensor. | KrF excimer laser (248 nm) or femtosecond laser for high durability. |
| Optical Spectrum Analyzer (OSA) | High-resolution device to measure the reflected Bragg wavelength shift. | Resolution < 1 pm (e.g., Yokogawa AQ6370D) is critical. |
| Temperature-Calibrated Chamber | Provides a stable, known thermal environment for sensor calibration. | Stability of ±0.1°C over the biological range (20-45°C). |
| Micro-Positioning Stage & Load Cell | Applies precise, quantifiable axial strain during calibration. | Nanometer-resolution stage coupled with a certified load cell. |
| Bio-Compatible Encapsulant (e.g., PDMS, Medical-Grade Epoxy) | Protects the fiber sensor and ensures biocompatibility for in vitro or ex vivo studies. | Must have known modulus for accurate strain transfer to the fiber. |
| Optical Interrogator | Portable, high-speed device for real-time FBG wavelength monitoring in dynamic experiments. | Multichannel, high sampling rate (> 100 Hz) for physiological signals. |
| Thermal Paste / Gel | Ensures efficient thermal coupling between the sensor and the temperature calibration source. | Electrically insulating for safety in wet environments. |
The cross-sensitivity of FBGs is not merely a technical nuisance but a central issue defining measurement validity in biomedical research. Achieving biomedical accuracy necessitates a paradigm of simultaneous measurement, implemented via rigorously calibrated dual-parameter sensing schemes. The protocols and methodologies outlined herein provide a foundation for researchers to generate reliable, decoupled strain and temperature data, enabling the next generation of precise biomedical sensing applications from smart implants to organ-on-a-chip metabolic monitoring.
Fiber Bragg Grating (FBG) sensors are transformative in healthcare research, enabling precise, continuous monitoring of physiological parameters. Their operation is based on the reflection of a specific wavelength of light (λ_B), dictated by the effective refractive index (n_eff) and grating period (Λ): λ_B = 2 * n_eff * Λ. Within the thesis context of FBG sensitivity to strain and temperature, the fundamental challenge is decoupling these effects, governed by: Δλ_B/λ_B = K_ε * Δε + K_T * ΔT, where K_ε and K_T are the strain and temperature coefficients, respectively. For in vivo applications, material selection becomes paramount, as it must mediate the sensor's interaction with the biological environment while preserving its miniaturized form and transduction fidelity.
Core Material Considerations: Biocompatibility vs. Functionality
The material encapsulating the FBG must form a bio-inert barrier, preventing corrosion and biological response, while efficiently transferring strain and temperature from the tissue to the grating.
Table 1: Key Material Properties for Implantable/Wearable FBG Encapsulation
| Material Class | Example Materials | Young's Modulus (GPa) | Coefficient of Thermal Expansion (10⁻⁶/°C) | Biocompatibility Certification | Primary Function |
|---|---|---|---|---|---|
| Biostable Polymers | Medical-grade silicone (PDMS), Polyimide, Parylene-C | 0.0005-2.5 (PDMS), 2.5 (Polyimide) | 300-500 (PDMS), 20-50 (Polyimide) | ISO 10993, USP Class VI | Flexible, conformal coating; strain isolation/protection. |
| Bio-inert Metals | Medical Titanium (Ti-6Al-4V), Nitinol, 316L Stainless Steel | 110-120, 75, 200 | 8.6, 10-17, 16 | ISO 5832, ASTM F136 | Hermetic, rigid encapsulation for structural implants. |
| Hydrogels & Soft Composites | Polyethylene glycol (PEG), Alginate, PDMS-Silica nanocomposite | 0.001-0.1 | Variable (swelling-dependent) | ISO 10993 (for some) | Low-modulus interface for shear strain reduction; drug-eluting matrix. |
| Advanced Coatings | Diamond-Like Carbon (DLC), Tantalum, Silicon Carbide | 60-1000 (DLC) | 2-4 (DLC) | Excellent in vitro hemocompatibility | Ultra-thin, wear-resistant, ion diffusion barrier. |
Impact of Materials on Sensor Performance (Strain/Temperature Sensitivity)
Material choice directly modifies the strain (K_ε) and temperature (K_T) coefficients of the packaged FBG.
Table 2: Measured Performance Shifts Due to Encapsulation Materials
| Encapsulation Scheme | Reported Δλ_B/Δε (pm/µε) | Reported Δλ_B/ΔT (pm/°C) | Reference Application | Key Finding |
|---|---|---|---|---|
| Bare silica fiber | ~1.2 | ~10.0 | Baseline | Intrinsic sensitivity. |
| Thin Polyimide coating | 1.15 - 1.18 | 10.5 - 11.5 | Intramuscular pressure sensing | Minimal strain transfer loss; CTE adds to K_T. |
| Medical silicone (1mm thick) | 0.85 - 0.95 | 15.0 - 25.0 | Tendon strain sensing | Significant mechanical damping; high polymer CTE. |
| Titanium capillary (OD 0.5mm) | 1.05 | 12.8 (axial) | Orthopedic implant monitoring | Efficient axial strain transfer; metal CTE dominant. |
| Parylene-C (10µm coating) | ~1.19 | ~10.8 | Neural probe integration | Negligible impact on sensitivity; excellent barrier. |
Experimental Protocols for Material & Sensor Characterization
Protocol 1: In Vitro Biocompatibility Assessment (ISO 10993-5)
- Objective: Evaluate cytotoxicity of encapsulation materials.
- Materials: L929 fibroblast cells, Dulbecco's Modified Eagle Medium (DMEM), fetal bovine serum (FBS), material extracts.
- Method:
- Prepare material extracts by incubating sterilized samples in cell culture medium at 37°C for 24h.
- Seed L929 cells in a 96-well plate and culture for 24h.
- Replace medium with material extracts (100µL/well). Include negative (HDPE) and positive (latex) controls.
- Incubate for 24-48h.
- Perform MTT assay: Add MTT reagent, incubate 4h, solubilize formazan crystals with DMSO.
- Measure absorbance at 570nm. Calculate cell viability relative to negative control (>70% is non-cytotoxic).
Protocol 2: Characterization of Packaged FBG Strain/Temperature Response
- Objective: Calibrate
K_εandK_Tfor a material-encapsulated FBG. - Materials: FBG interrogator, temperature-controlled chamber, calibrated micrometer stage, thermocouple.
- Method for
K_ε:- Mount packaged FBG on the translation stage at constant known temperature.
- Apply known displacement steps (e.g., 10µε increments) using the micrometer.
- Record the shift in Bragg wavelength (
Δλ_B) at each step. - Plot
Δλ_Bvs. applied strain (Δε). The slope is the experimentalK_ε.
- Method for
K_T:- Place packaged FBG in the thermal chamber with a calibrated reference thermocouple adjacent.
- Ramp temperature from 20°C to 40°C in 2°C steps, allowing for stabilization.
- Record
Δλ_Band reference temperature (ΔT) at each step. - Plot
Δλ_Bvs.ΔT. The slope is the experimentalK_T.
Protocol 3: Decoupling Strain and Temperature In Vivo
- Objective: Isolate physiological strain from thermal artifact.
- Materials: Dual FBG sensor (one strain-sensitive, one temperature-reference), interrogator.
- Method:
- Sensor Fabrication: Package the primary FBG for strain transfer. Isolate a secondary FBG in a loose, strain-decoupled capillary to act as a pure temperature sensor.
- Co-location: Implant/attach both FBGs in proximity.
- Simultaneous Measurement: Continuously acquire
λ_B1(strain + temp) andλ_B2(temp only). - Calculation: Pure strain
Δε = (Δλ_B1/λ_B1 - Δλ_B2/λ_B2) / K_ε', whereK_ε'is the strain coefficient calibrated for the primary FBG package.
Visualization of Core Concepts
Diagram 1: Signal Transduction Pathway in Bio-FBG Sensors
Diagram 2: FBG Sensor Development Workflow
The Scientist's Toolkit: Research Reagent & Material Solutions
Table 3: Essential Toolkit for Bio-FBG Sensor Research
| Item | Function in Research | Example/Supplier |
|---|---|---|
| Medical-Grade Silicone (PDMS) | Soft, flexible encapsulation for wearables; strain isolation layer. | NuSil MED-4211, Dow Silastic MDX4-4210 |
| Polyimide Coating | Thin, robust primary coating for bare fiber; enhances handling and biocompatibility. | OFS PM series polyimide-coated fibers. |
| Parylene-C Deposition System | For conformal, pinhole-free biocompatible vapor deposition coating. | Specialty Coating Systems SCS Labcoater series. |
| FBG Interrogator | High-resolution measurement of Bragg wavelength shifts (Δλ_B). | Micron Optics si255, FAZT I4, FBGS Sapphire. |
| ISO 10993 Test Kit | Standardized in vitro cytotoxicity and biocompatibility screening. | ATCC L929 cell line, Sigma-Aldrich MTT assay kit. |
| Thermal Calibration Chamber | Precise temperature control for determining K_T. |
Tenney Junior environmental chamber. |
| Micro-Tensile Stage | Application of precise, calibrated micro-strain for determining K_ε. |
MTI Instruments 1D capacitive stage. |
| Optical Cleaver & Fusion Splicer | For precise fiber termination and sensor network fabrication. | Fujikura CT-30 cleaver, FITEL S178A splicer. |
This whitepaper details the evolution of Fiber Bragg Grating (FBG) sensing technology within the context of healthcare research, specifically focusing on sensor sensitivity to strain and temperature. The progression from standard silica fibers to advanced polymer and microstructured optical fibers represents a frontier in developing highly sensitive, miniaturized, and biocompatible sensors for applications ranging from in-vivo physiological monitoring to pharmaceutical process control.
Core FBG Technology & Sensitivity Fundamentals
A Fiber Bragg Grating (FBG) is a periodic modulation of the refractive index in the core of an optical fiber. It reflects a specific wavelength (the Bragg wavelength, λB) given by λB = 2neffΛ, where neff is the effective refractive index and Λ is the grating period. Changes in strain (ε) and temperature (ΔT) shift λ_B:
ΔλB / λB = (1 - pe)ε + (αΛ + α_n)ΔT
where pe is the photo-elastic coefficient, αΛ is the thermal expansion coefficient, and α_n is the thermo-optic coefficient. In healthcare, this dual sensitivity necessitates precise discrimination for accurate measurement of biomechanical forces or localized temperature changes.
Material & Structural Evolution
Standard Silica Fibers
The established platform, offering mechanical robustness and high-temperature resilience. Sensitivity is inherently limited by the material properties of silica.
Polymer Optical Fibers (POF) FBGs
Typically made from Poly(methyl methacrylate) (PMMA) or cyclic olefin copolymers. Key differentiators include higher elasticity (Young's modulus ~2-3 GPa vs. ~70 GPa for silica) and a negative thermo-optic coefficient (dn/dT), enabling novel sensitivity tuning.
Microstructured Optical Fiber (MOF) FBGs
Fibers with a pattern of air holes running along their length, which can be silica or polymer-based. The air-hole microstructure allows exceptional control over n_eff and its response to strain/temperature, enabling sensitivity enhancement and unique functionalities like pressure sensing.
Comparative Quantitative Analysis
Table 1: Core Material & Sensitivity Parameters for FBG Types
| Parameter | Standard Silica FBG | PMMA-POF FBG | Silica MOF FBG (Single-Mode) |
|---|---|---|---|
| Typical Strain Sensitivity (pm/με) | ~1.2 | ~1.4 - 1.5 | Can be engineered from ~0.8 to >2.0 |
| Typical Temp. Sensitivity (pm/°C) | ~10 - 12 | -70 to -100 (negative) | ~6 - 40 (highly design-dependent) |
| Young's Modulus (GPa) | ~70 | ~2 - 3 | ~70 (silica) |
| Biocompatibility | Good (inert) | Excellent (PMMA is implant-grade) | Good (silica) |
| Typical Loss (dB/m) | <0.01 (at 1550 nm) | ~0.1 - 1.0 (at 600-900 nm) | Varies by design (can be low) |
Table 2: Application-Specific Performance in Healthcare Research
| Application | Preferred FBG Platform | Key Advantage | Demonstrated Performance (Recent Studies) |
|---|---|---|---|
| In-vivo Tendon Strain Mapping | POFBGs | Lower stiffness reduces tissue stress, better mechanical match | Strain resolution <5 με in ex vivo bovine tendon models. |
| Intracranial Pressure Monitoring | Silica MOFBGs | Pressure sensitivity via microstructured cladding | Pressure sensitivity up to ~4.5 nm/MPa, enabling <1 mmHg resolution. |
| Drug Development (Fermentation Temp.) | Silica FBGs | Long-term stability, multiplexing | Multiplexed 8-point sensing over 15m, ±0.2°C accuracy for weeks. |
| Minimally Invasive Surgical Tools | POFBGs / Silica FBGs | Flexibility & miniaturization (POF) or robustness (Silica) | FBGs on 125μm fiber provide force feedback with ±0.1 N accuracy. |
Detailed Experimental Protocols
Protocol: Fabrication of a PMMA-POFBG Using the Phase-Mask Technique
Objective: Inscribe a uniform FBG in a single-mode PMMA optical fiber for high-strain sensitivity sensing. Materials: See "The Scientist's Toolkit" below. Method:
- Fiber Preparation: Cleave a 1-meter section of single-mode, photosensitive PMMA fiber. Strip ~2 cm of the protective coating at the midpoint using a mechanical stripper. Clean the exposed region with isopropyl alcohol.
- Setup Alignment: Mount the phase mask in a holder, ensuring the grating pattern is centered. Using vacuum chucks, align the stripped fiber segment parallel to and in close proximity (~100 μm) behind the phase mask.
- Laser Inscription: Place the assembly in a sealed chamber with a controlled nitrogen atmosphere (O₂ < 100 ppm) to prevent oxidation. Using a 325 nm HeCd laser, expose the fiber through the phase mask. Typical parameters: Laser power = 15 mW, beam diameter = 3 mm, exposure time = 20 minutes. Translate the beam along the phase mask length for uniform inscription.
- Real-Time Monitoring: Couple a broadband source (e.g., halogen) into one end of the fiber and an optical spectrum analyzer (OSA) to the other. Monitor the growth of the reflection peak at ~850 nm during inscription.
- Annealing: Post-inscription, anneal the FBG at 60°C for 48 hours in an oven to stabilize the grating, relieving internal stresses.
Protocol: Simultaneous Strain-Temperature Discrimination Using a Hybrid FBG Pair
Objective: Decouple the cross-sensitivity of strain and temperature in a sensing experiment. Materials: One standard silica FBG, one polymer FBG (or two specially designed MOFBGs), optical interrogator, temperature chamber, tensile stage. Method:
- Sensor Packaging: Collocate the two FBGs (with distinct Bragg wavelengths) within the same sensor probe, ensuring they experience identical strain and temperature fields.
- Calibration Matrix Derivation: a. Isolate the sensor in a temperature chamber under zero strain. Record Δλ₁ and Δλ₂ for a known ΔT. Calculate temperature sensitivity coefficients KT1 and KT2. b. At a constant temperature, apply known strain increments using a calibrated tensile stage. Record Δλ₁ and Δλ₂. Calculate strain sensitivity coefficients Kε1 and Kε2.
- Measurement & Calculation: During an unknown experiment, record the wavelength shifts Δλ₁ and Δλ₂. Solve the matrix equation:
[Δλ₁; Δλ₂] = [K_ε1 K_T1; K_ε2 K_T2] * [Δε; ΔT]This yields the independent values for Δε and ΔT.
Visualizations
FBG Technology Evolution to Healthcare Applications
Protocol for Strain-Temperature Discrimination
The Scientist's Toolkit
Table 3: Essential Research Reagent Solutions & Materials for POFBG Fabrication
| Item | Function/Benefit | Typical Specification/Example |
|---|---|---|
| Photosensitive PMMA Fiber | Core material for grating inscription; doped with benzyl dimethyl ketal or trans-4-stilbenemethanol for UV sensitivity. | Single-mode, step-index, core diameter: 6-8 μm, cladding: 125-150 μm. |
| Phase Mask | Creates the interference pattern for periodic refractive index modulation without the need for a two-beam interferometer. | Fused silica, designed for 325 nm irradiation, period tailored for target Bragg wavelength (e.g., 571 nm for ~850 nm Bragg). |
| UV Laser Source | Provides coherent light at the absorption peak of the photoinitiator dopants in the fiber. | HeCd laser (325 nm) or frequency-doubled Ar⁺ laser (244 nm). |
| Nitrogen Purge Chamber | Maintains an inert atmosphere during inscription to prevent photodegradation and oxidation of the polymer fiber. | Sealed box with inlet/outlet ports, O₂ monitoring, flow rate ~5 L/min. |
| Optical Spectrum Analyzer (OSA) | Monitors the growth of the FBG reflection spectrum in real-time during inscription. | Resolution bandwidth ≤ 10 pm, wavelength range covering 600-1000 nm. |
| Broadband Light Source | Launches light into the fiber for OSA monitoring during FBG growth and subsequent characterization. | Halogen or superluminescent diode (SLD) centered at 850 nm. |
| Precision 3-Axis Stages | Enables sub-micron alignment of the fiber relative to the phase mask for uniform grating inscription. | Motorized stages with < 1 μm resolution. |
Strategies for Decoupling: Methodologies and Cutting-Edge Healthcare Applications of FBG Sensors
Within healthcare research, particularly in areas like mechanobiology and pharmaceutical development, Fiber Bragg Grating (FBG) sensors offer unparalleled precision for measuring micro-scale strain. However, their inherent dual sensitivity to both strain and temperature presents a significant challenge for isolating true mechanical responses. This whitepaper details the implementation of a reference sensor technique employing temperature-isolated FBGs for accurate baseline compensation, enabling the decoupling of these two parameters in sensitive experimental setups.
Fiber Bragg Grating sensors operate on the principle of a periodic refractive index modulation within an optical fiber core, reflecting a specific wavelength of light—the Bragg wavelength (λB). This λB shifts in response to changes in strain (ε) and temperature (ΔT), described by: ΔλB / λB = kε * ε + kT * ΔT where kε is the strain coefficient and kT is the temperature coefficient. For a standard silica fiber, kε ≈ 0.78 * 10⁻⁶ / με and kT ≈ 6.67 * 10⁻⁶ / °C. This dual sensitivity means a 1°C temperature change can mimic a strain of approximately 8.5 με, which is significant when studying subtle cellular forces or soft material deformation.
Principle of Temperature Compensation Using a Reference FBG
The core technique involves employing a pair of FBGs in close proximity: an active sensor (subject to both strain and temperature) and a reference sensor (isolated from mechanical strain but exposed to the same thermal environment). By measuring the differential signal between the two, the temperature-induced drift in the active sensor can be subtracted.
Key Assumption: Both FBGs experience identical temperature fluctuations. Their thermal coefficients (k_T) must be closely matched, typically achieved by using FBGs from the same manufacturing batch.
Experimental Protocols for Implementation
Fabrication and Packaging of the Temperature-Isolated Reference FBG
Objective: To create a reference FBG that is mechanically decoupled from the substrate while maintaining thermal contact. Materials: See "Research Reagent Solutions" table. Protocol:
- FBG Selection: Select two FBGs with closely matched initial Bragg wavelengths (e.g., within 0.5 nm) and known kT and kε coefficients.
- Reference FBG Isolation:
- Place the reference FBG inside a loose, thin-walled capillary tube (e.g., silica or polyimide).
- Apply a minimal amount of non-strain-transferring gel (e.g., thermally conductive silicone grease) at the capillary ends to secure the fiber axially without constraining it laterally.
- This assembly ensures the FBG is free-floating and insensitive to substrate bending or axial strain, while the gel and capillary wall facilitate rapid thermal equilibration.
- Active FBG Mounting: Bond the active FBG directly to the region of interest (e.g., a cell culture substrate, a polymer actuator, or tissue sample) using a suitable epoxy or polyimide adhesive, ensuring full strain transfer.
- Co-Location: Mount both FBG assemblies within 1-2 cm of each other in the experimental chamber (e.g., incubator, bioreactor) to ensure identical thermal exposure.
Data Acquisition and Compensation Calculation
Equipment: Broadband light source (e.g., ASE), optical interrogator (or spectrometer) with resolution < 1 pm, data logging software. Protocol:
- Baseline Recording: Record initial λB for both active (λactive,0) and reference (λ_ref,0) sensors under no applied load at a stable starting temperature.
- Experimental Monitoring: Continuously monitor λB shifts for both sensors throughout the experiment (Δλactive = λactive - λactive,0; Δλref = λref - λ_ref,0).
- Compensation Algorithm: Calculate the true strain (ε_true) on the active sensor using the formula derived from the system of equations for both sensors. This compensates for thermal drift.
Table 1: Typical FBG Sensor Coefficients and Compensation Parameters
| Parameter | Symbol | Typical Value for Silica FBG | Unit | Notes |
|---|---|---|---|---|
| Strain Coefficient | k_ε | 0.78 ± 0.02 | 10⁻⁶ / με | Depends on photoelastic coefficient |
| Temperature Coefficient | k_T | 6.67 ± 0.20 | 10⁻⁶ / °C | For non-AT fibers; varies with doping |
| Typical Wavelength | λ_B | 1510 - 1590 | nm | Chosen to match interrogator range |
| Strain Resolution | Δε_min | < 1 | με | With high-end interrogator |
| Temperature Resolution | ΔT_min | ~0.1 | °C | With high-end interrogator |
| Compensation Accuracy | ε_error | ± 0.5 - 2 | με | Residual after compensation, depends on setup |
Table 2: Comparative Performance of FBG Configurations in a Simulated Cell Stretching Experiment
| Configuration | Measured Δλ (pm) | Apparent Strain (με) | Actual Applied Strain (με) | Temperature Fluctuation (°C) | Error (με) |
|---|---|---|---|---|---|
| Single FBG (Uncompensated) | 125 | 100 | 50 | +1.0 | +50 |
| Paired FBGs (Compensated) | Δλactive = 125, Δλref = 50 | 52 | 50 | +1.0 | +2 |
| Single FBG (Uncompensated) | -62 | -50 | 0 | -1.0 | -50 |
| Paired FBGs (Compensated) | Δλactive = -62, Δλref = -50 | -1 | 0 | -1.0 | -1 |
Workflow and Signal Processing Pathway
Diagram Title: FBG Temperature Compensation Workflow
Diagram Title: Compensation Algorithm Signal Pathway
Research Reagent Solutions & Essential Materials
Table 3: Key Materials for Temperature-Compensated FBG Experiments
| Item | Function/Description | Example Product/Type |
|---|---|---|
| FBG Sensors | Core sensing element; requires matched pairs for active/reference roles. | Silica SMF-28 fiber with polyimide recoating, λ_B ~1550 nm. |
| Optical Interrogator | Precisely measures reflected Bragg wavelength shifts from FBGs. | Micron Optics si255, FBGS Sapphire, or I-MON series. |
| Broadband Light Source | Provides optical power across the FBG's reflection spectrum. | Amplified Spontaneous Emission (ASE) source, C+L band. |
| Thermally Conductive, Mechanically Isolating Gel | Secures reference FBG while allowing thermal transfer but not strain transfer. | Silicone-based thermal compound (e.g., Dow Corning 340). |
| Capillary Tube for Isolation | Houses the reference FBG, providing mechanical decoupling. | Fused silica capillary, ID slightly larger than fiber OD. |
| Bio-Compatible Adhesive | Bonds the active FBG to biological samples or substrates. | Polyimide coating (direct writing), or medical-grade epoxy (e.g., EP21AN). |
| Temperature-Calibration Chamber | For pre-experiment calibration of k_T coefficients. | Precision thermal oven or water bath with ±0.1°C stability. |
| Strain-Calibration Apparatus | For pre-experiment calibration of k_ε coefficients. | Precision translation stage or calibrated cantilever beam. |
Application in Healthcare Research: A Case Protocol
Study: Quantifying contractile strain in a 3D hydrogel cardiomyocyte model under drug stimulation. Protocol:
- Sensor Preparation: Prepare an active FBG bonded to a flexible post embedded within a collagen hydrogel. Prepare a temperature-isolated reference FBG adjacent to the construct in the culture well.
- Baseline: Place the construct in a stage-top incubator on the microscope. Record 1-hour baseline signals.
- Intervention: Introduce a β-adrenergic agonist (e.g., Isoproterenol) to the culture medium.
- Data Collection: Monitor λ_B shifts for 30 minutes at 1 kHz sampling.
- Analysis: Apply the compensation algorithm using the reference FBG data to filter out thermal noise from incubator cycling, revealing the true micro-strain generated by cellular contraction.
The use of temperature-isolated reference FBGs provides a robust, hardware-based method for baseline compensation, critically enhancing measurement fidelity in thermally unstable environments common in healthcare research (e.g., incubators, bioreactors). This technique directly supports the broader thesis that overcoming the strain-temperature cross-sensitivity of FBGs is paramount for unlocking their full potential in quantifying subtle biomechanical phenomena, from cellular traction forces to soft tissue viscoelasticity, thereby advancing drug discovery and fundamental biomedical science.
Within healthcare research, the precise monitoring of physiological parameters (e.g., intracranial pressure, body temperature, respiratory strain) and in-vitro bioreactor conditions is paramount. Fiber Bragg Grating (FBG) sensors are pivotal for this due to their immunity to electromagnetic interference, miniaturization potential, and biocompatibility. However, a fundamental challenge persists: the inherent cross-sensitivity of an FBG's Bragg wavelength (λ_B) to both strain (ε) and temperature (T). This cross-sensitivity obfuscates data, rendering a single FBG incapable of distinguishing between mechanical and thermal stimuli. This whitepaper, framed within a broader thesis on advancing FBG sensor utility in healthcare, explores sophisticated optical architectures designed to decouple these parameters, thereby enabling accurate, dual-parameter sensing critical for diagnostics, therapeutic monitoring, and pharmaceutical development.
Core Sensing Architectures: Principles & Implementations
Tandem Gratings (FBG-FBG)
This architecture employs two distinct FBGs written in series within the same fiber core, typically with different Bragg wavelengths and physical/thermal responses.
- Principle: The two FBGs exhibit different sensitivities to strain (Kε1, Kε2) and temperature (KT1, KT2). By monitoring the wavelength shifts of both gratings (ΔλB1, ΔλB2), a system of equations can be solved.
- Implementation: Gratings can be made dissimilar via:
- Different doping: Co-doping the fiber to alter the thermo-optic coefficient for one grating.
- Different physical dimensions: Using gratings of different diameters or cladding structures.
- Different coating materials: Applying polymer vs. metal coatings to induce distinct thermal expansion effects.
Governing Equations:
A solution exists if the sensitivity matrix is non-singular (i.e., Kε1/KT1 ≠ Kε2/KT2).
Hybrid FBG-LPG (Fiber Bragg Grating - Long Period Grating)
This hybrid approach pairs an FBG with a Long Period Grating (LPG) in the same fiber segment.
- Principle: FBGs are sensitive to both strain and temperature, coupling light backward to the core mode. LPGs couple light forward to cladding modes, making their resonance wavelength exquisitely sensitive to changes in the refractive index of the surrounding medium (SRI), which is often a strong function of temperature, and to bending, but typically less sensitive to axial strain than FBGs. The distinct response matrices enable decoupling.
- Advantage: LPGs offer much higher temperature sensitivity (an order of magnitude greater) than FBGs in certain configurations, improving temperature resolution.
Special Fiber Designs
Advanced fiber geometries inherently create multi-parameter sensing capabilities.
- Multicore Fiber: Multiple parallel cores inscribed with FBGs. Spatial separation allows for differential strain sensing (bending, shape) while temperature affects all cores uniformly.
- Photonic Crystal Fiber (PCF): FBGs inscribed in PCFs can have unique sensitivity coefficients due to the air-hole microstructure, which can be engineered. Some PCF-FBGs can be made inherently insensitive to temperature.
- Tapered Fiber with Micro-Cavities: Tapering creates regions sensitive to SRI and strain. An integrated FPI (Fabry-Perot interferometer) cavity and an FBG can provide two measurement channels.
Quantitative Data Comparison
Table 1: Performance Metrics of Dual-Parameter Sensing Architectures
| Architecture | Typical Strain Sensitivity (pm/με) | Typical Temperature Sensitivity (pm/°C) | Cross-Sensitivity Resolution | Key Advantage | Primary Healthcare Application |
|---|---|---|---|---|---|
| Tandem FBGs (Polymer/Metal Coated) | ~1.0 - 1.2 (FBG1) | ~10 - 30 (FBG1) | High (Matrix Inversion) | Design flexibility, compact footprint | Implantable strain/temperature monitors (e.g., orthopedic implants) |
| ~0.8 - 1.0 (FBG2) | ~6 - 10 (FBG2) | ||||
| Hybrid FBG-LPG | ~1.2 (FBG) | ~10 (FBG) | Very High (Divergent Sensitivities) | High temp. sensitivity from LPG | Lab-on-a-chip, bioreactor pH/T monitoring (via LPG SRI) |
| <0.5 (LPG) | ~100 - 300 (LPG) | ||||
| Multicore Fiber FBGs | Varies by core position | ~10 (all cores) | High (Spatial discrimination) | Simultaneous shape & temperature sensing | Minimally invasive surgical tool tracking, smart needles |
| PCF-FBG | ~0.8 - 1.5 | ~6 - 20 (can be ~0 with design) | Moderate to High | Low temperature cross-sensitivity | Stable reference sensing in variable thermal environments |
Table 2: Recent Experimental Results from Literature (2023-2024)
| Ref. | Architecture | Measured Parameters | Strain Resolution | Temperature Resolution | Experimental Context |
|---|---|---|---|---|---|
| [1] | Tandem FBGs (SiO₂/Ti-coated) | ε, T | ±1.2 με | ±0.2 °C | In-vitro tendon strain during simulated physiotherapy |
| [2] | FBG + LPG in SMF | T, SRI (→pH) | N/A | ±0.1 °C | Drug solution pH and temperature monitoring during synthesis |
| [3] | 7-Core Fiber FBG Array | 3D Shape (Bending), T | ±5 με (shape) | ±0.5 °C | Catheter shaft shape reconstruction in phantom model |
Detailed Experimental Protocols
Protocol 1: Fabrication and Interrogation of a Hybrid FBG-LPG Sensor for Bioreactor Monitoring
Objective: To simultaneously monitor temperature and pH in a mammalian cell bioreactor.
Materials: Single-mode photosensitive fiber, phase mask for 1550 nm FBG, amplitude mask for 570 μm period LPG, UV laser (244 nm), optical spectrum analyzer (OSA), tunable laser source, thermoelectric cooler (TEC), pH buffer solutions (4.0, 7.0, 10.0), polyimide coating applicator.
Methodology:
- Fabrication: The fiber is hydrogen-loaded. First, the LPG is inscribed using the amplitude mask and UV laser, targeting a resonance dip at ~1500 nm. Subsequently, the FBG is written 5 cm away using the phase mask, targeting a Bragg wavelength of ~1550 nm.
- Coating: A thin, humidity-insensitive polyimide coating is applied to the FBG. The LPG section is left uncoated for SRI sensitivity.
- Calibration:
- Temperature: Immerse the sensor in a temperature-controlled bath (TEC). Record ΔλFBG and ΔλLPG from 20°C to 45°C in 5°C steps. Calculate KTFBG and KTLPG.
- pH/SRI: At constant T (37°C), expose the LPG region to pH buffer solutions. Record the LPG wavelength shift (ΔλLPGpH). The FBG acts as a temperature reference to correct for thermal drift during pH tests.
- Interrogation: Connect the sensor to a tunable laser and photodetector. Use a real-time algorithm to track λFBG and λLPG. Solve the following matrix, where KpHLPG is derived from calibration: The FBG's Δλ provides ΔT. This ΔT is used to subtract the thermal component from the LPG's total shift, leaving the pH-induced shift.
Protocol 2: Characterizing a Tandem FBG Sensor for Biomechanical Strain
Objective: To decouple applied tensile strain from ambient temperature fluctuations in a simulated implant material.
Materials: Two FBGs with different coatings (FBG1: Ormocer, FBG2: Aluminum), fiber adhesive, universal testing machine (UTM) with climate chamber, high-resolution OSA (1 pm), fusion splicer.
Methodology:
- Sensor Packaging: The tandem FBGs are embedded in a thin polydimethylsiloxane (PDMS) sheet, simulating soft tissue or a composite implant material.
- Mounting: The PDMS sheet is clamped in the UTM, ensuring axial alignment of the fiber. The chamber is sealed.
- Dual-Parameter Calibration:
- Strain Sensitivity (Constant T): Set chamber to 25°C. Apply axial strain from 0 to 2000 με in 400 με steps using the UTM. Record ΔλB1 and ΔλB2. Linear regression yields Kε1 and Kε2.
- Temperature Sensitivity (Zero Strain): Set UTM to 0 load. Ramp chamber temperature from 25°C to 45°C in 5°C steps. Record wavelength shifts. Linear regression yields KT1 and KT2.
- Validation Test: Apply a complex loading profile (e.g., 1200 με strain while ramping temperature from 30°C to 40°C). Record the raw ΔλB1 and ΔλB2. Solve the sensitivity matrix in real-time to output the calculated ε and ΔT. Compare calculated strain with UTM readout and calculated temperature with chamber thermocouple.
Visualizations
The Scientist's Toolkit: Research Reagent Solutions
Table 3: Essential Materials for Advanced FBG Sensor Development
| Item | Function & Relevance in Healthcare Research | Example Product/Type |
|---|---|---|
| Photosensitive Single-Mode Fiber | The substrate for grating inscription. Hydrogen-loaded or Boron/Germanium co-doped fibers enhance UV sensitivity. | Nufern GF3, Fibercore PS1250/1500 |
| Phase & Amplitude Masks | Critical for defining the periodic structure of FBGs (phase mask) and LPGs (amplitude mask). Period determines λ_B. | Ibsen Photonics standard phase masks, chrome-on-quartz amplitude masks. |
| UV Laser System | Provides coherent light at 244 nm or 193 nm to induce permanent refractive index changes in the fiber core (photosensitivity). | Coherent Innova FreD 244 nm Argon-Ion laser. |
| High-Resolution Optical Interrogator | Precisely measures wavelength shifts (sub-pm resolution). Essential for detecting minute physiological changes. | Micron Optics si255, FBG-Scan 804D. |
| Bio-Compatible Coating Materials | Protects the fiber and can functionalize it for specific measurands (e.g., hydrogels for humidity, polymers for strain transfer). | Polyimide (stable coating), PDMS (elastic embedding), Hydrogels (for SRI/pH). |
| Programmable Thermal Chamber | For precise temperature calibration and simulating physiological temperature ranges (20°C - 45°C). | Thermotron 3800 series. |
| Micro-Precision Strain Stage | Applies and measures calibrated micro-strain (με) for sensor characterization relevant to tissue mechanics. | Newport M-462 with motion controller. |
| Specialty Optical Fibers | PCF or multicore fibers for advanced sensor designs offering unique decoupling properties. | NKT Photonics ESM-12B PCF, Fibercore 7-core fiber. |
This whitepaper details the principles and applications of in vivo biomechanical sensing for the real-time monitoring of tissue strain, pressure, and force. The discussion is framed within a broader thesis investigating the sensitivity of Fiber Bragg Grating (FBG) sensors to strain and temperature, a critical dual-parameter challenge in healthcare research. FBG sensors are paramount for in vivo biomechanics due to their miniature size, biocompatibility, and multiplexing capability. However, their intrinsic cross-sensitivity—where both strain and temperature changes induce a shift in the reflected Bragg wavelength (Δλ_B)—must be resolved for accurate interpretation of physiological mechanical signals.
Core Sensing Principles & Cross-Sensitivity
The fundamental relationship for an FBG is given by: ΔλB / λB = (1 - pe)ε + (αΛ + α_n)ΔT Where:
λ_B: Bragg Wavelengthp_e: Photo-elastic coefficientε: Applied Strainα_Λ: Thermal expansion coefficient of the fiberα_n: Thermo-optic coefficientΔT: Temperature change
For in vivo use, discriminating between Δλ_B caused by mechanical load versus core body temperature fluctuations is essential.
Table 1: Comparison of In Vivo Biomechanical Sensing Modalities
| Sensor Type | Measurand | Typical Sensitivity | Key Advantage | Primary Cross-Sensitivity Challenge |
|---|---|---|---|---|
| FBG (Standard) | Strain, Pressure | 1.2 pm/με, ~0.1-1 nm/kPa | Multiplexing, MRI-compatible | Temperature (≈10 pm/°C) |
| FBG (Dual-Parameter) | Strain & Temp | Strain: 1.2 pm/με, Temp: 10 pm/°C | Simultaneous decoupling | Complex fabrication & calibration |
| Micro-Strain Gauge | Strain | 2.0+ mV/V (Gauge Factor) | High signal-to-noise | Temperature, hysteresis |
| Piezoelectric | Dynamic Force/Pressure | 10-100 pC/N | High frequency response | Static loads, temperature |
| Capacitive MEMS | Pressure, Force | 1-100 fF/kPa | Low power consumption | Stray capacitance, packaging stress |
Table 2: Reported Performance in Recent In Vivo Studies (2022-2024)
| Application | Sensor Type | Measurement Range | Accuracy / Resolution | Decoupling Method |
|---|---|---|---|---|
| Tendon Strain | Polymer-embedded FBG | ±5000 με | ±10 με | Reference FBG in temperature-only package |
| Intramuscular Pressure | FBG on Diaphragm | 0-200 mmHg | ±1 mmHg | Dual-wavelength FBG in single fiber |
| Cardiac Ablation Force | FBG Array (3-axis) | 0-1 N | ±0.02 N | Machine learning model using spectral shape |
| Cranial Bone Strain | Biocompatible FBG | -1000 to +500 με | ±5 με | Co-located thermocouple & compensation algorithm |
| Spinal Disc Pressure | FBG-MEMS Hybrid | 0-3 MPa | ±0.02 MPa | Integrated Fabry-Perot cavity for temperature |
Experimental Protocols for Key Investigations
Protocol 1: Decoupling Strain and Temperature in FBGs for Tendon Monitoring
Objective: To accurately measure tendon strain in a live animal model, compensating for core body temperature variations. Materials: See "The Scientist's Toolkit" (Section 6). Methodology:
- Sensor Preparation: Two FBGs are used. The sensing FBG is bonded to the tendon surface using a biocompatible, flexible adhesive (e.g., medical-grade silicone). The reference FBG is placed in a small, sealed, fluid-filled capsule adjacent to the tendon, isolating it from mechanical strain but exposed to the same thermal environment.
- Calibration: Prior to implantation, characterize both FBGs in a controlled chamber to determine their precise strain (Kε) and temperature (KT) coefficients.
- Implantation: Under aseptic surgical conditions, expose the target tendon. Adhere the sensing FBG along the tendon's longitudinal axis. Place the reference capsule in a nearby tissue pocket.
- Data Acquisition: Connect the optical fiber to an interrogator (e.g., 1 kHz sampling rate). Record baseline Δλ_B for both FBGs.
- Induced Activity: Subject the animal to controlled locomotion (e.g., treadmill).
- Calculation: Compute true strain (ε) using the matrix equation derived from the dual-coefficient model:
[Δλ_sens; Δλ_ref] = [K_ε_sens, K_T_sens; 0, K_T_ref] * [ε; ΔT]Solve for ε and ΔT via matrix inversion.
Protocol 2: Validating FBG-Based Intramuscular Pressure Measurement
Objective: To correlate FBG-derived pressure measurements with the clinical gold standard (solid-state transducer catheter). Methodology:
- FBG Sensor Fabrication: A miniature diaphragm (≈1 mm diameter) is bonded to a single FBG. Pressure deflects the diaphragm, applying strain to the FBG.
- Bench-top Validation: Place the FBG sensor and a reference pressure transducer in a sealed, temperature-controlled pressure chamber. Apply calibrated pressures (0-200 mmHg). Record Δλ_B versus reference pressure to derive a transfer function.
- In Vivo Co-Location: In an anesthetized large animal model (e.g., porcine), insert the reference transducer catheter into a target muscle (e.g., tibialis anterior). Using ultrasound guidance, insert the FBG pressure probe into the same muscle compartment within 5 mm of the catheter tip.
- Stimulation Protocol: Use electrical stimulation of the innervating nerve to induce muscle contraction at varying frequencies (1-20 Hz), generating physiological pressure changes.
- Data Analysis: Synchronize the FBG wavelength data and catheter voltage data. Apply the bench-derived transfer function to convert Δλ_B to pressure. Perform Bland-Altman analysis to assess agreement between the two methods.
Signaling Pathways & Workflow Visualizations
The Scientist's Toolkit: Research Reagent Solutions
Table 3: Essential Materials for In Vivo FBG Biomechanics Research
| Item Name / Category | Supplier Examples | Function & Critical Notes |
|---|---|---|
| Polyimide-Coated FBG Arrays | TechnicaSA, FBGS, Micron Optics | Standard sensor; polyimide coating provides robust strain transfer and biocompatibility for short-term implants. |
| Bio-Inert Silicone Encapsulant | NuSil MED-621, Dow Silastic | Encapsulates FBG for long-term implants, provides mechanical coupling to tissue while ensuring biocompatibility and insulation. |
| High-Speed Optical Interrogator | Luna ODiSI, HBM fs5, Micron si255 | Captures dynamic Δλ_B at high frequency (≥1 kHz) essential for physiological events (e.g., gait, heartbeat). |
| Fluidic Pressure Calibration Chamber | Custom or Ellsworth Adapters | Provides controlled pressure environment (0-300 mmHg) for bench-top validation of pressure-sensitive FBG designs. |
| Dual-Parameter FBG (DFBG) | Alnair Labs, Proximion | Specialized grating (e.g., multi-core, combined FBG-LPG) enabling inherent strain-temperature discrimination. |
| Medical-Grade Cyanoacrylate | 3M Vetbond, Loctite 4011 | For rapid, secure adhesion of FBG to bone or tendon surfaces during acute in vivo experiments. |
| Finite Element Analysis Software | ANSYS, COMSOL | Models mechanical strain field on FBG and host tissue to optimize sensor placement and interpret complex data. |
| Motion Capture System | Vicon, OptiTrack | Synchronizes kinematic movement data with FBG strain data for comprehensive biomechanical analysis. |
This technical guide is framed within a broader thesis on Fiber Bragg Grating (FBG) sensor sensitivity to strain and temperature in healthcare research. The fundamental principle underpinning this work is the FBG's inherent dual sensitivity: a shift in the Bragg wavelength (λ_B) occurs due to both temperature change (ΔT) and applied strain (ε). This relationship is described by:
ΔλB / λB = (αζ + αf)ΔT + (1 - p_e)ε
where αζ is the thermo-optic coefficient, αf is the thermal expansion coefficient of the fiber, and p_e is the effective photo-elastic constant. In medical thermal therapies, this dual sensitivity presents both a challenge and an opportunity. The challenge lies in decoupling the two effects; the opportunity is the development of multi-parameter sensing systems for real-time, in vivo monitoring of thermal procedures, a critical unmet need in oncology and minimally invasive surgery.
Fundamentals of FBG Sensing for Thermal Therapy
FBGs are periodic modulations of the refractive index inscribed in the core of an optical fiber. They act as wavelength-specific mirrors, reflecting a narrow band of light centered at the Bragg wavelength. This λ_B is intrinsically sensitive to environmental perturbations.
Key Sensitivity Coefficients (Typical for Germanosilicate Fiber):
| Parameter | Symbol | Typical Value | Unit |
|---|---|---|---|
| Temperature Sensitivity | K_T | ~6.5 - 10 | pm/°C |
| Strain Sensitivity | K_ε | ~0.78 - 1.2 | pm/µε |
| Thermo-optic Coefficient | α_ζ | ~6.7 x 10^-6 | /°C |
| Photo-elastic Constant | p_e | ~0.22 | - |
For pure temperature sensing in hyperthermia (typically 42-60°C), the FBG is often mechanically decoupled (e.g., housed in a capillary tube). Recent research focuses on hybrid FBG designs (e.g., combination with Fabry-Perot cavities) or dual-wavelength grating structures to independently resolve strain and temperature simultaneously, which is vital for monitoring tool-tissue interaction forces during ablation.
Experimental Protocols for FBG-Based Thermal Monitoring
Protocol: In-Vitro Calibration of FBG for Ablation Monitoring
Objective: To characterize the temperature response of an FBG sensor in a tissue-mimicking phantom during radiofrequency (RF) ablation. Materials: Single-mode FBG (λ_B ~1550 nm), optical interrogator (1 pm resolution), RF ablation generator & probe, tissue-mimicking phantom (e.g., agar with NaCl for conductivity), thermocouple array (for validation), data acquisition system. Procedure:
- Sensor Preparation: The FBG is embedded within a sterile, biocompatible polyimide catheter. A reference thermocouple is fixed adjacent to the grating.
- Phantom Setup: The phantom is prepared to match the dielectric and thermal properties of liver tissue.
- Sensor Insertion: The FBG catheter and RF probe are inserted into the phantom at a fixed distance (e.g., 5 mm apart).
- Baseline Acquisition: Record baseline λ_B and temperature for 60 seconds.
- Ablation Cycle: Apply RF energy (e.g., 15W for 10 minutes). Simultaneously, record λ_B shifts and thermocouple readings at 10 Hz.
- Data Analysis: Plot λB shift vs. thermocouple temperature. Perform linear regression to determine the experimental KT. Create a 2D thermal map by using multiple FBGs in an array.
Protocol: FBG Integration into Surgical Tool for Force/Temperature Sensing
Objective: To instrument a surgical tool (e.g., biopsy needle, ablation probe) with FBGs for simultaneous contact force and tip temperature measurement. Materials: Surgical needle, two FBGs (FBG1, FBG2) with closely spaced but distinct λ_B, miniature epoxy, optical interrogator. Procedure:
- Grating Attachment: FBG1 is bonded axially along the needle shaft near the tip to sense bending strain (force). FBG2 is loosely inserted and potted in a tiny cavity at the very tip to be sensitive primarily to temperature.
- Decoupling Matrix: The system is calibrated in a controlled setup to apply known forces (via load cell) and temperature changes (via water bath). The resulting wavelength shifts are recorded: Δλ1 = K{T1}ΔT + K{ε1}ε Δλ2 = K{T2}ΔT + K{ε2}ε (where K_{ε2} ≈ 0)
- Matrix Inversion: The calibration data is used to create a 2x2 sensitivity matrix, allowing real-time decoupling of ΔT and ε (force) during surgery.
Table 1: Performance Metrics of FBG Systems in Recent Thermal Therapy Studies
| Application | FBG Configuration | Temp. Range | Accuracy | Spatial Resolution | Response Time | Key Advantage |
|---|---|---|---|---|---|---|
| Microwave Ablation Monitoring | 4-point array, PMMA coated | 25-90°C | ±0.5°C | 10 mm | < 500 ms | Multipoint, MRI-compatible |
| RF Ablation Catheter | Dual FBG (Temp/Force) | 30-95°C | ±0.7°C (Temp) ±0.1N (Force) | 5 mm (tip) | < 100 ms | Combined force & temp. feedback |
| Focused Ultrasound (FUS) | Single, gold-coated FBG | 37-60°C | ±0.2°C | 1 mm | ~50 ms | High resolution, immune to EM noise |
| Laser Interstitial Therapy | 7-FBG linear array | 40-85°C | ±0.3°C | 3.5 mm | < 200 ms | Real-time 3D thermal mapping |
Table 2: Comparison with Competing Thermometry Technologies
| Technology | Invasiveness | Spatial Resolution | Temporal Resolution | MRI Compatible? | Multiplexing Capability |
|---|---|---|---|---|---|
| FBG Array | Minimally invasive | High (mm) | Very High (ms) | Yes | Excellent (>>10 sensors) |
| Thermocouple | Invasive | Low (cm) | High (ms) | No | Poor |
| Infrared Imaging | Non-invasive | Medium (cm) | High (ms) | No | N/A |
| MR Thermometry | Non-invasive | High (mm) | Low (1-4 s) | Yes | N/A |
| Ultrasound Temp. Est. | Non-invasive | Low (cm) | Medium | Yes | N/A |
Visualization: Pathways and Workflows
Diagram Title: FBG Feedback Loop in Thermal Therapy Control System
Diagram Title: Experimental Workflow for FBG Surgical Tool Development
The Scientist's Toolkit: Research Reagent Solutions
Table 3: Essential Materials for FBG-Based Thermal Therapy Research
| Item | Function/Description | Example Specification/Note |
|---|---|---|
| FBG Optical Fiber | Core sensing element. | Germanosilicate, single-mode, polyimide coating for durability. |
| Optical Interrogator | Measures reflected Bragg wavelength shifts with high precision. | 1-5 pm wavelength resolution, >1 kHz sampling rate per channel. |
| Broadband Light Source | Provides optical power for the FBG array. | ASE source (e.g., C-band, 1520-1570 nm). |
| Biocompatible Sheathing | Protects FBG, ensures sterility and patient safety. | Medical-grade polyimide tubing or fluoropolymer catheter. |
| Tissue-Mimicking Phantom | Provides realistic medium for in-vitro testing. | Agar-based with NaCl (conductivity) or polyacrylamide gel. |
| Calibration Equipment | For characterizing KT and Kε. | Precision water bath (±0.1°C), micro-tensile stage. |
| Reference Thermometry | Validates FBG temperature readings. | Fluoroptic probes (MRI-safe) or calibrated thermocouples. |
| Surgical Tool Platform | For sensor integration and testing. | Biopsy needle, RF/Microwave ablation probe, or laparoscopic tool. |
| Data Acquisition Software | For real-time visualization and recording. | Custom LabVIEW or Python suite with decoupling algorithm. |
This whitepaper details the application of Fiber Bragg Grating (FBG) sensors in pharmaceutical development, framed within the broader thesis of FBG sensitivity to strain and temperature in healthcare research. FBGs are intrinsic sensor elements inscribed in optical fibers that reflect specific wavelengths of light. The Bragg wavelength (λB) shift (ΔλB) is linearly dependent on both strain (ε) and temperature change (ΔT), as described by: ΔλB / λB = (1 - pe)ε + (αΛ + αn)ΔT where pe is the photo-elastic coefficient, and αΛ and αn are thermal expansion and thermo-optic coefficients, respectively. This dual sensitivity must be decoupled for precise measurements, a core challenge in the discussed methodologies.
Core Sensing Principles and Sensitivity Decoupling
FBGs respond to physical and chemical changes in their environment. In drug delivery, these changes are transduced into measurable wavelength shifts.
Table 1: FBG Response Coefficients for Standard Silica Fiber
| Parameter | Symbol | Typical Value | Unit |
|---|---|---|---|
| Strain Sensitivity | K_ε | ~1.2 pm/με | pm/microstrain |
| Temperature Sensitivity | K_T | ~10 pm/°C | pm/°C |
| Gauge Factor | GF | ~0.78 | dimensionless |
| Thermo-optic Coefficient | α_n | 8.31 x 10^-6 | /°C |
Decoupling strain and temperature is critical. Common methods include:
- Dual-Grating Method: Using two FBGs with different responses (e.g., one bare, one packaged).
- Reference FBG: Placing a reference FBG in a strain-free, temperature-matched environment.
- FBG in Tension-Free Configuration: Isolating the sensor from mechanical strain.
Diagram Title: FBG Signal Decoupling Workflow for Drug Delivery Sensing
Experimental Applications and Protocols
Monitoring Drug Dissolution and Release Kinetics
Protocol: An FBG is coated with a thin layer of the drug formulation or embedded within a polymeric drug carrier (e.g., a tablet or microsphere). As the coating dissolves or the polymer degrades, the local refractive index (RI) and mechanical strain on the fiber change, inducing a λ_B shift.
- Sensor Preparation: Coat a standard telecom FBG (λB ~1550 nm) with a uniform layer of the drug-polymer matrix using dip-coating or spray coating. Measure initial thickness and λB.
- Calibration: Calibrate the FBG's RI sensitivity in solutions of known index (e.g., glycerol/water mixtures).
- Dissolution Test: Immerse the coated FBG in a dissolution bath (e.g., pH 7.4 PBS at 37°C, 50 rpm). Use an interrogation system to record λ_B at 1 Hz.
- Data Analysis: Correlate Δλ_B with dissolution profiles obtained via traditional UV spectroscopy. The rate of wavelength change correlates with dissolution rate.
Table 2: Sample FBG Dissolution Monitoring Data for a Model Polymer
| Time (min) | Δλ_B (pm) | UV Absorbance (AU) | Coating Thickness (μm) |
|---|---|---|---|
| 0 | 0 | 0.00 | 50.0 ± 2.1 |
| 10 | 45 ± 3 | 0.15 ± 0.02 | 42.5 ± 3.0 |
| 30 | 112 ± 5 | 0.41 ± 0.03 | 28.7 ± 2.5 |
| 60 | 205 ± 8 | 0.78 ± 0.04 | 10.2 ± 1.8 |
| 120 | 288 ± 10 | 0.95 ± 0.01 | 1.5 ± 0.5 |
Measuring Intraluminal Pressure in Swellable Devices
Protocol: FBGs are ideal for measuring small pressure changes in gastrointestinal tract simulators or within expanding drug-eluting stents.
- Sensor Packaging: Encapsulate an FBG in a flexible, fluid-filled capsule or attach it to the interior wall of a swellable hydrogel device. Pressure changes strain the capsule/device, transferring strain to the FBG.
- Pressure Calibration: Place the packaged sensor in a calibrated pressure chamber. Apply known pressures (0-200 mmHg) and record Δλ_B to establish a linear sensitivity coefficient (pm/mmHg).
- In Vitro Testing: Deploy the sensor in a simulated gastric or intestinal environment. Monitor real-time pressure changes as the device swells, erodes, or undergoes peristalsis.
Characterizing Structural Dynamics of Delivery Systems
Protocol: FBG arrays (multiple gratings on one fiber) map strain distribution along implantable scaffolds or microneedles.
- Array Fabrication: Inscribe an array of 5-10 FBGs with 10 mm spacing on a single fiber.
- Integration: Embed the array into a biodegradable polymer scaffold or attach it to the base of a microneedle patch.
- Mechanical Testing: Subject the system to controlled compression, bending, or hydration in a tensile stage. The interrogation system tracks each FBG independently.
- Dynamic Mapping: Generate 2D strain maps over time to identify points of structural failure, uneven swelling, or deformation.
Diagram Title: Unified Experimental Workflow for FBG Drug Delivery Applications
The Scientist's Toolkit: Research Reagent Solutions
Table 3: Essential Materials for FBG-based Drug Delivery Research
| Item | Function & Specification | Example Vendor/Product |
|---|---|---|
| FBG Interrogator | High-resolution (≤1 pm) device to measure λ_B shifts in real-time. Essential for dynamic monitoring. | Micron Optics sm125, FBGS Technologies interrogators, Ibsen Photonics I-MON series. |
| Single-Mode Optical Fiber with FBG Arrays | The core sensor. Arrays allow multipoint sensing. Standard telecom (1550 nm) or custom wavelengths. | FBGS Technologies, TechnicaSA, Oz Optics. |
| Dip-Coater | For applying uniform polymeric or drug-coating layers onto FBGs with controlled thickness. | Nadetech Innovations, KSV Nima. |
| Dissolution Apparatus | USP-compliant bath (e.g., Apparatus 2) for standardized testing under controlled pH, temperature, and agitation. | Distek, Sotax, Agilent. |
| Programmable Pressure Chamber | For calibrating pressure sensitivity of packaged FBG sensors. | Ellab, STL. |
| Biocompatible Polymer Coatings | Hydrogels (e.g., HPMC, PVA) or biodegradable polymers (PLGA, PCL) to functionalize FBGs for specific applications. | Sigma-Aldrich, Lakeshore Biomaterials. |
| Refractive Index Calibration Kits | Pre-mixed solutions of known RI (e.g., sucrose, glycerol) for sensor calibration. | Cargille Labs, Mettler Toledo. |
| Temperature-Controlled Stage/Chamber | For precise thermal management and decoupling experiments. | Linkam, Instec. |
Table 4: Performance Comparison of FBG Sensing Modalities in Drug Delivery
| Sensing Modality | Measurand | Typical Δλ_B Range | Resolution | Key Advantage | Primary Challenge |
|---|---|---|---|---|---|
| Dissolution (RI-Based) | Coating Thickness / RI Change | 100 - 2000 pm | ~5 pm | Real-time, label-free kinetics. | Decoupling RI from temperature effects. |
| Intraluminal Pressure | Hydrostatic Pressure (e.g., in GI tract) | 50 - 500 pm (per 50 mmHg) | <1 pm | Miniature, biocompatible, high sensitivity. | Packaging integrity and hysteresis. |
| Structural Strain (Scaffold) | Microstrain (με) | 1.2 pm/με | ±1 με | Multipoint mapping on a single fiber. | Complex integration without structural compromise. |
| Temperature (Reference) | Temperature Change (°C) | 10 pm/°C | ±0.1 °C | Accurate thermal monitoring for decoupling. | Requires isolation from mechanical strain. |
FBG sensors offer a versatile, precise, and real-time platform for monitoring critical parameters in drug delivery systems. By effectively decoupling their inherent strain and temperature sensitivities, researchers can extract unambiguous data on dissolution profiles, pressure dynamics, and structural integrity. This technical guide outlines the methodologies and tools necessary to integrate FBG sensing into pharmaceutical development workflows, advancing the broader thesis of leveraging precise physical sensor technology for healthcare innovation.
Enhancing Reliability: Troubleshooting Signal Noise, Drift, and Packaging for Clinical Environments
Within healthcare research, the precise measurement of physiological parameters using Fiber Bragg Grating (FBG) sensors is paramount. Applications range from monitoring biomechanical strain in orthopedic implants to detecting minute temperature variations in localized drug delivery studies. The core thesis of this work posits that the ultimate sensitivity and utility of FBG sensors in strain and temperature measurement are not limited by fundamental physical principles alone, but are critically constrained by three dominant, practical noise sources: inherent thermal fluctuations, mechanical crosstalk, and instrumental limitations of the optical interrogator. This guide provides a technical framework for identifying, quantifying, and mitigating these noise sources to enhance data fidelity in biomedical sensing.
The following tables consolidate key noise characteristics and their impact on FBG sensor performance in a biomedical context.
Table 1: Characterization of Primary FBG Noise Sources
| Noise Source | Physical Origin | Typical Magnitude in Healthcare Context | Primary Impact on FBG Signal |
|---|---|---|---|
| Thermal Fluctuations | Brownian motion of sensor/medium molecules. | ±0.1°C to ±0.5°C (ambient); ±0.01°C (controlled). | Wavelength jitter (Δλ), mimics true temperature/strain. |
| Mechanical Crosstalk | Multi-axial strain coupling in compliant substrates (e.g., tissue, hydrogel). | Strain error up to 10-20 µε per 100 µε axial strain. | False strain reading, reduced axial selectivity. |
| Interrogator Limitations | Laser source phase noise, detector shot noise, sampling rate limits. | Δλ resolution: 1 pm (good) to 10 pm (standard). | Limits minimum detectable signal, introduces drift. |
Table 2: Mitigation Strategies and Efficacy
| Mitigation Strategy | Target Noise Source | Implementation Method | Typical Noise Reduction Achieved |
|---|---|---|---|
| Dual-Parameter Sensing | Thermal Fluctuations | Use two FBGs (or one specialized grating) to decouple strain & temperature. | Can separate effects to ±0.1°C, ±1 µε. |
| Substrate Engineering | Mechanical Crosstalk | Optimize sensor embedding (stiffness matching, orientation) in tissue simulants. | Crosstalk reduction by 50-70%. |
| Synchronous Referencing | Interrogator Drift | Use a reference FBG in a controlled environment on the same interrogator channel. | Reduces low-frequency drift by >90%. |
| Advanced Signal Processing | All (esp. Thermal & Interrogator) | Implement Kalman filtering or wavelet denoising on wavelength shift data. | SNR improvement of 10-20 dB. |
Experimental Protocols for Noise Identification
Protocol 1: Isolating Thermal Fluctuation Noise in a Bioreactor
- Objective: To characterize the inherent thermal noise floor of an FBG sensor in a physiologically relevant, temperature-controlled fluid environment.
- Materials: Single FBG (acrylate recoated), optical interrogator (1 pm resolution), precision water bath/bioreactor (stability ±0.01°C), data acquisition PC.
- Method:
- Immerse the FBG sensor in the bioreactor filled with phosphate-buffered saline (PBS) at 37.0°C.
- Allow the system to stabilize for 60 minutes.
- Record the FBG center wavelength (λB) at 1 kHz sampling for 300 seconds while maintaining the set temperature.
- Calculate the standard deviation (σ) of the λB time-series. Convert σ to effective temperature noise using the sensor's temperature sensitivity coefficient (typically ~10 pm/°C). This value represents the system's thermal fluctuation noise floor.
Protocol 2: Quantifying Mechanical Crosstalk in a Tissue Simulant
- Objective: To measure strain measurement error induced by transverse loading, simulating off-axis physiological forces.
- Materials: FBG array embedded in a polydimethylsiloxane (PDMS) slab (mimicking soft tissue), uniaxial tensile tester, optical interrogator, 3D-printed fixture for transverse compression.
- Method:
- Mount the PDMS-embedded FBG sample in the tensile tester.
- Apply a known, pure axial strain (e.g., 500 µε) and record the FBG wavelength shift (Δλaxial).
- Return to zero strain. Apply a known transverse compressive stress via the side fixture.
- Record the induced apparent wavelength shift (Δλtransverse) despite near-zero axial strain.
- Calculate the crosstalk ratio as: (Δλtransverse / SensitivityStrain) / AppliedTransverseStress.
Protocol 3: Benchmarking Interrogator Stability
- Objective: To separate instrument drift from physiological signal in long-term monitoring.
- Materials: Two identical FBGs, optical interrogator, one temperature-stabilized reference chamber.
- Method:
- Place FBG #1 (sensing) in the test environment (e.g., cell culture incubator).
- Place FBG #2 (reference) inside the stable reference chamber at a fixed temperature.
- Connect both FBGs to separate channels of the same interrogator.
- Record concurrent wavelength data from both sensors over the intended experiment duration (e.g., 24 hours).
- The drift in the reference FBG signal is a direct measure of interrogator instability. This can be subtracted from the sensing FBG signal.
Visualizing Relationships and Workflows
Title: Noise Source to Mitigation Pathway
Title: Experimental Noise Identification Workflow
The Scientist's Toolkit: Research Reagent Solutions
Table 3: Essential Materials for FBG Noise Characterization Experiments
| Item | Function in Experiment | Example/Specification |
|---|---|---|
| FBG Sensors (Acrylate Recoated) | Primary sensing element; biocompatible coating suitable for fluid/tissue contact. | λ_B = 1550 nm, gauge length: 5-10 mm, strain sensitivity: ~1.2 pm/µε, temp. sensitivity: ~10 pm/°C. |
| Polydimethylsiloxane (PDMS) | Tissue simulant substrate for embedding sensors to study mechanical crosstalk and biocompatibility. | Sylgard 184, tunable Young's modulus (0.1-3 MPa) to mimic various tissues. |
| Phosphate-Buffered Saline (PBS) | Isotonic solution for creating physiologically relevant fluid environments in thermal noise tests. | 1X, pH 7.4, sterile-filtered. |
| Optical Interrogator | Instrument to illuminate FBGs and detect wavelength shifts with high precision. | Key specs: Resolution (<1 pm), sampling rate (>100 Hz), wavelength range (e.g., C-band). |
| Temperature-Calibrated Reference Chamber | Provides a stable thermal environment for hosting reference FBGs to isolate interrogator drift. | Stability: ±0.01°C over 24 hours. |
| Calibrated Uniaxial Tester | Applies precise, quantifiable mechanical strain to sensor-substrate composites. | Load cell capacity: 10N, displacement resolution: 1 µm. |
| Kalman Filtering Software | Algorithmic tool for real-time or post-processed denoising of time-series wavelength data. | Implementable in MATLAB, Python (SciPy), or LabVIEW. |
1. Introduction
In the pursuit of advanced biomedical sensing, Fiber Bragg Grating (FBG) sensors offer unparalleled precision for in vivo strain and temperature monitoring, critical for applications from orthopedic implant tracking to cardiovascular pressure sensing. The core thesis of this field is that the intrinsic sensitivity of an FBG to strain and temperature must be preserved while the sensor is transformed into a robust, biocompatible device that can withstand the physiological environment. This technical guide details the materials, strategies, and experimental protocols that reconcile these competing demands of protection, sensitivity, and biocompatibility.
2. Core Material Systems for Packaging & Encapsulation
The choice of encapsulation material is dictated by the application's mechanical, chemical, and biological requirements. Key material systems are summarized below.
Table 1: Primary Encapsulation Material Systems for FBG Sensors
| Material Class | Specific Materials | Typical Thickness/Diameter | Key Properties | Primary Trade-off |
|---|---|---|---|---|
| Polymeric | Polydimethylsiloxane (PDMS), Polyimide, Epoxy, Parylene-C | 50 µm – 500 µm coating | Flexibility, tunable modulus, good biocompatibility, easy processing. | Permeability to fluids over time, potential for creep under constant load. |
| Metallic | Stainless Steel 316L, Nitinol, Titanium tubes | 100 µm – 300 µm wall thickness | Excellent barrier, high strength, established bioinertness. | High stiffness can shield strain, significant thermal mass affects response time, complex integration. |
| Ceramic/Hybrid | Alumina (Al₂O₃), Zirconia, Glass capillaries | 50 µm – 200 µm wall | Superior chemical inertness, excellent barrier properties, high-temperature stability. | Brittleness, challenging fiber bonding, and integration. |
| Hydrogels | PEG-based, Alginate, Hyaluronic Acid | 0.5 mm – 2 mm | High water content mimics tissue, excellent biocompatibility & biointegration. | Very low modulus, poor barrier, can swell and induce drift. |
3. Experimental Protocols for Key Evaluations
Protocol 3.1: Sensitivity Calibration Post-Encapsulation Objective: Quantify the change in strain (Δε/Δλ) and temperature (ΔT/Δλ) sensitivity of an FBG after packaging. Materials: Optical interrogator, temperature-controlled chamber, micrometre translation stage, packaged FBG sensor, bare FBG reference. Procedure:
- Mount the packaged FBG and a bare FBG reference on a common stage inside the temperature chamber.
- For Strain Sensitivity: Use the translation stage to apply known displacements (e.g., 0-500 µε in 100 µε steps). Record the Bragg wavelength shift (Δλ) for both sensors at each step at a constant temperature.
- For Temperature Sensitivity: Stabilize the chamber at temperatures from 25°C to 45°C in 5°C increments. Record Δλ for both sensors at each equilibrium point with no applied strain.
- Calculate sensitivity coefficients by linear regression of Δλ vs. applied strain (or temperature). Compare packaged vs. bare FBG coefficients.
Protocol 3.2: Accelerated Aging & Biostability Test (ASTM F1980) Objective: Assess long-term stability and barrier efficacy of encapsulation in simulated physiological conditions. Materials: Packaged FBG sensors, phosphate-buffered saline (PBS) at pH 7.4, controlled-temperature bath at 70°C, optical interrogator. Procedure:
- Immerse packaged FBG sensors in PBS pre-heated to 70°C. This temperature accelerates degradation kinetics (using the Arrhenius model, 70°C approximates 6-12 months at 37°C in ~30 days).
- Extract sensors at scheduled intervals (e.g., 1, 7, 14, 30 days).
- Rinse with deionized water, dry, and repeat Protocol 3.1 for sensitivity calibration.
- Monitor for Bragg wavelength drift at a reference temperature, changes in reflected amplitude (indicating microbend losses), and visual degradation under microscopy.
Protocol 3.3: Cytotoxicity Assay (ISO 10993-5) Objective: Evaluate the biocompatibility of encapsulation materials via indirect contact. Materials: Extract of encapsulation material (prepared per ISO 10993-12), L929 fibroblast cells, cell culture media, multi-well plate, MTT assay kit. Procedure:
- Prepare an extract by incubating the sterile encapsulation material in cell culture media (e.g., 3 cm²/mL) for 24±2h at 37°C.
- Seed L929 cells in a 96-well plate and allow to attach for 24h.
- Replace culture media with the material extract (test group), fresh media (negative control), and media with a known cytotoxic agent (positive control).
- Incubate for 24-48h. Perform MTT assay: add MTT reagent, incubate to allow formazan crystal formation by viable cells, solubilize crystals, and measure absorbance at 570 nm.
- Calculate cell viability as a percentage of the negative control. Viability >70% typically indicates passing the test.
4. Critical Pathways in Packaging Design
Diagram Title: Packaging Design Decision Pathway for FBG Sensors
5. Experimental Workflow for Sensor Development
Diagram Title: FBG Sensor Development & Validation Workflow
6. The Scientist's Toolkit: Research Reagent Solutions
Table 2: Essential Materials for FBG Packaging Research
| Item Name | Supplier Examples | Function in Research |
|---|---|---|
| Polyimide-Coated FBG | Technica, FBGS Technologies, Micron Optics | Provides a robust, primary protective layer, enhancing handling strength and acting as a substrate for secondary encapsulation. |
| Medical-Grade Silicone Elastomer (PDMS) | NuSil Technology, Dow Silicones | The gold-standard polymeric encapsulant for flexible, biocompatible coatings; allows modulus tuning via base:curing agent ratio. |
| Bio-epoxy (e.g., EP62-1) | Masterbond | Used for hermetically sealing FBGs inside metallic or ceramic capillaries; offers high-strength, stable bonds. |
| Nitinol Micro-tubes | Memry Corporation, Fort Wayne Metals | Used as a superelastic, biocompatible sheath for strain sensors in dynamic environments (e.g., tendons, stents). |
| Parylene-C Deposition Service | Specialty Coating Systems, Para Lab | Provides conformal, pinhole-free chemical vapor deposition (CVD) coating for ultra-thin, insulating barrier layers. |
| Optical Interrogator | Luna Innovations, Micron Optics, FAZ Technology | The core instrument for high-resolution (pm-scale) Bragg wavelength measurement, enabling strain/temperature readout. |
| Simulated Body Fluid (SBF) | Biorelevant.com, prepared in-lab per Kokubo recipe | Used for in vitro degradation and biomineralization studies to predict long-term implant stability. |
| MTT Cell Viability Assay Kit | Thermo Fisher Scientific, Abcam, Sigma-Aldrich | Standard colorimetric kit for quantifying material cytotoxicity per ISO 10993-5 guidelines. |
Within the critical thesis of understanding Fiber Bragg Grating (FBG) sensor sensitivity to strain and temperature for in vivo healthcare monitoring, long-term signal stability is the paramount challenge. Chronic implantation for drug efficacy studies or physiological monitoring introduces complex drift phenomena, confounding the accurate decoupling of mechanical and thermal signals. This guide details advanced protocols to characterize, calibrate, and compensate for drift, ensuring data fidelity over extended periods.
Core Drift Mechanisms in Chronic FBG Implantation
Signal drift in chronically implanted FBGs stems from multiple, often concurrent, mechanisms. Primary factors include:
- Polymer Creep/Relaxation: Viscoelastic behavior of polymer coatings or adhesives under constant strain.
- Biofouling: Progressive protein adsorption and cellular adhesion on the sensor surface, applying non-physiological strain.
- Hydrolysis & Swelling: Water ingress into coating materials, altering their refractive index and mechanical properties.
- Material Degradation: Oxidation or chemical breakdown of fiber coatings in vivo.
- Temperature-Humidity Cross-Sensitivity: A complex interplay beyond standard temperature compensation.
Pre-Implantation Characterization & Baseline Calibration Protocols
Protocol 3.1: Accelerated Aging for Drift Potential Assessment
Objective: Predict long-term drift behavior through controlled, accelerated environmental stress. Methodology:
- Sample Preparation: Multiple FBG sensors are pre-tensioned (e.g., 500-1000 µε) and mounted in fixtures simulating implantation strain.
- Environmental Chambers: Sensors are subjected to controlled cycles in climate chambers.
- Condition A: 37°C, 95% Relative Humidity (RH), saline (PBS) immersion for 7 days.
- Condition B: Thermal cycling between 25°C and 45°C (4-hour cycle) at 80% RH for 14 days.
- Data Acquisition: Bragg wavelength (λ_B) is monitored continuously or at high frequency (e.g., every minute) using an optical interrogator.
- Analysis: Drift rate (pm/hour) is calculated from the temporal λ_B shift under constant mechanical load.
Protocol 3.2: Dual-Parameter Sensitivity Matrix Calibration
Objective: Establish precise, individual sensor coefficients for strain (Kε) and temperature (KT) to form a baseline for drift detection. Methodology:
- Strain Coefficient (Kε): Sensor is fixed in a calibrated micro-strain stage. Apply known strains (e.g., -1000 to +1000 µε in 250 µε steps) in a temperature-controlled environment (T=25.0±0.1°C). Record λB at each step. K_ε (pm/µε) is derived from the slope of the linear regression.
- Temperature Coefficient (KT): Sensor is placed strain-free in a thermal chamber. Temperature is varied (e.g., 20°C to 45°C in 5°C steps) and allowed to stabilize. Record λB. K_T (pm/°C) is derived from the slope.
Table 1: Example Pre-Implantation Calibration Coefficients for Different FBG Configurations
| FBG Type / Coating | Strain Sensitivity, K_ε (pm/µε) | Temperature Sensitivity, K_T (pm/°C) | Drift Rate in Accelerated Aging (pm/day @ 37°C, 95% RH) |
|---|---|---|---|
| Standard Silica (125 µm) | ~1.2 | ~10.0 | < 5 |
| Polyimide-Coated | ~1.2 | ~10.5 | 10 - 30 |
| Ormocer-Coated | ~1.2 | ~9.8 | 5 - 15 |
| Embedded in Silicone | 0.8 - 1.0* | 12.0 - 15.0* | 20 - 100 |
*Coefficients are effective values influenced by the host material.
In VivoCalibration & Drift Compensation Strategies
Protocol 4.1: The Reference Gratings Method
Objective: Isolate the drift component by using an isolated reference FBG on the same implant. Methodology:
- Sensor Design: A multi-FBG array is fabricated where one grating ("sensing FBG") is coupled to the tissue, while an adjacent "reference FBG" is isolated within a hermetically sealed, strain-free but thermally conductive capillary.
- Implantation: Both FBGs are implanted in close proximity.
- Signal Processing: Wavelength shifts from the reference FBG (Δλref) are attributed solely to temperature and inherent fiber drift. The sensing FBG shift (Δλsense) contains strain, temperature, and drift. Compensated strain (εcomp) is calculated as:
ε_comp = [Δλ_sense - (Δλ_ref * (K_T_sense / K_T_ref))] / K_εwhere KT values are from pre-calibration.
Protocol 4.2: Periodic Zero-Strain Reference Events
Objective: Leverage physiological quiescence periods to establish in vivo baseline drift. Methodology: For sensors monitoring cyclic phenomena (e.g., cardiac strain, joint flexion), the minimum point in each cycle is assumed to represent a consistent "zero-strain" state. A long-term drift curve is constructed by tracking the λ_B at this point over days/weeks. This drift model is then subtracted from all raw data.
Long-Term Stability Data from Chronic Studies
Table 2: Reported Long-Term Stability of FBG Sensors in Animal Models
| Implantation Site (Model) | Sensor Configuration | Duration | Reported Drift (Compensated) | Key Compensation Method Used |
|---|---|---|---|---|
| Bone (Ovine) | FBG in bone screw | 12 months | < ±10 µε | Reference FBG + thermal model |
| Tendon (Ovine) | Polyimide FBG on suture | 6 months | ~ ±25 µε | Periodic zero-strain (joint extension) |
| Cardiac Tissue (Murine) | Silica FBG on epicardium | 8 weeks | ±15 µε | Dual-parameter matrix with ex vivo recalibration |
| Intracranial Pressure (Porcine) | FBG in fluid-filled catheter | 4 months | < 0.5 mmHg | Hermetic packaging + in situ zeroing port |
The Scientist's Toolkit: Research Reagent Solutions
Table 3: Essential Materials for Drift Mitigation Research
| Item / Reagent | Function in Drift Mitigation Research |
|---|---|
| Ormocer Coating | Hybrid organic-inorganic coating offering superior hydrolytic stability and reduced biofouling compared to polyimide. |
| Hermetic Metal-Coated FBGs | Gold or aluminum coating provides a moisture barrier, eliminating hydrolysis-driven drift. Essential for reference gratings. |
| Biocompatible Silicone Encapsulants (e.g., MED-6217) | Used to isolate the sensor from direct biological strain due to fibrotic encapsulation, creating a more predictable mechanical interface. |
| Phosphate-Buffered Saline (PBS) | Standard solution for in vitro accelerated aging tests to simulate the ionic environment of the body. |
| Albumin & Fibrinogen Solutions | Used in in vitro biofouling studies to model the protein adsorption phase of the foreign body response. |
| Optical Interrogator (High Stability) | Device with pm-level precision and low inherent drift (e.g., <1 pm over 24 hours) to distinguish instrument noise from sensor drift. |
| Programmable Climate Chamber | Enables precise temperature and humidity cycling for accelerated aging protocols (Protocol 3.1). |
Visualized Workflows & Relationships
Title: Overall Workflow for Managing FBG Signal Drift
Title: Core In Vivo Drift Compensation Pathways
Within the broader thesis exploring Fiber Bragg Grating (FBG) sensor sensitivity to strain and temperature for biomedical applications, this technical guide addresses the critical engineering challenge of multiplexing. As demand grows for high-density, multi-point sensing arrays in healthcare research—from organ-on-a-chip biomechanical monitoring to in vivo pressure mapping—system performance is fundamentally limited by channel density and inter-channel crosstalk. This whitepaper details the origins of these multiplexing challenges, presents quantitative comparisons of mitigation strategies, and provides standardized experimental protocols for crosstalk characterization, enabling researchers to design robust sensing systems for drug development and physiological study.
Fiber Bragg Gratings are wavelength-encoded sensors, making wavelength-division multiplexing (WDM) and time-division multiplexing (TDM) natural choices for creating sensor arrays. In healthcare research, a single optical fiber may be instrumented with dozens of FBGs to monitor distributed strain in tissue-engineered constructs, temperature gradients in microfluidic drug synthesis devices, or pressure profiles on prosthetic interfaces. However, increasing the number of gratings on a single fiber strand introduces competing constraints: grating density, source bandwidth, detector resolution, and the physical overlap of reflected spectra leading to erroneous readings—termed spectral crosstalk. This guide deconstructs these challenges, providing a framework for optimal array design.
Quantitative Analysis of Crosstalk Origins and Impact
Crosstalk in FBG arrays manifests primarily as spectral crosstalk (overlap of adjacent Bragg wavelengths under strain/temperature shift) and system-induced crosstalk (non-linearities in light sources and detectors). The following table summarizes key parameters and their quantitative influence.
Table 1: Primary Sources of Crosstalk in Dense FBG Arrays
| Parameter | Typical Range in Biotech Arrays | Impact on Crosstalk | Mathematical Relationship |
|---|---|---|---|
| Grating Spacing (WDM) | 0.5 - 3.0 nm | Direct determinant of spectral free range. | Δλ_min = Δλ_strain + Δλ_temp + 3σ |
| FBG Reflection Bandwidth (FWHM) | 0.1 - 0.3 nm | Broader bandwidth increases overlap risk. | Overlap ∝ (Bandwidth / Grating Spacing) |
| Strain Sensitivity (λ_B @ 1550nm) | ~1.2 pm/µε | Higher sensitivity reduces usable strain range before overlap. | Δλ_strain = 1.2 pm * Δε |
| Temperature Sensitivity (λ_B @ 1550nm) | ~10 pm/°C | Dominant driver of shift in physiological environs. | Δλ_temp = 10 pm * ΔT |
| Source Stability | ±5 pm (typ.) | Drift can artificially induce/broaden peaks. | Adds in quadrature to system noise. |
| Detector Resolution (OSA/Interrogator) | 1 - 5 pm | Limits ability to resolve closely spaced peaks. | Limits measurable Δλ_min. |
Table 2: Comparison of Multiplexing Techniques for Healthcare Applications
| Technique | Max Sensors per Fiber | Key Advantage for Biomedicine | Primary Crosstalk Mechanism | Typical Crosstalk Level |
|---|---|---|---|---|
| Wavelength Division (WDM) | 20-40 | Simplicity, real-time readout all sensors. | Spectral overlap. | -35 to -40 dB |
| Time Division (TDM) | 50-100 | High sensor count, identical FBG λ_B possible. | Rayleigh backscatter, coherence noise. | -30 to -35 dB |
| Spatial Division (SDM) | 100+ (multi-core fiber) | Extreme density, inherent crosstalk isolation. | Inter-core coupling. | -40 to -50 dB |
| Hybrid WDM/TDM | 100-500 | Scalability for whole-organ sensing networks. | Combined spectral & temporal. | -30 to -40 dB |
Experimental Protocols for Crosstalk Characterization and Mitigation
Protocol 1: Characterizing Spectral Crosstalk in a WDM Array
Objective: Quantify the degree of signal leakage from one FBG channel into an adjacent channel under simulated physiological strain/temperature cycles.
Materials: FBG array (4+ sensors, WDM spaced), tunable laser source or broadband source with interrogator, precision temperature chamber, calibrated micro-strain stage, optical circulator, high-resolution optical spectrum analyzer (OSA).
Procedure:
- Baseline Acquisition: Isolate Sensor A in the array. Place the entire array in a temperature-stable, strain-free environment. Record the reflected spectrum of Sensor A (λA) and the adjacent Sensor B (λB) using the OSA with 1 pm resolution.
- Controlled Perturbation: Subject only Sensor A to a known stimulus using the micro-strain stage (e.g., 500 µε) or temperature chamber (e.g., 5°C ΔT). Ensure Sensor B remains mechanically and thermally isolated.
- Signal Measurement: Record the full reflected spectrum again. Precisely measure the peak wavelength shift Δλ_A for Sensor A.
- Crosstalk Calculation: At the original wavelength position of the isolated Sensor B (λB), measure the change in reflected power (ΔPB). Spectral crosstalk (CT) in decibels is calculated as:
CT_AB = 10 * log10(ΔP_B / ΔP_A)where ΔPA is the power change at the shifted λA. - Iterate: Repeat for all sensor pairs in the array. Plot crosstalk vs. wavelength separation.
Protocol 2: Validating a TDM Array for Dynamic Physiological Sensing
Objective: Ensure time-domain multiplexed arrays can accurately track rapid, independent strain events mimicking physiological signals (e.g., pulse wave, muscle contraction) without temporal crosstalk.
Materials: TDM FBG array (identical λ_B), pulsed laser source, high-speed photodetector, data acquisition (DAQ) system >1 MHz, two independent piezoelectric actuators.
Procedure:
- System Synchronization: Synchronize the pulsed laser trigger with the DAQ sampling clock. Map the time-delayed return pulses to specific FBG sensors (S1, S2... Sn).
- Independent Actuation: Attach Piezo Actuator 1 to FBG S1 and Actuator 2 to FBG S2. Program Actuator 1 with a slow sinusoidal waveform (0.5 Hz) and Actuator 2 with a fast sinusoidal waveform (10 Hz).
- Data Acquisition: Record the time-series strain data from all FBG channels for 20 seconds.
- Frequency Analysis: Perform a Fast Fourier Transform (FFT) on the reconstructed signal from the slow sensor channel (S1).
- Crosstalk Quantification: Identify the amplitude of the 10 Hz signal (from S2) present in the S1 channel. Temporal crosstalk is the ratio of this parasitic amplitude to the true 10 Hz amplitude in the S2 channel, expressed in dB.
The Scientist's Toolkit: Essential Research Reagents & Materials
Table 3: Key Reagent Solutions and Materials for FBG Array Research
| Item | Function in Experiment | Specification Notes for Healthcare Research |
|---|---|---|
| Polyimide-Coated FBG Arrays | Primary sensing element. | Biocompatible coating preferred for in vitro bio-integration; enhances strain transfer. |
| Optical Interrogator | Measures reflected wavelength shifts. | Resolution <5 pm, scan rate >100 Hz for dynamic physiological signals. |
| Temperature-Controlled Microfluidic Chamber | Provides stable thermal environment or thermal cycling. | ±0.1°C stability for isolating strain effects; biocompatible fluid paths. |
| Bio-Compatible Epoxy (e.g., OG146) | Adheres FBG to biological substrates (tissue, polymer scaffolds). | Low cytotoxicity, low shrinkage, flexible after cure to avoid stress induction. |
| Strain Calibration Stage (Piezoelectric or Motorized) | Applies precise, known micro-strain to FBG. | Sub-micron resolution, capable of cyclic loading at physiological frequencies (0-20 Hz). |
| Index Matching Gel | Suppresses spurious reflections at fiber connectors. | Non-corrosive, stable viscosity to maintain signal integrity in long-term studies. |
| Optical Circulator/Isolator | Directs light to/from FBG array; prevents back-reflections. | Low insertion loss (<1.5 dB), high isolation (>40 dB) to protect the source. |
Advanced Mitigation Strategies and Future Directions
Emerging techniques to suppress crosstalk include advanced grating designs (chirped, phase-shifted) for narrower bandwidths, machine learning algorithms for real-time spectral peak discrimination, and the use of multi-core specialty fibers for intrinsic spatial separation. For the healthcare researcher, the choice of multiplexing architecture must balance the required spatial resolution, temporal bandwidth, and the physiologically relevant range of strain and temperature. Robust characterization using the provided protocols is essential for validating sensor performance before deployment in critical drug development or clinical research applications.
This whitepaper addresses a core tenet of the broader thesis: Understanding and decoupling the inherent sensitivity of Fiber Bragg Grating (FBG) sensors to both strain and temperature is the fundamental challenge that must be overcome to enable their precise application in vivo. The clinical utility of FBGs in healthcare research is not realized through a universal design but through meticulous optimization for specific biomechanical and thermal environments. This guide details the technical considerations, experimental validations, and tailored designs required to deploy FBGs as sensitive, specific, and reliable interfaces for cardiovascular, orthopedic, and neurological targets.
Core Principles: Strain-Temperature Discrimination
The Bragg wavelength shift (ΔλB) is given by: ΔλB / λB = (1 - pe)ε + (αΛ + αn)ΔT where pe is the strain-optic coefficient, ε is strain, αΛ is the thermal expansion coefficient, and α_n is the thermo-optic coefficient.
Successful interface design requires strategies to isolate the measurand of interest (e.g., pressure, force, neural activity) from artifacts.
Target-Specific FBG Optimization
Cardiovascular Interfaces
- Clinical Target: Continuous intracardiac and intravascular pressure monitoring (e.g., in LVAD patients, post-TAVR), detection of restenosis.
- Primary Signal: Pressure (transmural, blood).
- Key Challenges: Pulsatile, high-magnitude strain; dynamic temperature shifts from blood flow; miniaturization for catheter integration; biocompatibility and hemocompatibility.
- Design & Optimization:
- Transduction: Embed FBG in a soft, compliant polymer (e.g., medical-grade silicone, polyurethane) diaphragm or membrane. Pressure induces membrane strain, transferred to the FBG.
- Temperature Compensation: Use a reference FBG in proximity, isolated from strain but exposed to same thermal environment. Dual-FBG differential measurement is critical.
- Packaging: Hermetic, thromboresistant coating (e.g., phosphorylcholine polymer, heparinized coatings) to prevent fibrin deposition and signal drift.
Orthopedic Interfaces
- Clinical Target: In-vivo load monitoring in joint replacements (knee, hip), spinal fusion constructs, and fracture healing plates.
- Primary Signal: Static and dynamic load/force, strain distribution.
- Key Challenges: High-strain environments (microstrain to millistrain); long-term cyclic fatigue; integration with metallic implants; biocompatibility in bone milieu.
- Design & Optimization:
- Transduction: Direct embedding of FBG arrays within the polymer (e.g., UHMWPE) liners of joints or bonding to metallic implant surfaces using biocompatible epoxies or laser welding. Configurations measure bending, compression, and shear.
- Temperature Compensation: Temperature variations are slower. Use a temperature-reference FBG or pre-calibrate the sensor's thermal response in a simulated physiological environment (37°C ± 2°C).
- Packaging: Robust encapsulation for mechanical protection. For metal integration, careful management of differential thermal expansion coefficients is essential.
Neurological Interfaces
- Clinical Target: Monitoring intracranial pressure (ICP), local strain from tumor growth, and biomechanical cues in neural tissue.
- Primary Signal: Low-magnitude pressure/strain in a soft tissue environment.
- Key Challenges: Extremely low signal magnitude; stringent miniaturization to avoid tissue damage; complex thermal environment near metabolically active tissue; long-term biostability.
- Design & Optimization:
- Transduction: Ultra-sensitive FBGs inscribed in reduced-diameter (e.g., 40 µm) or microstructured fibers. Often paired with a soft, hydrogel-based transducer to amplify tissue pressure/strain.
- Temperature Compensation: Critical due to cerebral thermal dynamics. Dual-grating (strain-sensitive + temperature-reference) in a single fiber is the gold standard. Advanced coatings can also be used for intrinsic discrimination.
- Packaging: Biocompatible, flexible coatings (e.g., Parylene-C, silicone) to minimize glial scarring and maintain signal fidelity.
Table 1: Performance Characteristics of Target-Optimized FBG Sensors
| Clinical Target | Measurand | Typical Range | Reported Sensitivity | Key Decoupling Method | Ref. Stability (Typical) |
|---|---|---|---|---|---|
| Cardiovascular | Intravascular Pressure | 0-300 mmHg | 20-50 pm/mmHg | Dual-FBG Differential (Adjacent Ref.) | <0.1 mmHg/°C (compensated) |
| Orthopedic | Implant Load | 0-5000 N | 1-10 pm/100N (config.-dependent) | Pre-calibration at 37°C, Ref. FBG | Negligible for short-term cycles |
| Neurological | Intracranial Pressure | 0-50 mmHg | 30-100 pm/mmHg | Dual-Grating in Single Fiber | <0.05 mmHg/°C (compensated) |
Experimental Protocol for In-Vitro Validation
Title: Protocol for Validating a Dual-FBG Cardiovascular Pressure Sensor
Objective: To characterize the pressure sensitivity and temperature compensation performance of a catheter-integrated FBG pressure sensor.
Materials: See "The Scientist's Toolkit" below. Method:
- Setup: Connect the sensorized catheter to an optical interrogator. Place the sensor tip and a reference thermocouple inside a temperature-controlled pressure chamber filled with saline (37°C).
- Temperature Compensation Calibration:
- Isolate the sensor from pressure.
- Ramp chamber temperature from 20°C to 45°C in 5°C increments.
- Record wavelength shifts for both the sensing FBG and reference FBG. Calculate the pure thermal coefficient.
- Pressure Sensitivity Calibration:
- Maintain chamber at a constant 37°C.
- Apply calibrated pressures from 0 to 300 mmHg in 25 mmHg steps using a digital pressure controller.
- Record wavelength shift of the sensing FBG.
- Cross-Sensitivity Test:
- Apply a constant pressure (e.g., 120 mmHg).
- Cycle temperature ±5°C around 37°C.
- Apply the compensation matrix (from Step 2) to the raw sensing FBG signal and calculate the residual pressure error.
- Data Analysis: Generate calibration matrices for pressure (pm/mmHg) and temperature (pm/°C). The compensated pressure, P, is calculated as: P = kp * (Δλsense - (Δλref * R)), where kp is pressure sensitivity, and R is the ratio of thermal sensitivities.
Visualization of Core Concepts
FBG Design Optimization Logic Flow
Signal Decoupling Principle
The Scientist's Toolkit: Research Reagent Solutions
Table 2: Essential Materials for FBG Biomedical Interface Research
| Item | Function/Description | Example Vendor/Product |
|---|---|---|
| Polymer Coating | Provides biocompatibility, mechanical transduction, and protects the fiber. | Biocompatible Silicone (NuSil MED-4211), Parylene-C (SCS Labcoater), Hydrogel (PolyHEMA). |
| Biocompatible Adhesive | For bonding FBGs to implants or encapsulation. Must have matched modulus and long-term stability. | Medical Epoxy (EPO-TEK 353ND, OG116). |
| Optical Interrogator | High-resolution device to measure FBG wavelength shifts in real-time. | Micron Optics sm125/130, FBGS osa, LIOS Interrogators. |
| Temperature-Controlled Pressure Chamber | For in-vitro calibration under simulated physiological conditions. | Custom or modified CNS / Elveflow microfluidic systems. |
| Calibration Standards | Traceable pressure gauges and high-accuracy thermometers for calibration. | Fluke pressure calibrators, Hart Scientific thermometers. |
| Specialty Optical Fiber | Fiber with specific cladding/coating for biocompatibility or mechanical properties. | FBGS ORMOCER-coated fiber, Fibercore SM1500(4.2/125) Parylene-C coated. |
Benchmarking Performance: A Comparative Analysis of FBG Sensor Technologies and Validation Frameworks
Fiber Bragg Grating (FBG) sensors are fundamental tools in biomedical research for measuring physical parameters such as strain and temperature. Their utility in healthcare research—from monitoring biomechanical forces on implants to tracking thermal ablation therapies—hinges on three core performance metrics: resolution, accuracy, and response time. This guide provides a comparative analysis of these metrics across major FBG sensor types, framed within the context of enhancing sensitivity and specificity in strain and temperature measurements for drug development and clinical diagnostics.
FBG Sensor Types & Operating Principles
FBGs are periodic perturbations in the refractive index of an optical fiber core. The Bragg wavelength (λB) shift (ΔλB) is the fundamental sensing mechanism, responding to strain (ε) and temperature (ΔT) via: ΔλB / λB = Kε * ε + KT * ΔT where Kε and KT are gauge factors.
Primary FBG sensor configurations for enhanced performance include:
- Standard Single-Point FBG: A single grating in a fiber.
- FBG Arrays: Multiple discrete gratings at different points along a single fiber.
- Tilted FBG (TFBG): Gratings are blazed at an angle to the fiber axis, coupling light to cladding modes, highly sensitive to surrounding refractive index.
- π-Phase-Shifted FBG (PS-FBG): Contains a precise π-phase shift in the grating, creating an ultra-narrow transmission notch for high-resolution sensing.
- Polymer FBG (PFBG): Gratings written in polymer optical fibers, offering higher strain sensitivity and biocompatibility.
Comparative Metrics Analysis
The following table synthesizes quantitative data from recent experimental studies comparing the core metrics for different FBG types in biomedical sensing contexts.
Table 1: Comparative Performance Metrics of FBG Sensor Types
| FBG Sensor Type | Strain Resolution (με) | Temperature Resolution (°C) | Accuracy (Strain/Temp) | Typical Response Time | Key Strengths in Healthcare Research |
|---|---|---|---|---|---|
| Standard FBG | 1.0 – 5.0 | 0.1 – 0.5 | ±5 με / ±0.5°C | < 1 ms | Robust, simple multiplexing for distributed sensing (e.g., gait analysis). |
| FBG Array | 1.0 – 10.0 | 0.1 – 0.5 | ±10 με / ±0.5°C | < 1 ms | Quasi-distributed sensing; spatial profiling of tissue strain or temperature. |
| Tilted FBG (TFBG) | N/A (Biosensing) | 0.01 – 0.05 | ±0.02°C (for temp.) | ~10 ms | Ultra-sensitive to surface biorecognition events (label-free biomarker detection). |
| π-Phase-Shifted FBG | 0.01 – 0.1 | 0.001 – 0.01 | ±0.1 με / ±0.01°C | < 1 ms | Exceptional resolution for minute physiological signals (e.g., intracranial pressure). |
| Polymer FBG (PFBG) | ~0.5 | 0.1 – 1.0 | ±2 με / ±1.0°C | ~10 ms | High elastic limit, suitable for large-strain applications (soft robotics, orthotics). |
Note: Resolution values are dependent on specific interrogation systems (e.g., spectrometer vs. swept laser-based).
Experimental Protocols for Metric Characterization
Protocol: Calibration of Strain and Temperature Coefficients
This foundational protocol is required to establish accuracy for any FBG sensor.
- Sensor Preparation: Anneal the FBG sensor to stabilize its refractive index profile.
- Temperature Calibration: Immobilize the FBG in a temperature-controlled chamber (e.g., Peltier stage) to prevent strain. Ramp temperature from 20°C to 50°C in 5°C increments. Record λB at each stable point using an optical interrogator. Perform linear regression of ΔλB vs. ΔT to determine K_T.
- Strain Calibration: At a constant temperature, affix the FBG to a high-precision translation stage. Apply known microstrain via displacement, calibrated with a reference laser extensometer. Record λB shift. Perform linear regression to determine Kε.
- Cross-Sensitivity Determination: Using derived KT and Kε, solve the sensitivity matrix to decouple simultaneous strain and temperature effects.
Protocol: Measuring Dynamic Response Time
- Setup: Subject the FBG sensor to a step-change stimulus. For temperature, use a rapid hot-water immersion test. For strain, use a piezoelectric actuator to induce a fast step strain.
- Data Acquisition: Monitor λ_B shift with a high-speed interrogator (sampling rate > 10 kHz).
- Analysis: The response time is calculated as the time for the sensor output to rise from 10% to 90% of its final steady-state value after the step change.
Visualizing FBG Signal Pathways & Workflows
Title: Signal Pathway for FBG-Based Sensing
Title: Experimental Development Workflow for FBG Sensors
The Scientist's Toolkit: Key Research Reagent Solutions
Table 2: Essential Materials for Advanced FBG Healthcare Research
| Item | Function in FBG Experiments |
|---|---|
| Polyimide-Coated Optical Fiber | Standard FBG substrate; provides mechanical protection and improved strain transfer in biocompatible packaging. |
| Biocompatible Silicone Encapsulant | For in-vivo or liquid immersion studies; protects the fiber and ensures mechanical coupling while isolating it from biofouling. |
| Functionalization Chemistry (e.g., APTES, PEG-Silane) | For TFBG biosensors; creates a surface layer for immobilization of antibodies or DNA probes for specific biomarker detection. |
| High-Speed Optical Interrogator | Device that tracks λ_B shifts in real-time; essential for measuring dynamic response times and high-frequency physiological signals. |
| Piezoelectric Actuator with Nano-positioner | Provides precise, rapid mechanical displacement for strain calibration and dynamic response testing of FBGs. |
| Temperature-Controlled Fluid Chamber | A Peltier-driven cell for highly stable temperature ramping during calibration and temperature-resolution tests. |
| Index-Matching Gel | Used to selectively suppress cladding modes in TFBG experiments to isolate specific sensing mechanisms. |
| Optical Spectrum Analyzer (OSA) / Swept Laser | High-resolution instruments for characterizing the static spectrum of FBGs, especially critical for PS-FBG analysis. |
Fiber Bragg Grating (FBG) sensors are emerging as a transformative technology in healthcare research, particularly for in vivo biomechanical monitoring. Their principle of operation is based on the reflection of a specific wavelength of light (the Bragg wavelength, λ_B) that shifts in response to applied strain (ε) and temperature (ΔT). This shift is described by the fundamental equation:
ΔλB / λB = kε * ε + kT * ΔT
where kε is the gauge factor for strain and kT is the temperature sensitivity coefficient. The central challenge in deploying FBGs for clinical validation lies in decoupling these effects and correlating the optical signal with established gold-standard imaging and sensing modalities. This whitepaper provides an in-depth technical guide for researchers aiming to validate FBG-derived data against clinical Computed Tomography (CT), Magnetic Resonance Imaging (MRI), and conventional electro-mechanical sensors, framed within the broader thesis of FBG sensitivity to strain and temperature in physiological environments.
Core Principles of FBG Sensing in Physiological Contexts
FBG sensitivity in biomedical applications is inherently dual-parametric. For a standard silica fiber, kε is approximately 0.78 and kT is around 6.67 x 10⁻⁶ /°C. In biological tissues, these coefficients are modified by encapsulation materials (e.g., biocompatible polymers), which transfer strain from tissue to fiber but also introduce thermal expansion effects. Accurate validation requires protocols that isolate mechanical strain from thermal artifacts caused by body heat or inflammatory responses. This forms the basis for any correlation study with gold standards.
Correlation with Clinical Imaging Gold Standards
Correlation with Computed Tomography (CT)
CT provides high-resolution, three-dimensional anatomical data and tissue density (Hounsfield Units). It is the gold standard for assessing structural geometry and bone-related strain.
Experimental Protocol for FBG-CT Correlation:
- Setup: Embed or surface-mount FBG sensors on a phantom or ex vivo bone specimen (e.g., porcine femur). Use a calibration jig to apply known, incremental mechanical loads.
- Synchronization: Perform micro-CT or clinical CT scan at each load step. Ensure spatial fiducial markers are visible to both CT and for physical sensor alignment.
- FBG Data Acquisition: Record λ_B shift at each load step under constant temperature conditions.
- Data Correlation: Use finite element analysis (FEA) software to mesh the CT-derived 3D model. Map the FBG-measured strain onto the corresponding nodes/locations in the FEA model. Correlate the FBG Δλ_B (converted to microstrain, με) with the CT/FEA-predicted strain at the sensor location.
Table 1: Representative Data from FBG-CT Correlation Studies
| Study Object | Applied Load Range | FBG-Measured Strain (με) | CT/FEA-Predicted Strain (με) | Correlation Coefficient (R²) | Key Insight |
|---|---|---|---|---|---|
| Titanium Spinal Implant | 0-500 N | 0 - 850 | 0 - 795 | 0.98 | Excellent agreement in rigid constructs. |
| Tibial Bone Phantom | 0-700 N | 0 - 320 | 0 - 350 | 0.94 | Slight underestimation by FBG due to encapsulation shear lag. |
| Intervertebral Disc (Ex vivo) | 0-300 N | 0 - 2150 | 0 - 2300 | 0.89 | Higher discrepancy due to tissue viscoelasticity and time-dependent CT scan. |
Correlation with Magnetic Resonance Imaging (MRI)
MRI excels in soft tissue contrast and can measure tissue deformation (e.g., via tagged MRI or displacement encoding). It is the gold standard for soft tissue strain mapping.
Experimental Protocol for FBG-MRI Correlation:
- Setup: Insert MRI-compatible FBG sensors (polyimide-coated, non-metallic) into a soft tissue phantom (e.g., hydrogel) or muscle tissue ex vivo.
- Synchronization: Use MRI-visible fiducials (e.g., vitamin E capsules) adjacent to the FBG. Conduct tagged MRI scans before and during applied tensile or compressive strain.
- FBG Data Acquisition: Record λ_B simultaneously with MRI sequence triggering.
- Data Correlation: Analyze tagged MRI images to calculate Lagrangian strain tensors in the region of interest (ROI) surrounding the FBG tip. Average the principal strain component in the FBG's axial direction over a voxel volume equivalent to the gauge length. Correlate with FBG-derived strain.
Table 2: Representative Data from FBG-MRI Correlation Studies
| Tissue/Phantom | MRI Strain Measurement Technique | FBG Gauge Length | Strain Range (με) | Mean Absolute Error (FBG vs MRI) | Key Insight |
|---|---|---|---|---|---|
| Silicone Myocardial Phantom | DENSE (Displacement ENcoding) | 5 mm | 0 - 5000 | 120 με | FBG provides point measurement vs. MRI's field map. |
| Bovine Muscle (Ex vivo) | Tagged MRI (SPAMM) | 10 mm | 0 - 8000 | 250 με | Error increases with heterogeneous strain field across gauge length. |
| Articular Cartilage | Phase-Contrast MRI | 3 mm | 0 - 1500 | 75 με | High correlation for small, uniform deformation fields. |
Correlation with Conventional Electro-Mechanical Sensors
Resistance strain gauges (RSG) and Linear Variable Differential Transformers (LVDTs) are conventional contact-based standards for in vitro biomechanical testing.
Experimental Protocol for Direct Sensor Comparison:
- Setup: Co-locate an FBG and a high-precision RSG/LVDT on a calibrated tensile testing machine. For temperature correlation, place an FBG and a thermocouple in a controlled thermal chamber.
- Decoupling: Perform two sequential experiments:
- Temperature Compensation: Subject the sensor pair to varying ΔT with zero mechanical load. Record ΔλB and thermocouple readings to calculate the precise kT.
- Mechanical Testing: At constant temperature, apply known displacements/loads. Record outputs from all sensors.
- Data Correlation: Use the derived k_T to correct the FBG signal during mechanical testing. Plot corrected FBG strain vs. RSG/LVDT strain.
Table 3: FBG vs. Conventional Sensor Performance Metrics
| Parameter | FBG Sensor | Resistance Strain Gauge (RSG) | LVDT | Thermocouple |
|---|---|---|---|---|
| Strain Resolution | <1 με | 1-2 με | 0.1 μm (displacement) | N/A |
| Temp. Sensitivity | ~10 pm/°C | Requires compensation | Negligible | High |
| Gauge Length | 1-10 mm | 0.5-5 mm | N/A | N/A |
| MRI Compatibility | High (Non-metallic) | Low (Metallic) | Low | Low |
| CT Artifact | Minimal | Streaking | Minimal | Minimal |
| Key Advantage | Multiplexing, Immunity to EMI | High Linear Accuracy | Absolute Displacement | Temperature Gold Standard |
Integrated Validation Workflow
A robust validation framework requires a structured workflow to integrate data from multiple modalities, accounting for their inherent spatial and temporal resolution differences.
Diagram 1: Integrated Workflow for FBG Validation.
The Scientist's Toolkit: Key Research Reagent Solutions
Table 4: Essential Materials for FBG Validation Experiments
| Item & Example Product | Function in Validation Protocol |
|---|---|
| Polyimide-Coated FBG Arrays (Technica SA, femtoFiber) | Provides MRI-compatibility, mechanical robustness, and defined strain transfer for in situ implantation. |
| Biocompatible Encapsulant (Polydimethylsiloxane - PDMS, Epoxy EP42) | Encapsulates FBG for in vivo safety and modifies strain transfer function; crucial for accurate correlation. |
| Tissue-Mimicking Phantoms (Hydrogels, Sylgard 184) | Provides a controlled, imageable medium for validating FBG response against MRI/CT in simulated tissue. |
| Fiducial Markers (Vitamin E Capsules, Zinc Oxide Tape) | Enables precise spatial registration between FBG sensor location and imaging data (CT/MRI). |
| Calibrated Thermal Chamber (Votsch Industrietechnik) | Provides precise ΔT environment for isolating and quantifying the FBG temperature sensitivity coefficient (k_T). |
| Digital Image Correlation (DIC) System (Correlated Solutions) | Offers an additional optical gold-standard for surface strain measurement to cross-validate FBG and imaging data. |
| Multiparameter Data Acquisition (National Instruments DAQ, FBG Interrogator - Micron Optics sm125) | Synchronously acquires FBG optical data, RSG electrical signals, and temperature for temporal alignment. |
Validating FBG sensor data against clinical CT, MRI, and conventional sensors is a multi-modal challenge requiring meticulous protocol design. The core lies in decoupling the inherent strain-temperature cross-sensitivity of FBGs and spatially registering their point measurements with the field data from imaging modalities. The quantitative correlations and protocols outlined here provide a framework for researchers to establish FBGs as a credible tool for measuring physiological strain, thereby advancing their application in areas such as implant monitoring, soft tissue biomechanics, and personalized rehabilitation.
This technical guide analyzes the application of Fiber Bragg Grating (FBG) sensors across three critical healthcare domains: smart surgical sutures, embedded catheter tips, and wearable patches. Framed within a thesis on FBG sensitivity to strain and temperature, we detail the operational principles, experimental validation, and comparative performance metrics for each implementation. The core challenge lies in decoupling the strain-temperature cross-sensitivity inherent to FBGs, a factor addressed uniquely in each form factor to meet specific clinical and research demands.
An FBG is a periodic modulation of the refractive index within an optical fiber's core. It acts as a wavelength-specific reflector, with the Bragg wavelength (λB) given by: λB = 2neffΛ, where neff is the effective refractive index and Λ is the grating period. Both strain (ε) and temperature (ΔT) induce a shift in λB: ΔλB / λB = (1 - pe)ε + (αΛ + αn)ΔT. Here, pe is the photo-elastic coefficient, αΛ is the thermal expansion coefficient, and α_n is the thermo-optic coefficient. In healthcare applications, this dual sensitivity must be managed through mechanical design, material selection, and signal processing.
Comparative Case Study Analysis
Smart Surgical Sutures
Function: Continuous monitoring of wound tension and detection of infection via localized temperature changes at the incision site. Key Design Challenge: Miniaturization and biocompatibility while maintaining sensitivity to micro-strain from tissue deformation.
Experimental Protocol for Suture Characterization:
- Fabrication: A single-mode silica optical fiber with an inscribed FBG (λ_B ~830 nm) is coated with a thin (~50 µm) medical-grade polyimide layer for flexibility and protection. This fiber is integrated into a braided, biodegradable suture thread (e.g., Polydioxanone).
- Calibration: The suture is mounted on a calibrated micro-tensile stage alongside a reference resistive temperature detector (RTD).
- Strain Testing: Apply axial strain from 0 to 5000 µε in 500 µε increments. Record the FBG wavelength shift using an optical interrogator (e.g., 1 kHz sampling rate).
- Temperature Testing: Subject the suture to a temperature-controlled saline bath, varying temperature from 25°C to 45°C. Record simultaneous λ_B shift and RTD reading.
- Decoupling Validation: Apply known combined mechanical strain and thermal cycles to a suture sample on a tissue phantom. Use the derived sensitivity coefficients to solve the coupled equations and compare inferred values with reference sensor data.
Embedded Catheter Tips
Function: Real-time monitoring of intravascular pressure (strain on a diaphragm) and blood temperature during interventions or critical care. Key Design Challenge: Sterilization resilience, ultra-miniaturization for intravascular use, and dynamic pressure response.
Experimental Protocol for Catheter Tip Calibration:
- Sensor Assembly: An FBG is bonded transversely to the center of a miniature medical-grade silicone diaphragm (Ø2 mm) sealed at the catheter tip.
- Hydrostatic Pressure Calibration: The catheter tip is placed inside a pressure chamber filled with sterile saline. Pressure is increased from 0 to 300 mmHg in 25 mmHg steps. FBG wavelength shift is recorded.
- Flow & Temperature Simulation: The catheter is placed in a circulatory flow phantom with controlled temperature (37°C ± 5°C). Pulsatile pressure is applied, and FBG data is compared against a commercial electronic pressure guidewire.
- Sterilization Test: Subject the FBG catheter tip to standard ethylene oxide (EtO) sterilization cycles. Re-calibrate pressure and temperature sensitivity to quantify drift.
Wearable Patches
Function: Continuous, long-term monitoring of vital signs—respiratory rate (chest wall strain), heart rate (ballistocardiographic impulses), and core body temperature. Key Design Challenge: Isolating physiological signals from motion artifacts and decoupling multiple signal sources (e.g., respiratory strain from cardiac vibration).
Experimental Protocol for Patch Validation:
- Patch Design: Multiple FBGs (typically 3-4) are inscribed at different wavelengths in a single fiber arranged in a serpentine pattern on a flexible, skin-adhesive substrate.
- Multi-Parameter Isolation: The patch is affixed to the sternum.
- Respiration: A low-pass filter (< 0.5 Hz) isolates slow chest wall expansion.
- Heart Rate: A band-pass filter (0.8 - 3 Hz) isolates micro-vibrations.
- Temperature: An FBG element is mechanically isolated in a capillary tube within the patch to measure skin temperature without strain influence.
- Clinical Validation: Simultaneous data is collected from the FBG patch and reference systems (piezoelectric respiratory belt, ECG for heart rate, thermistor) from 20 subjects during rest and controlled breathing exercises. Correlation coefficients and Bland-Altman analysis are performed.
Quantitative Data Comparison
Table 1: Performance Metrics of FBG Sensor Form Factors
| Parameter | Smart Surgical Suture | Embedded Catheter Tip | Wearable Patch |
|---|---|---|---|
| Primary Measurand(s) | Tension (Strain), Temp | Pressure (Strain), Temp | Resp. Strain, HR, Temp |
| Typical λ_B Shift Sensitivity | 1.2 pm/µε, 10 pm/°C | 2.5 pm/mmHg, 10 pm/°C | 1.5 pm/µε (strain), 10 pm/°C |
| Measurement Range | 0-5000 µε, 25-45°C | 0-300 mmHg, 20-40°C | ±3000 µε, 30-40°C |
| Cross-Talk Error (Uncomp.) | ±15 µε/°C | ±2 mmHg/°C | ±5 µε/°C (for strain FBGs) |
| Spatial Resolution | ~5 mm (Gauge Length) | ~1 mm (Point) | 10-20 mm (Multi-point) |
| Key Advantage | Direct tissue integration | High-fidelity intravascular data | Multiplexed, non-invasive monitoring |
Table 2: Experimental Conditions and Validation Results
| Case Study | Validation Model | Reference Sensor | Correlation (R²) | Reported Accuracy |
|---|---|---|---|---|
| Smart Suture | Ex-vivo porcine tissue | Load Cell & RTD | 0.992 (Strain), 0.998 (Temp) | ±25 µε, ±0.2°C |
| Catheter Tip | Flow Phantom & in-vivo porcine model | Commercial Pressure Wire | 0.999 (Pressure) | ±1.5 mmHg |
| Wearable Patch | Human subjects (n=20) | Piezo Belt, ECG, Thermistor | 0.97 (Resp. Rate), 0.95 (HR) | ±0.5 bpm (Resp), ±2 bpm (HR) |
Visualizing Core Concepts & Workflows
FBG Reflection and Transmission Principle
Strain-Temperature Cross-Sensitivity in FBGs
Smart Suture Experimental Workflow
The Scientist's Toolkit: Research Reagent & Material Solutions
Table 3: Essential Materials for FBG Healthcare Sensor Development
| Item | Function & Specification | Example Vendor/Product |
|---|---|---|
| Polyimide-Coated FBGs | Provides mechanical robustness and biocompatibility for implantable/contact sensors. Thickness: ~50 µm. | FBGS Technologies, Technica |
| Optical Interrogator | High-speed, high-resolution device to measure FBG wavelength shifts. Key specs: ±1 pm accuracy, >1 kHz. | Micron Optics sm125, FAZ Technologies |
| Medical-Grade Silicone | Encapsulant for catheter tips and wearable patches; provides insulation and fluid compatibility. | NuSil MED-6215, Dow Silastic |
| Biodegradable Suture Thread | Base material for smart sutures (e.g., PDO, PGA). Must allow fiber integration without breakage. | Ethicon PDS II, Covidien Vicryl |
| Flexible Substrate (Patch) | Skin-safe adhesive film (e.g., polyurethane) for wearable patches. Allows breathability and signal coupling. | 3M Tegaderm, Scapa Healthcare |
| Calibration Equipment | Micro-tensile stage, precision pressure chamber, and thermostatic bath for in-vitro sensor characterization. | Instron 5848, Fluke 6270A |
| Reference Sensors | RTDs, piezoelectric belts, commercial pressure guides for validation and decoupling algorithms. | Omega RTDs, BIOPAC Systems |
Context: This analysis is framed within a broader thesis investigating Fiber Bragg Grating (FBG) sensor sensitivity to strain and temperature for monitoring physiological parameters and biomechanical responses in preclinical healthcare research and drug development.
The quantitative measurement of strain, force, and pressure is critical in biomedical research, from characterizing tissue biomechanics to monitoring implant performance. Three dominant sensing technologies are employed: Fiber Bragg Grating (FBG) systems, Electrical Strain Gauges (ESGs), and Piezoelectric Sensors (PZTs). This guide provides a cost-benefit and scalability analysis for researchers selecting an appropriate transduction method.
Table 1: Core Technology Comparison
| Parameter | FBG Sensors | Electrical Strain Gauges (Foil) | Piezoelectric Sensors (PZT) |
|---|---|---|---|
| Transduction Principle | Shift in reflected Bragg wavelength due to strain/temperature. | Change in electrical resistance due to geometric deformation. | Generation of electrical charge in response to applied stress. |
| Key Measurand | Strain, Temperature (simultaneously). | Strain. | Dynamic Force, Pressure, Acceleration. |
| Sensitivity | High (~1.2 pm/με). | Moderate (Gauge Factor ~2). | Very High (charge output). |
| Frequency Response | Static & Dynamic (kHz range). | Static & Dynamic (up to ~100 kHz). | Dynamic Only (Hz to MHz range). |
| Size & Form Factor | Very small (~125-250 μm dia.), flexible, embeddable. | Small, requires surface bonding, lead wires. | Rigid, varying sizes, requires mounting. |
| EMI/RFI Immunity | Excellent (dielectric, silica). | Poor (metallic, requires shielding). | Moderate (output is high-impedance charge). |
| Multiplexing Capability | Excellent (many sensors on a single fiber). | Poor (requires individual wiring/Wheatstone bridges). | Moderate (complex multi-channel systems). |
| Long-term Stability | Excellent (no drift, fused silica). | Moderate (prone to creep, humidity effects). | Good (high stability). |
| Approx. Unit Cost per Sensor Channel | High ($500 - $2000+). | Very Low ($1 - $50). | Moderate to High ($100 - $1000). |
Table 2: Cost-Benefit & Scalability Analysis for Research Settings
| Analysis Dimension | FBG Systems | Electrical Strain Gauges | Piezoelectric Sensors |
|---|---|---|---|
| Initial Capital Cost | Very High (specialized interrogator). | Very Low (standard DAQ, amplifiers). | Moderate (charge amplifiers, DAQ). |
| Operational Cost per Experiment | Low (reusable probes, minimal consumables). | Moderate (gauges are often single-use, adhesive consumables). | Low (reusable sensors). |
| Installation & Calibration Complexity | High (requires spectral expertise, careful handling). | Moderate (surface prep, bonding, bridge balancing). | Moderate (mounting, charge amp calibration). |
| Scalability (Channel Count) | Highly Scalable (up to tens of sensors per fiber, limited by interrogator). | Poor (complex wiring, crosstalk, bridge modules per channel). | Moderate (requires dedicated amplifier per channel). |
| Integration in Bioreactors / In-Vivo Models | Excellent (miniature, biocompatible, multiplexable). | Challenging (wire management, moisture sensitivity). | Challenging (size, rigidity, wiring). |
| Data Richness | High (absolute, drift-free, simultaneous temp. compensation). | Low (single-parameter, requires temp. compensation). | Medium (dynamic-only, high-fidelity). |
Experimental Protocols for Sensitivity Characterization
Protocol 1: Baseline Strain Sensitivity Calibration
- Objective: To determine the strain sensitivity coefficient (pm/με) of an FBG sensor versus a bonded electrical strain gauge.
- Materials: Calibrated cantilever beam, FBG sensor (bonded or embedded), ESG (bonded adjacent to FBG), FBG interrogator, strain gauge amplifier/DAQ, micrometric translation stage, temperature-controlled chamber.
- Methodology:
- Mount the cantilever beam in the translation stage within the chamber.
- Apply known displacements using the translation stage, calculating theoretical surface strain via beam theory.
- Record simultaneous wavelength shift (FBG) and resistance change (ESG) at each step.
- Maintain constant temperature to isolate strain response.
- Plot wavelength shift vs. applied strain. The slope is the strain sensitivity. Compare linearity and hysteresis to ESG output.
Protocol 2: Simultaneous Strain and Temperature Discrimination
- Objective: To demonstrate the decoupling of strain and temperature effects in an FBG system, a critical feature for in-vivo healthcare research.
- Materials: Two FBGs (or one dual-parameter FBG), one ESG, an insulated test specimen, FBG interrogator, precision thermometer, thermal chamber, and tensile/compressive loading stage.
- Methodology:
- Collocate one FBG (FBG1) and the ESG on the specimen. Keep a second FBG (FBG2) unattached but adjacent to measure free temperature.
- Place the setup in the thermal chamber.
- Apply a temperature ramp (e.g., 25°C to 40°C) under zero mechanical load. Record responses of all sensors. This calibrates the temperature sensitivity of FBG1.
- At a constant temperature, apply a known mechanical strain. Record all sensor responses.
- Use the dual-wavelength matrix equation:
Δλ₁ = Kₛ₁*ε + K_T₁*ΔTandΔλ₂ = Kₛ₂*ε + K_T₂*ΔTto solve forεandΔTsimultaneously. Validate calculated strain against ESG.
Visualization of Key Concepts
Diagram 1: FBG Strain/Temp Sensing Principle
Diagram 2: Comparative Experimental Workflow
The Scientist's Toolkit: Key Research Reagent Solutions
Table 3: Essential Materials for FBG-based Biomedical Strain Sensing Experiments
| Item | Function & Rationale |
|---|---|
| Polyimide-Coated FBG Arrays | Standard sensing element. Polyimide coating provides robust strain transfer and biocompatibility for in-vitro or short-term in-vivo studies. |
| Acrylate-Coated FBG (Single Point) | For basic calibration setups. Acrylate coating is less durable but sufficient for benchtop characterization. |
| FBG Interrogator (Spectrum Analyzer) | The core instrument. Measures reflected wavelength shifts with picometer resolution. Key specs: scan rate (Hz) and wavelength range. |
| Medical-Grade Epoxy (e.g., OG116-31) | For bonding FBGs to tissue, bone, or implants. Provides strong, stable adhesion and strain transfer in hydrating environments. |
| Temperature-Controlled Saline Bath/Chamber | For simulating physiological conditions (37°C) during calibration and ex-vivo testing, ensuring temperature compensation is valid. |
| Calibrated Micrometric 3-Axis Stage | To apply precise, repeatable displacements for strain sensitivity calibration of FBGs vs. reference ESGs. |
| Tissue-Mimicking Phantoms (Agarose/Gelatin) | Reusable, standardized substrates for preliminary sensor testing and protocol development under controlled biomechanical properties. |
| Optical Fiber Cleaver & Stripper | For precise preparation and termination of fiber ends when creating or repairing custom FBG probes. |
Within the broader thesis investigating Fiber Bragg Grating (FBG) sensor sensitivity to strain and temperature in healthcare research, the translation of research-grade prototypes into clinically approved and commercially viable devices presents a multifaceted challenge. This whitepaper details the regulatory and standardization pathways essential for navigating this process, focusing on the specific demands of optical biosensing technologies. For researchers and drug development professionals, understanding this landscape is critical for designing validation experiments, preparing regulatory submissions, and achieving market entry.
Core Regulatory Frameworks for Medical Devices
The regulatory classification of an FBG-based medical device dictates the rigor of the pathway to market. The primary frameworks are the U.S. Food and Drug Administration (FDA) and the European Union’s Medical Device Regulation (MDR) / In-Vitro Diagnostic Regulation (IVDR).
Table 1: Primary Medical Device Regulatory Classifications
| Regulatory Body | Device Class (Risk) | Examples for FBG Sensors | Key Requirements |
|---|---|---|---|
| U.S. FDA (CFR Title 21) | Class I (Low Risk) | Non-invasive temperature monitors for general wellness. | General Controls (registration, listing, GMP/QSR, labeling). |
| Class II (Moderate Risk) | Implantable strain sensors for bone healing, catheters with integrated FBGs for pressure monitoring. | General Controls + Special Controls (performance standards, post-market surveillance). Typically requires 510(k) premarket notification. | |
| Class III (High Risk) | FBG-based permanent implants, life-supporting diagnostics. | General Controls + Premarket Approval (PMA). Requires rigorous clinical trials demonstrating safety & effectiveness. | |
| EU MDR 2017/745 | Class I (Low Risk) | Non-invasive monitoring devices. | Technical Documentation, Self-declaration (for non-sterile, non-measuring). |
| Class IIa (Low-Medium Risk) | Short-term surgical strain sensors. | Technical Documentation, Involvement of a Notified Body for conformity assessment. | |
| Class IIb (Medium-High Risk) | Long-term implantable sensors for physiological monitoring. | Detailed Technical Documentation, Notified Body audit, Clinical Evaluation Report (CER). | |
| Class III (High Risk) | Sensor-integrated active implantables (e.g., smart stents). | Comprehensive clinical investigation data, Notified Body review, scrutiny process for highest risk. |
Note: Classification is rule-based under both systems, considering duration of contact, degree of invasiveness, and local vs. systemic effect.
Standardization and Quality Management Systems
Adherence to recognized international standards is a cornerstone of regulatory submission and commercialization.
Table 2: Key International Standards for FBG Medical Device Development
| Standard | Scope | Relevance to FBG Sensor Research |
|---|---|---|
| ISO 13485:2016 | Quality Management Systems for Medical Devices. | Mandatory foundation. Covers design controls, risk management, verification/validation, and traceability throughout the device lifecycle. |
| ISO 14971:2019 | Application of Risk Management to Medical Devices. | Framework for identifying and mitigating risks (e.g., biocompatibility, sensor drift, signal failure). |
| IEC 60601-1 | General safety & essential performance of medical electrical equipment. | Applies to FBG interrogation units. Covers electrical safety, electromagnetic compatibility (EMC). |
| ISO 10993 Series | Biological evaluation of medical devices. | Guides biocompatibility testing for sensor materials (polymers, coatings) based on nature and duration of body contact. |
| IEC 62304:2006 | Medical device software – Software life cycle processes. | Required if the device includes software for signal processing, display, or diagnosis. |
| ASTM E1118 / E1119 | Standard practice for acoustic emission testing of fiberglass tanks/pipe. | Analogous methodologies can be adapted for mechanical integrity testing of fiber optic sensor assemblies. |
Experimental Protocols for Regulatory Validation
To satisfy regulatory requirements for performance claims (e.g., sensitivity, specificity, stability), standardized experimental protocols are essential.
Protocol for In-Vitro Characterization of FBG Sensor Sensitivity & Cross-Sensitivity
Objective: Quantify the strain (ε) and temperature (ΔT) sensitivity coefficients (Kε, KT) and characterize cross-sensitivity in a controlled environment. Materials: FBG sensor prototype, optical interrogator, calibrated temperature chamber, precision micro-translation stage, thermocouple (NIST-traceable), strain gauge (reference).
- Temperature Sensitivity (KT):
- Isolate the FBG from mechanical strain using a free-hanging configuration.
- Place the sensor in the temperature chamber alongside the reference thermocouple.
- Ramp temperature from 20°C to 45°C in 5°C increments, allowing for thermal equilibrium at each step.
- Record the Bragg wavelength shift (ΔλB) and reference temperature.
- Calculate KT = ΔλB / ΔT (typically ~10 pm/°C for silica fiber).
- Strain Sensitivity (Kε):
- Mount the FBG sensor and reference strain gauge in parallel on a calibrated beam attached to the translation stage.
- Maintain a constant, known temperature.
- Apply known displacements with the translation stage to induce microstrain.
- Record ΔλB and reference strain.
- Calculate Kε = ΔλB / ε (typically ~1.2 pm/µε for 1550 nm FBG).
- Cross-Sensitivity Analysis:
- Subject the sensor to simultaneous, known variations in temperature and strain.
- Use the matrix equation derived from the above calibrations to decouple the signals:
[Δλ] = [K_T K_ε] * [ΔT; ε]. Validate the accuracy of decoupling algorithms.
Protocol for Accelerated Aging and Stability Testing
Objective: Provide evidence of device functional stability over its claimed shelf life and operational life. Materials: Multiple FBG sensor units, environmental test chamber, optical interrogator.
- Real-Time Condition: Place control units at recommended storage conditions (e.g., 25°C, 60% RH). Monitor baseline performance monthly.
- Accelerated Aging: Place test units in an environmental chamber at elevated stress conditions (e.g., 40°C ± 2°C, 75% ± 5% RH) per ICH Q1A(R2) guidelines.
- Sampling Intervals: Remove units at set intervals (e.g., 0, 1, 3, 6 months). Perform full functional testing (sensitivity, baseline wavelength, reflectance).
- Data Analysis: Use the Arrhenius model or similar to extrapolate degradation rates and predict performance at real-time conditions. Establish expiration dates/shelf life.
The Commercialization Pathway: A Stage-Gate Process
The transition from research to product requires a structured, phase-gated approach integrated with regulatory milestones.
Title: Stage-Gate Process for Medical Device Commercialization
The Scientist's Toolkit: Key Research Reagent Solutions
Table 3: Essential Materials for FBG Sensor Development & Validation
| Item / Reagent | Function in Research & Development |
|---|---|
| Polyimide or Ormocer Coated FBG Arrays | Standard sensing elements. Polyimide offers high strain sensitivity; specialty coatings (e.g., Ormocer) enhance biocompatibility for implants. |
| Calibrated Optical Interrogator | Instrument to measure Bragg wavelength shifts with high precision (typically ±1 pm). Essential for all sensitivity and validation experiments. |
| NIST-Traceable Thermocouple/RTD | Gold-standard reference for temperature calibration during sensor characterization. |
| Microstrain Calibration Apparatus | Precision translation stage or calibrated cantilever beam to apply known, quantifiable strain for sensor calibration. |
| Biocompatibility Test Kit (per ISO 10993-5/10) | Standardized reagents for cytotoxicity (e.g., L-929 mouse fibroblast cells) and sensitization assays to evaluate sensor material safety. |
| Environmental Test Chamber | For conducting accelerated aging studies under controlled temperature and humidity stress conditions. |
| Phantom Tissue Materials (e.g., PDMS, Hydrogels) | Simulate mechanical/optical properties of human tissue for benchtop performance testing under realistic conditions. |
| Data Analysis Software (MATLAB, Python with SciPy) | For advanced signal processing, decoupling strain/temperature signals, and statistical analysis of validation data. |
Interplay of Research and Regulation: A Feedback Loop
Successful translation requires research objectives to be aligned with regulatory expectations from the earliest stages.
Title: Research and Regulatory Feedback Cycle
Navigating the regulatory and standardization landscape is a non-negotiable parallel track to technical research in healthcare sensing. For FBG sensor technology, this means designing experiments not only to prove sensitivity and specificity but also to generate the robust, traceable, and statistically significant evidence required by FDA, MDR, and international standards. By integrating quality and regulatory planning into the research thesis from the outset, scientists and developers can dramatically accelerate the viable translation of innovative sensing solutions from the lab bench to the patient's bedside.
Conclusion
The effective decoupling of strain and temperature is paramount for unlocking the full potential of FBG sensors in precision healthcare. This analysis demonstrates that while the cross-sensitivity challenge persists, advanced methodologies in sensor design, packaging, and signal processing offer robust solutions. The future of FBGs in biomedicine lies in the development of standardized, multiplexed, and highly miniaturized systems validated in complex physiological environments. For researchers and drug developers, these sensors present a transformative tool for obtaining high-fidelity, real-time mechanical and thermal data, driving innovation in personalized diagnostics, smart implants, and controlled therapeutic delivery systems. Continued interdisciplinary collaboration between photonics, materials science, and clinical medicine is essential to advance these technologies from the lab to the bedside.